Part 3: Electric Utilities
Summary
- Utilities are historically viewed as a defensive play given stable dividend yields and EPS growth rates. Analyzing yield and valuation is more straightforward relative to BDCs and midstream equities with the two most common approaches being relative P/E ratios (vs S&P 500) and dividend yield relative to bond benchmarks.
- Growth in AI and the resulting need for more data centers is likely to cause higher EPS growth for electric utilities as their capex increases, setting the stage for attractive total returns. We provide an overview of this secular trend and discuss how it impacts their net income.
- Our focus is on the “XLU” ETF rather than individual companies, but given our scenarios on valuation and EPS growth, we think high single digit total returns are likely over a longer-term holding period and therefore find XLU attractive at current levels.
Introduction
In Part 3 of our High Yielding Equity Series, we look at Regulated Electric Utilities (Utilities) – an historically defensive and interest rate sensitive play. Throughout this report, we discuss Utilities by referencing the S&P 500 Utilities Sector Index, which can be owned via the investable XLU ETF and as the XLU tracks the Index, we reference both interchangeably.
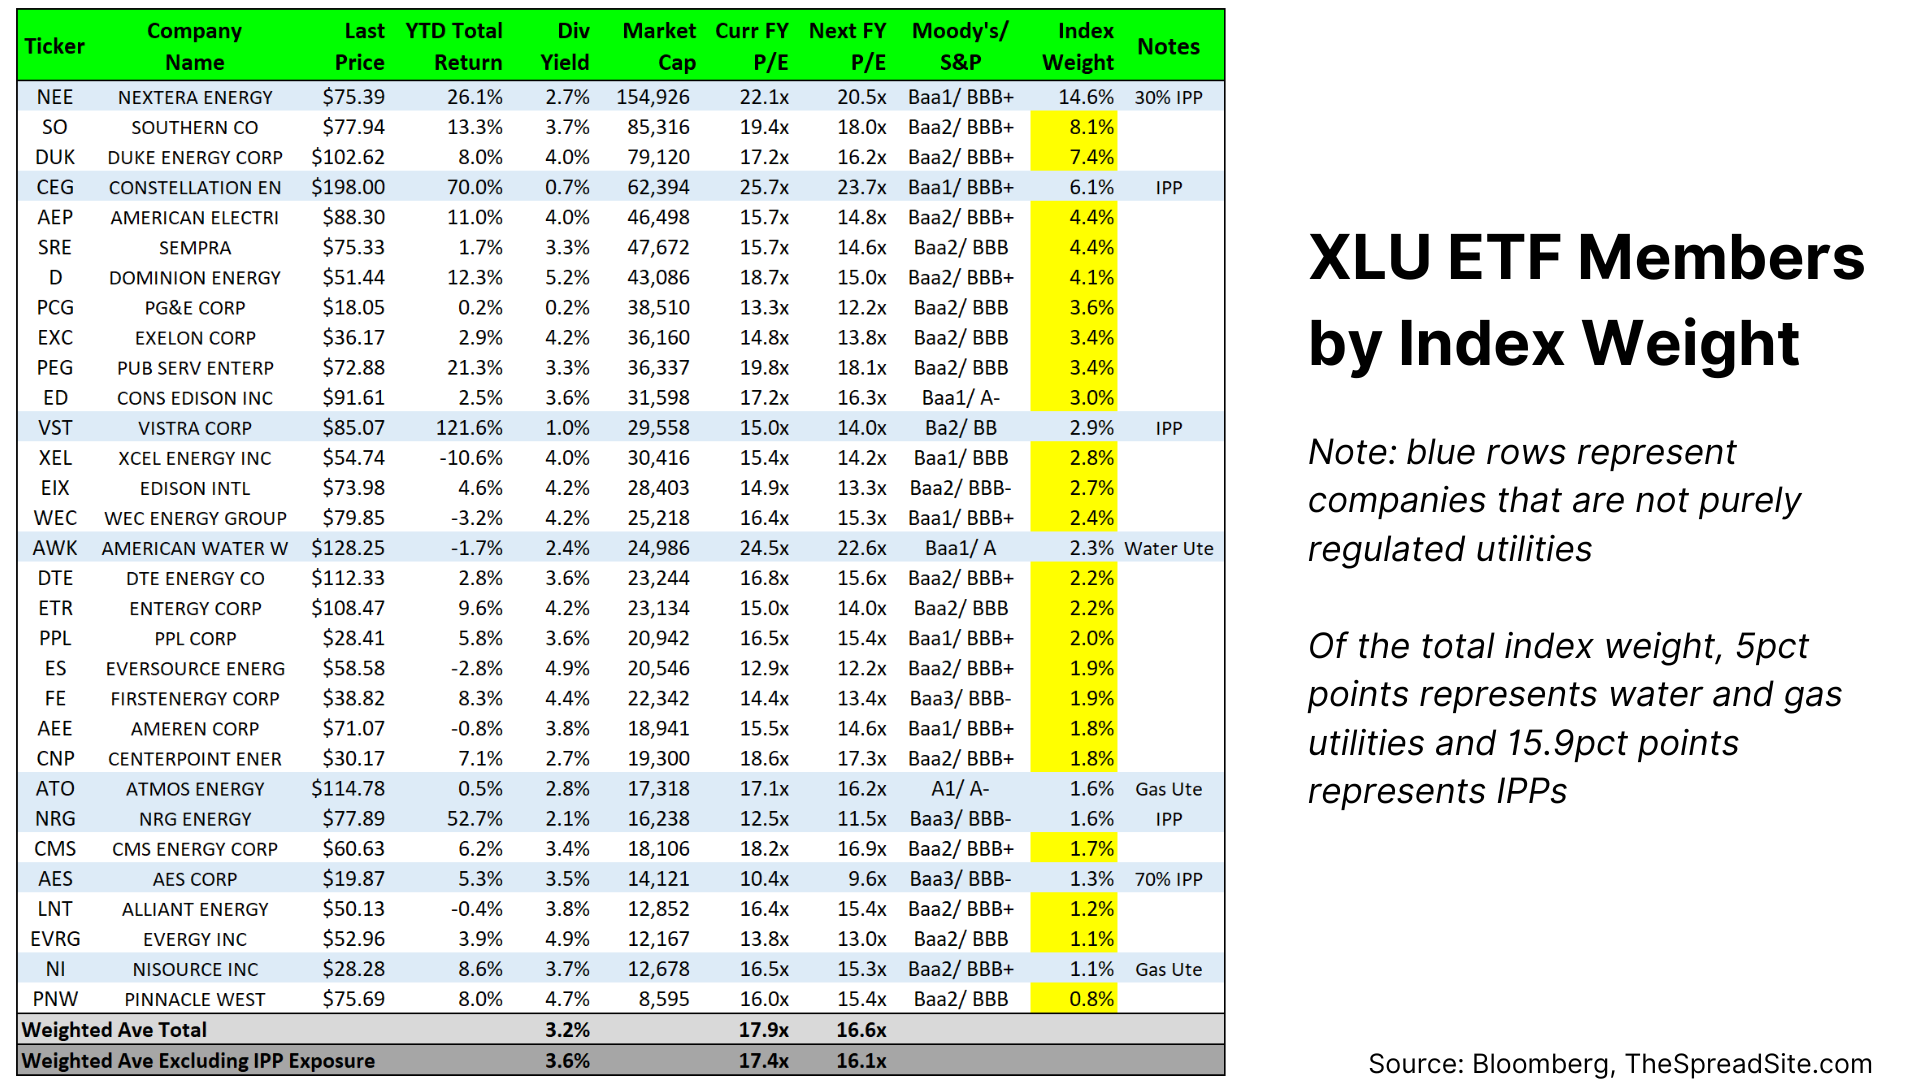
While XLU contains a ~16% weighting to non-regulated Independent Power Producers (IPPs), a majority weight is in Utilities and represents a comprehensive data set (for NEE and AES containing a mix of regulated and non-regulated, we sum their non-regulated proportions to get to ~16%).
Quick Note on IPPs: An IPP owns merchant (i.e. non-regulated) power plants and sells power into the open market or under contract. Earnings are generally driven by a spread of commodity input costs to power prices with increasing marginal cost power plants setting a clearing price as demand increases. Dividends from IPPs are generally lower and less stable compared to Utilities with dramatically higher earnings volatility.
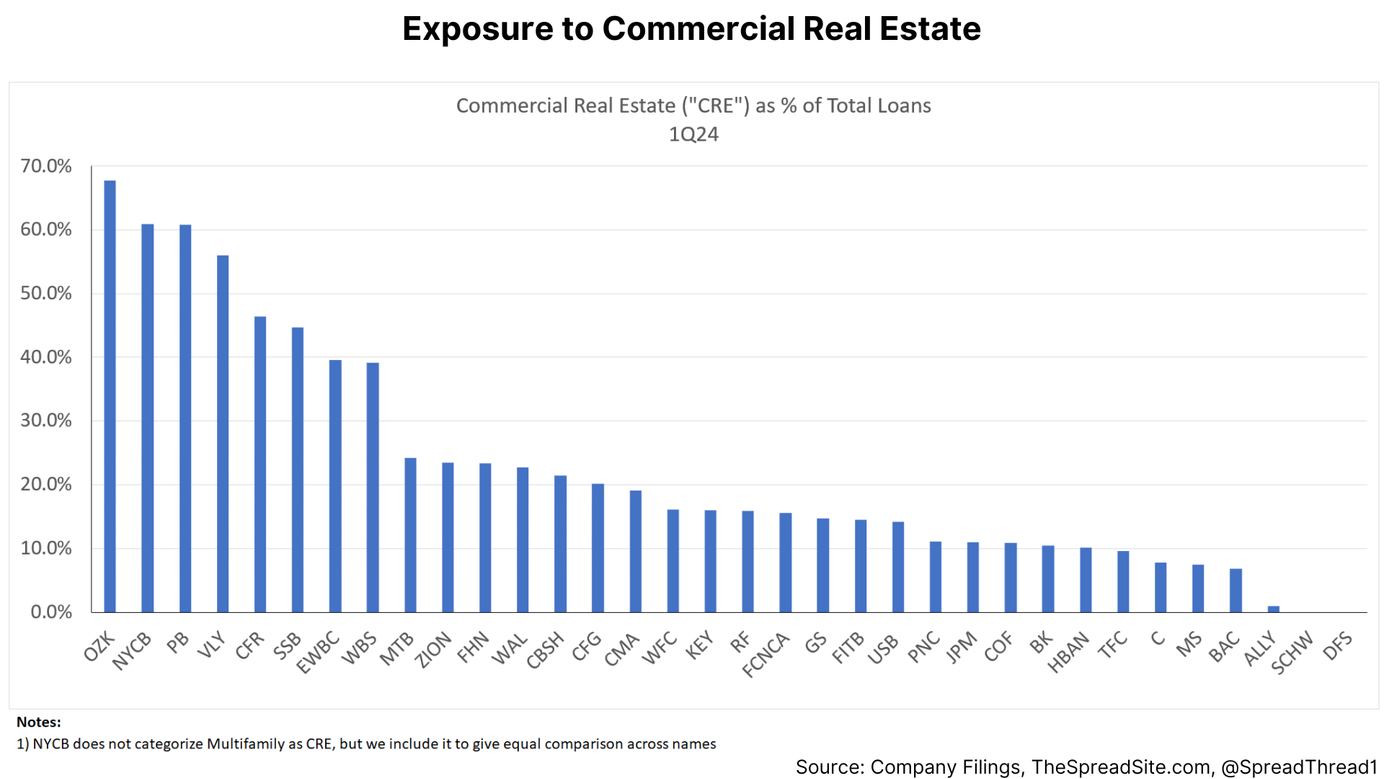
A look at the index makeup is below with companies not categorizes as regulated electric utilities shown in blue.
Each Utility has idiosyncratic factors driving valuation and performance with a few listed below:
- Regulatory environment within the operating State allowing for higher or lower returns on equity (ROE)
- Extreme weather risk within the operating geography
- Demand trends (residential, commercial, and industrial) within the operating geography
- Operating and capital efficiency of the operating company
- Total leverage (discussed more in the Overview section)
Utilities are considered defensive as their ROE is set by regulators with growth and dividend payout ratios being relatively stable and predictable. Further, costs subject to inflationary or deflationary pressures are generally passed along to customers (albeit on a lag). This is not to say total returns are completely fixed and we discuss the variables below.
Valuation is typically based on relative P/E ratios (vs S&P 500) and/or a dividend yield spread measure with overall macro conditions driving periods of higher or lower ratios.
Given idiosyncrasies within individual stocks, we do not make specific company recommendations and focus on the diversified sector.
Electric Utility Sector Overview
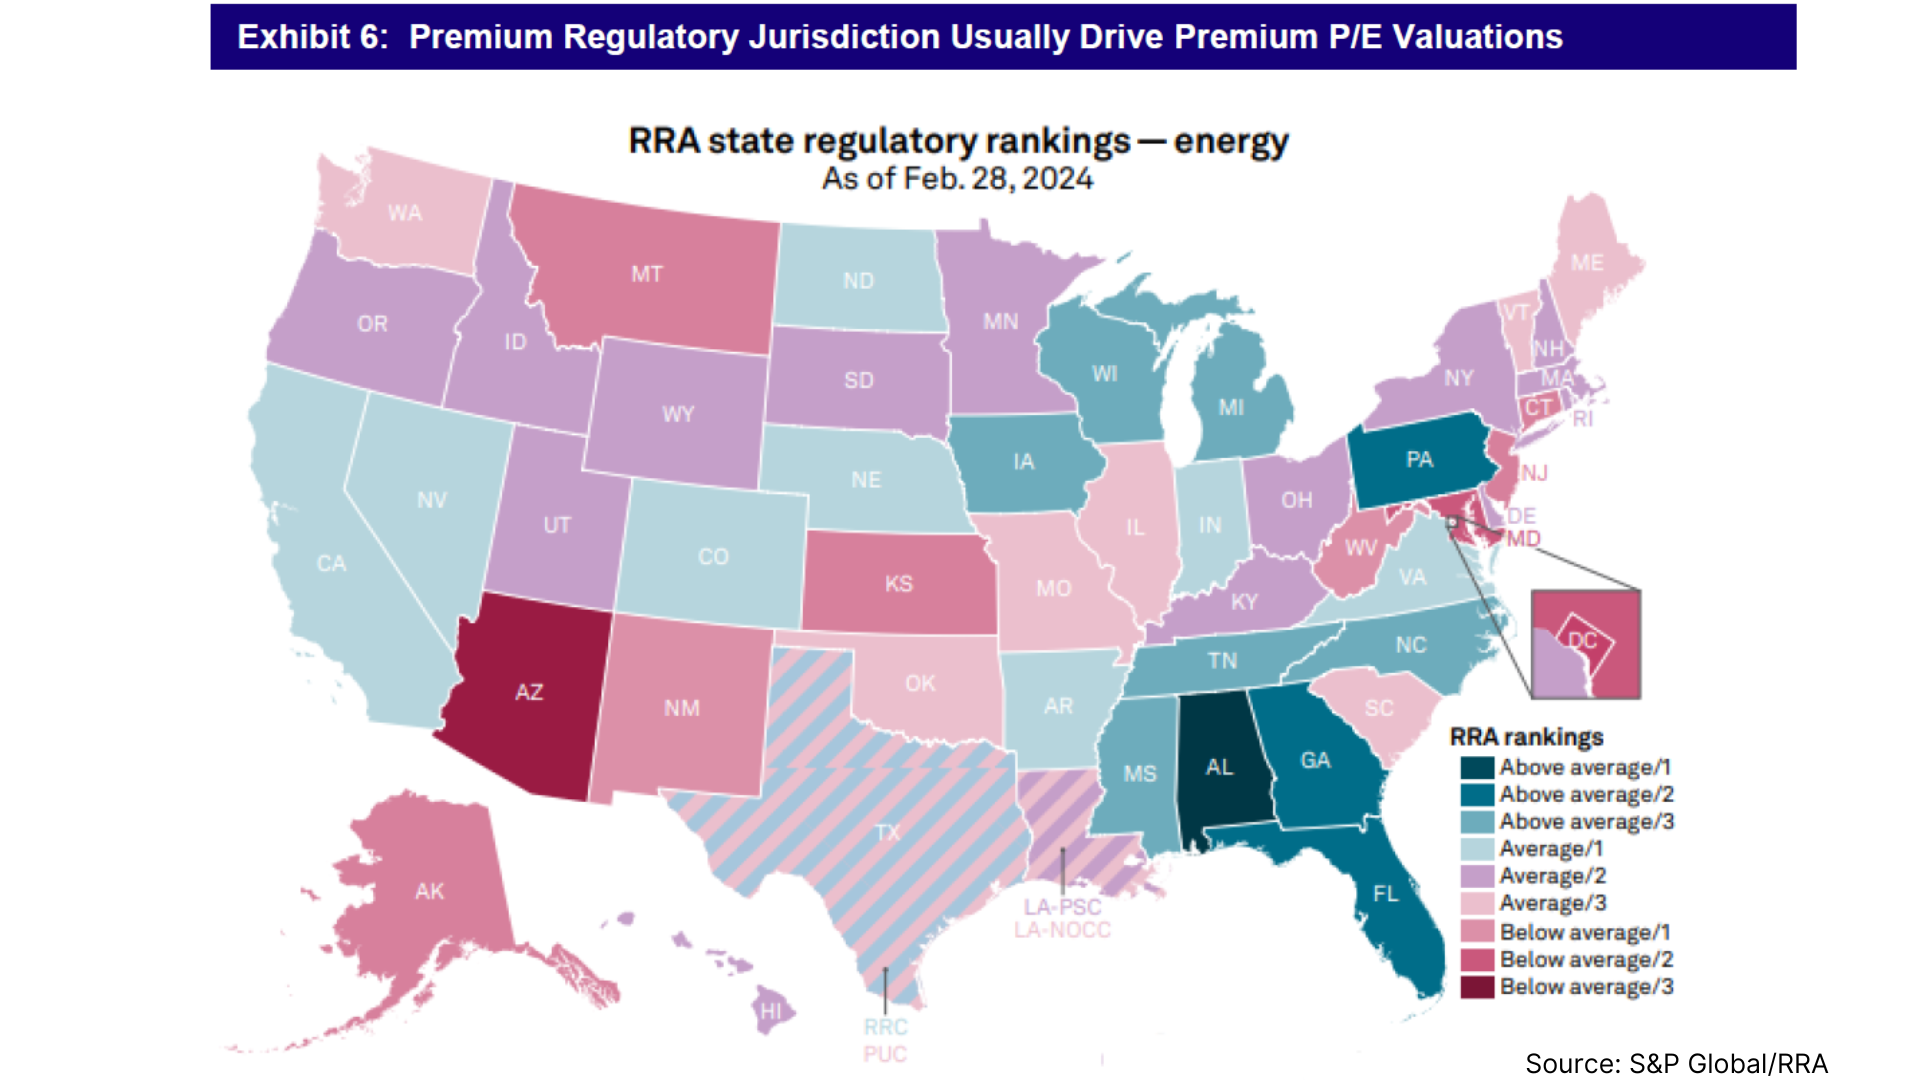
Electric utilities are natural monopolies providing an essential service, but require significant ongoing capex to maintain stability and reliability of the market. Regulators overseeing Utilities are called Public Utility Commissions (PUCs) and determine appropriate returns a utility is allowed to earn. While PUCs operate independently, they can and do look to neighboring states for precedent with certain areas of the US being more or less investor friendly as the map below illustrates.
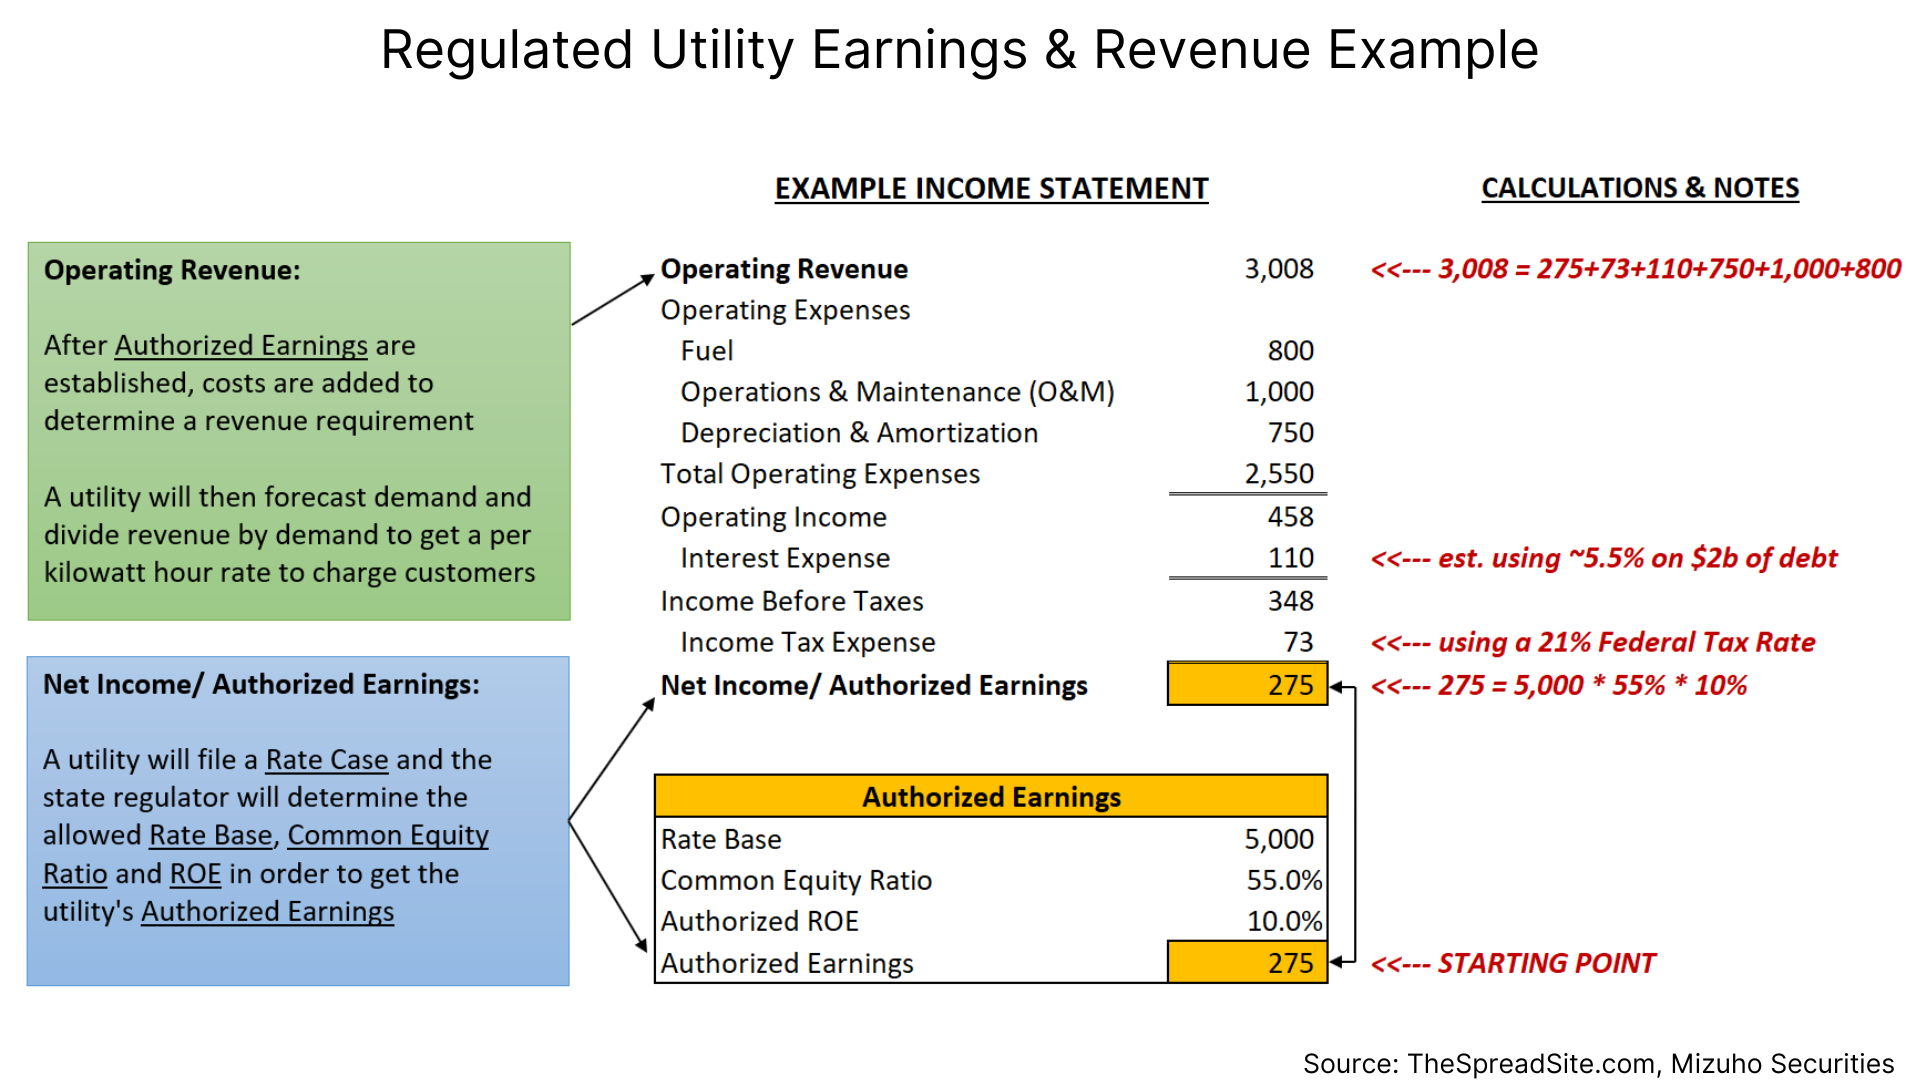
A Utility’s allowed ROE is determined through a procedure known as a “rate case” where they present in front of their local PUC and make the case for needed capex and an appropriate ROE. A Utility will always push for a higher ROE, but the PUC will consider many factors including the overall electricity cost burden on consumers. Utility analysts spend a lot of time analyzing and forecasting rate cases and the minutiae is outside the scope of this report. But at a high level, the formula used is as follows:
Authorized Earnings = Rate Base * Common Equity Ratio * Authorized Return on Common Equity
Whereby:
Rate Base = the value of property on which a Utility is allowed to earn an ROE
Common Equity Ratio = common equity/ total capitalization
total capitalization = (common equity + preferred + LT Debt) and 40% to 60% is typically the allowed range
ROE = usually determined using a CAPM model or DCF, which means the general level of interest rates plays a role
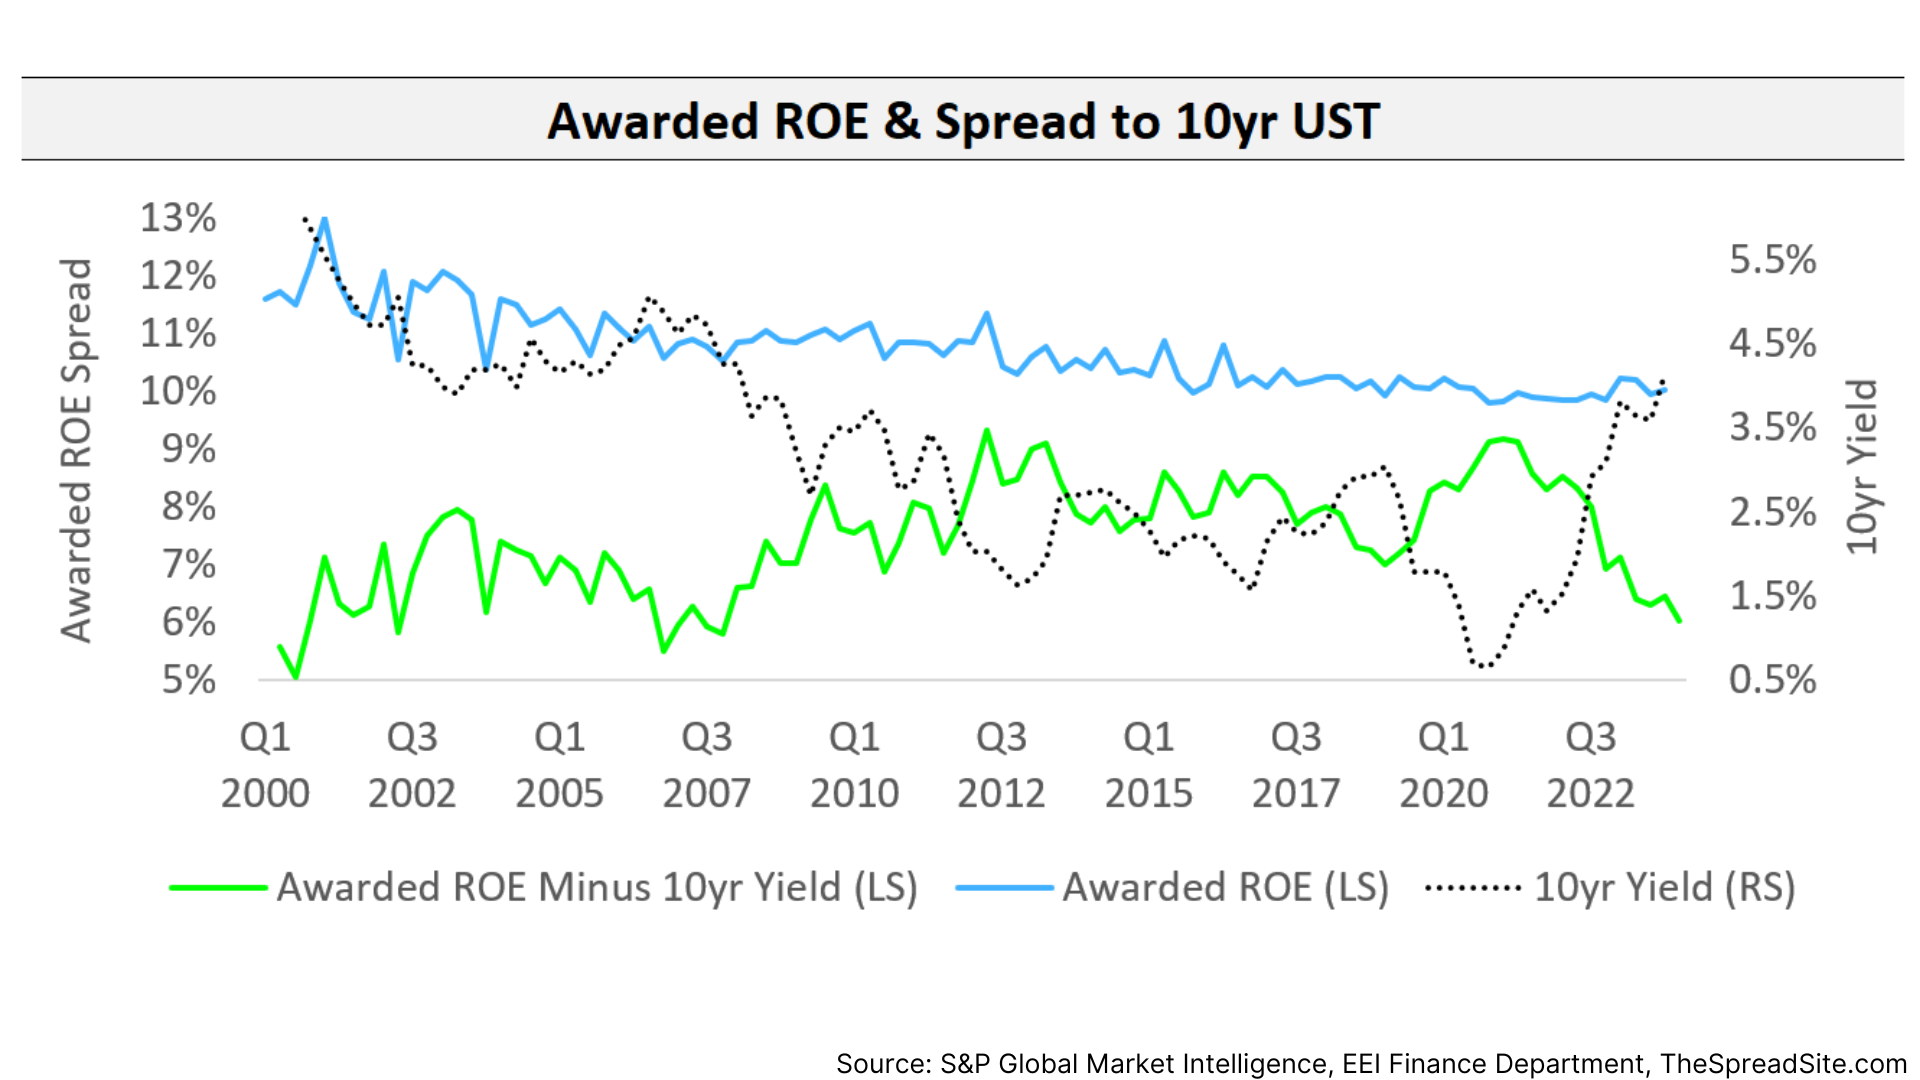
The chart below provides context where a history of “requested” and “allowed” ROEs are shown in addition to a spread over the 10yr UST. Based strictly on a CAPM or DCF valuation, higher 10yr yields should result in higher ROEs, but regulators are conscious of inflationary pressures on consumers and a likely reason the ROE Spread (green line) can compress during higher rate environments.
Further, while ROE is what a Utility will earn, labor costs, operating expenses and interest are all passed through to end users. For more detail on the mechanics behind a rate case and how Utilities pass through costs and build up to revenue and the resulting rate charged to end users, please see the Appendix.
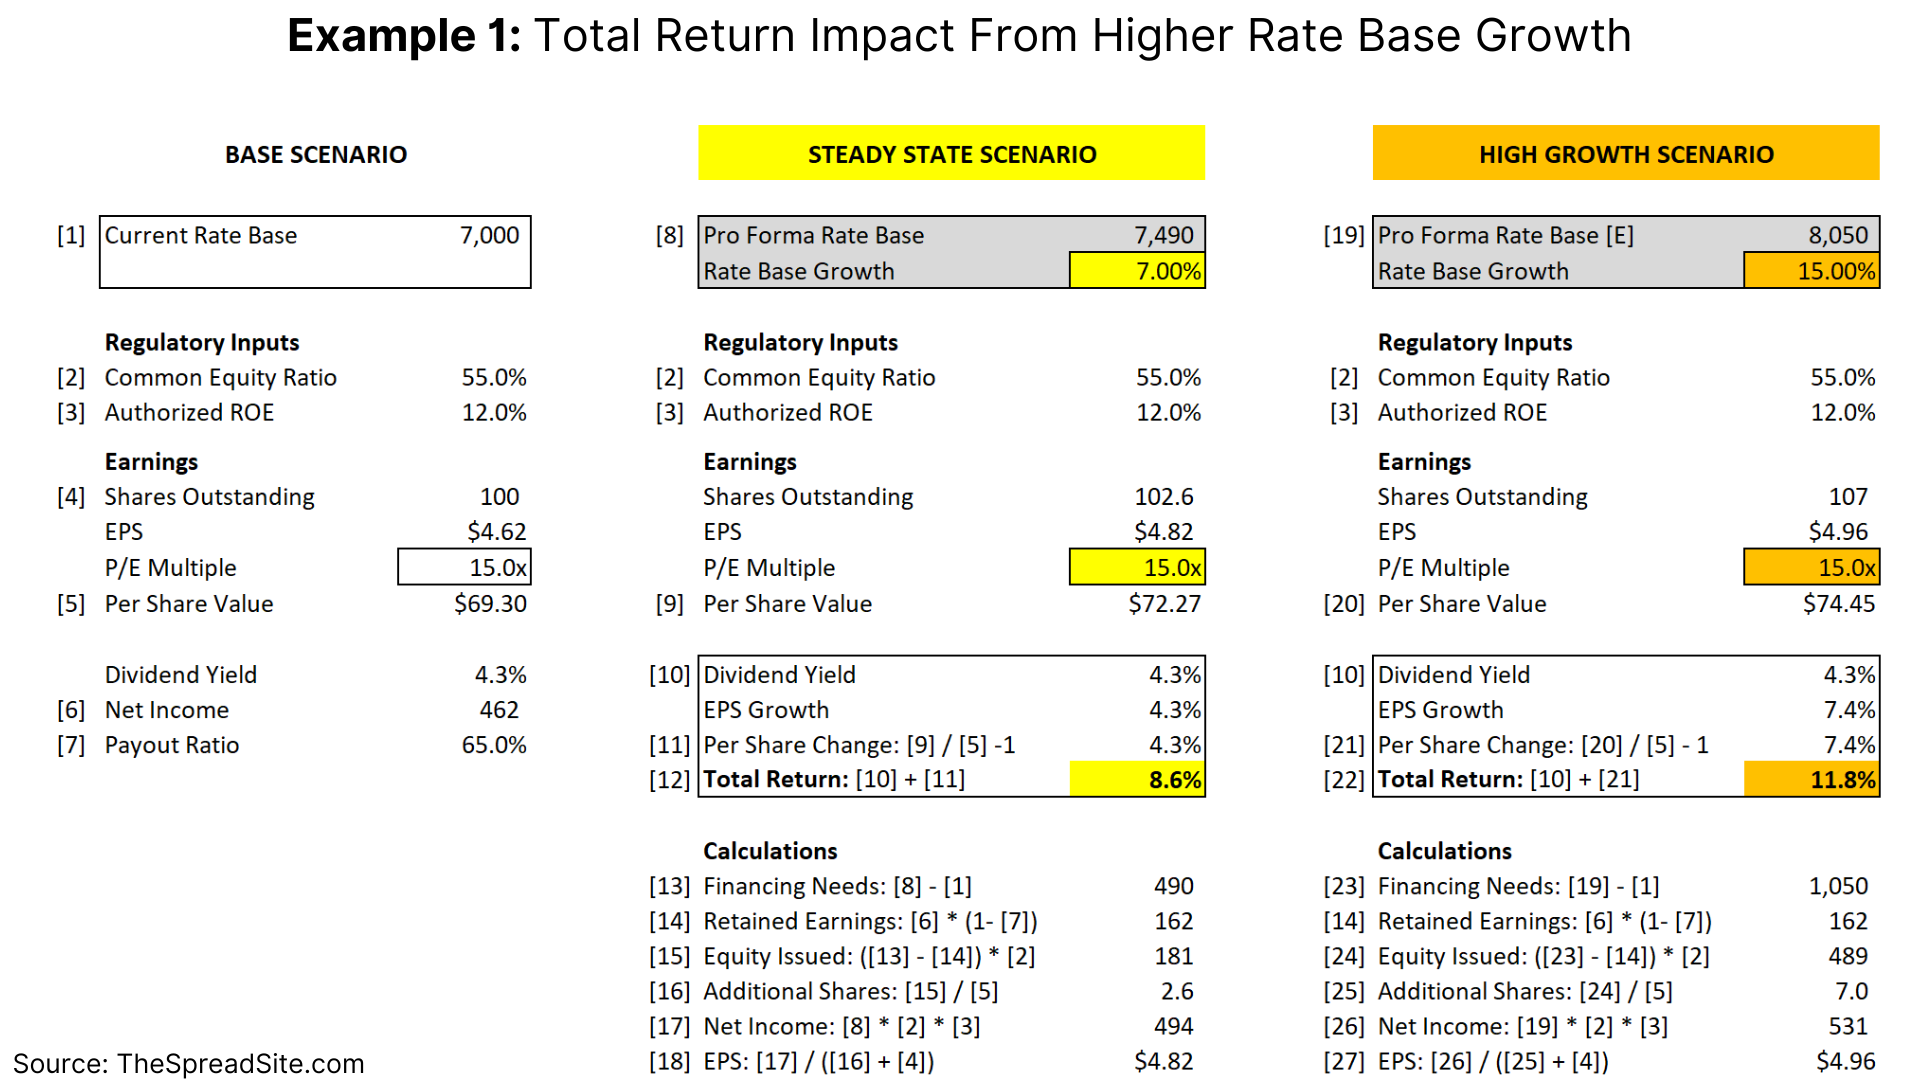
To understand how rate cases can impact Utility earnings and growth we provide two generic examples. In Example 1, we show how a significantly higher “rate base” (an area we revisit when discussing AI/ Data Center demand growth) can increase total return primarily through higher earnings growth.
However, this assumes regulators do not lower ROEs or common equity ratios in the face of (potentially) higher utility bills for consumers. Example 2 shows the impact of minor reductions in both metrics.
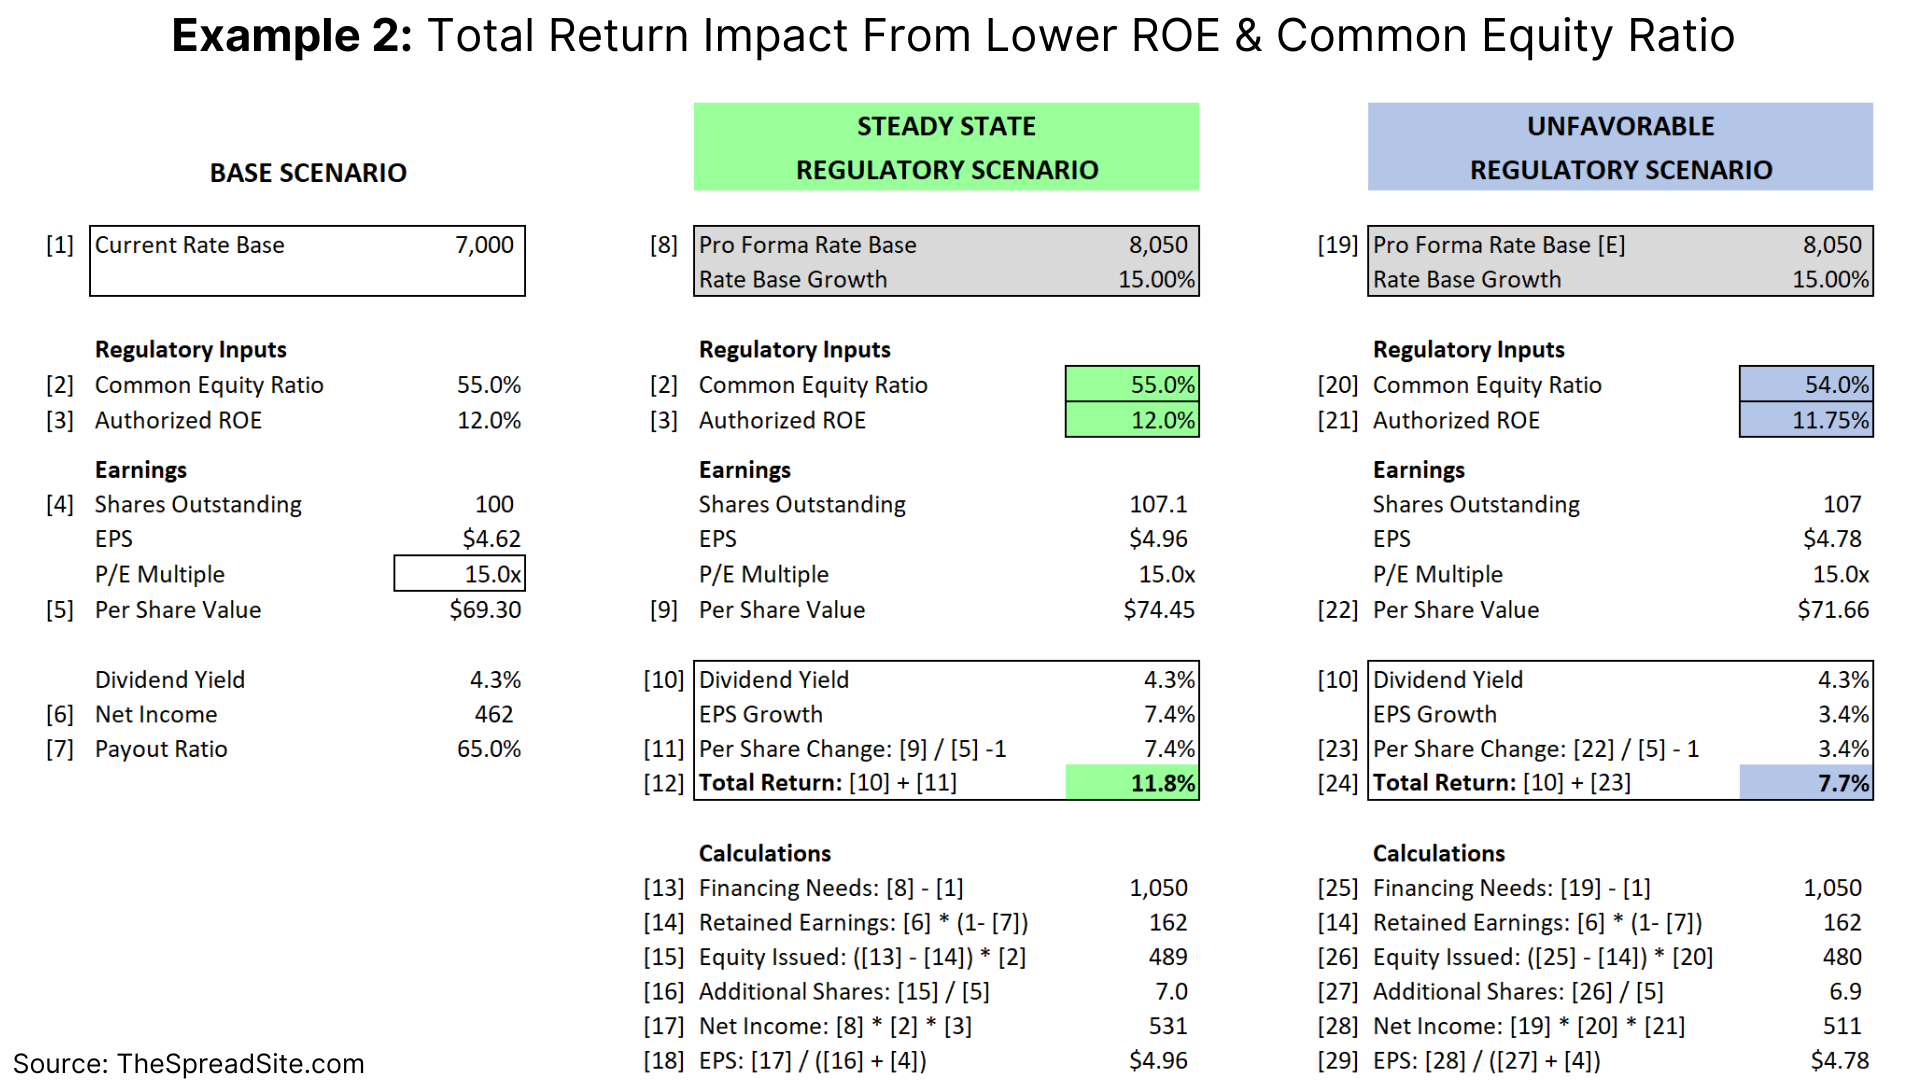
We are not forecasting that higher rate base growth will automatically lower ROEs and common equity ratios, especially since much of the expected growth in rate base will come from industrial & commercial users, but it is important to see the sensitivities.
As the tables above show, total return is a combination of dividend yield plus EPS growth (in reality, total return would also include price change). Historically, Utilities pay out 60-70% of earnings as dividends and have grown EPS about 4-6% per year. Using XLU’s current dividend yield of ~3%, this gets to a total return of 7-10% (the annualized total return for XLU assuming reinvested dividends is 7.6% since 2006).
Aside from increasing rate base, Utilities can (and do) try and increase EPS by placing debt at a holding company with proceeds used to fund equity capital at the operating company. They can also increase operating efficiency and retain the cost savings, but this can be passed back to consumers in future rate cases.
Recently, excitement over electricity demand growth from AI and the need for more data centers has caused XLU to rally 14% YTD with over half of the gains coming from IPPs. The rally in IPPs is driven by the expectation for higher power prices whereas the gains in Utilities is at least partly explained by higher expected capex and load growth.
Capex typically incorporates transmission and distribution (i.e. power lines and infrastructure to get electricity to the end user) as well as generation (i.e. power plants). Growth in the latter tends to be more muted but this is starting to change as industry analysts expect a boom in data center demand.
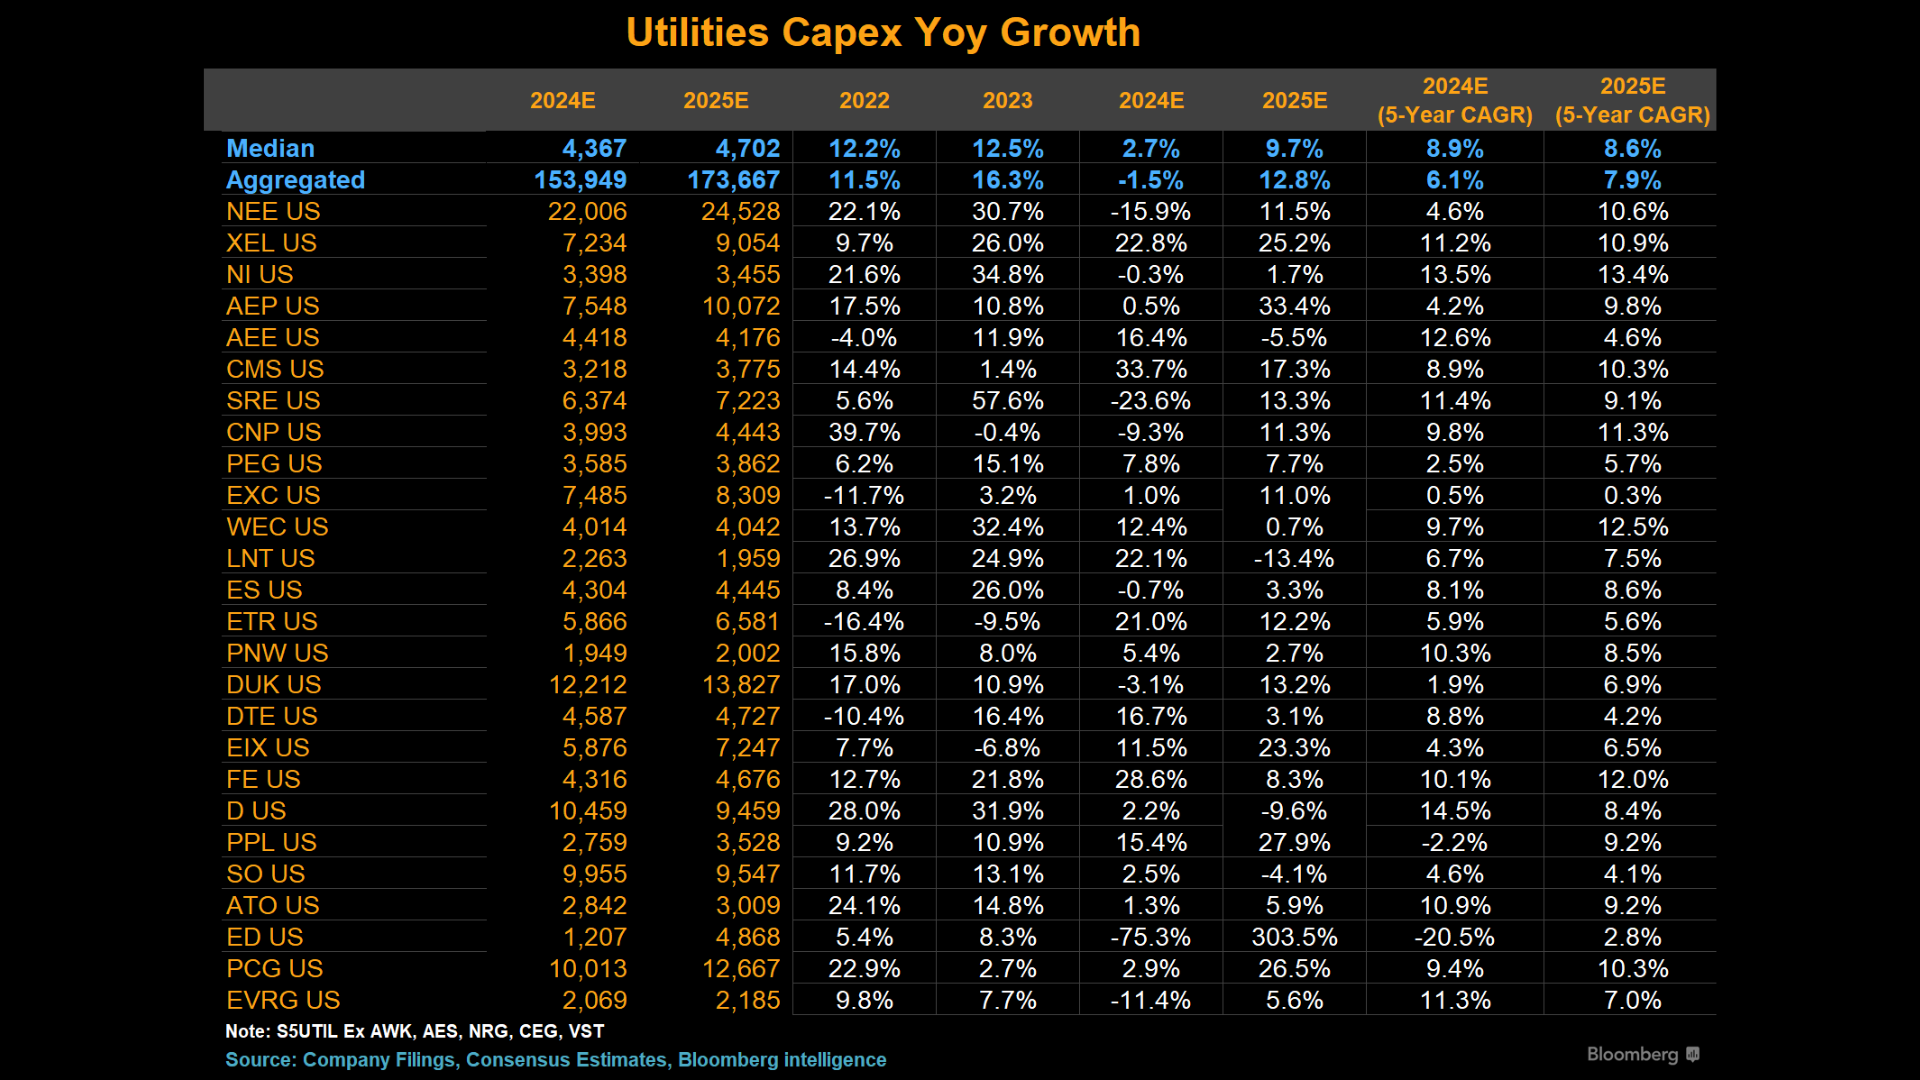
According to Bloomberg data, the 5yr CAGR in capex spend for Utilities is ~6.1% through 2024 and increases to 7.9% through 2025 given a 12.8% increase expected in 2025. While capex spend is not expected to continue rising 12.8% per year and y/y changes are volatile, a significant increase in AI driven demand will drive the CAGR in capex spend higher.
Capex spend and EPS growth are highly correlated as Utilities earn a regulated ROE on capital invested because it goes into rate base. And this can be seen in the ~6.1% 5yr CAGR on capex with EPS growth being roughly similar.
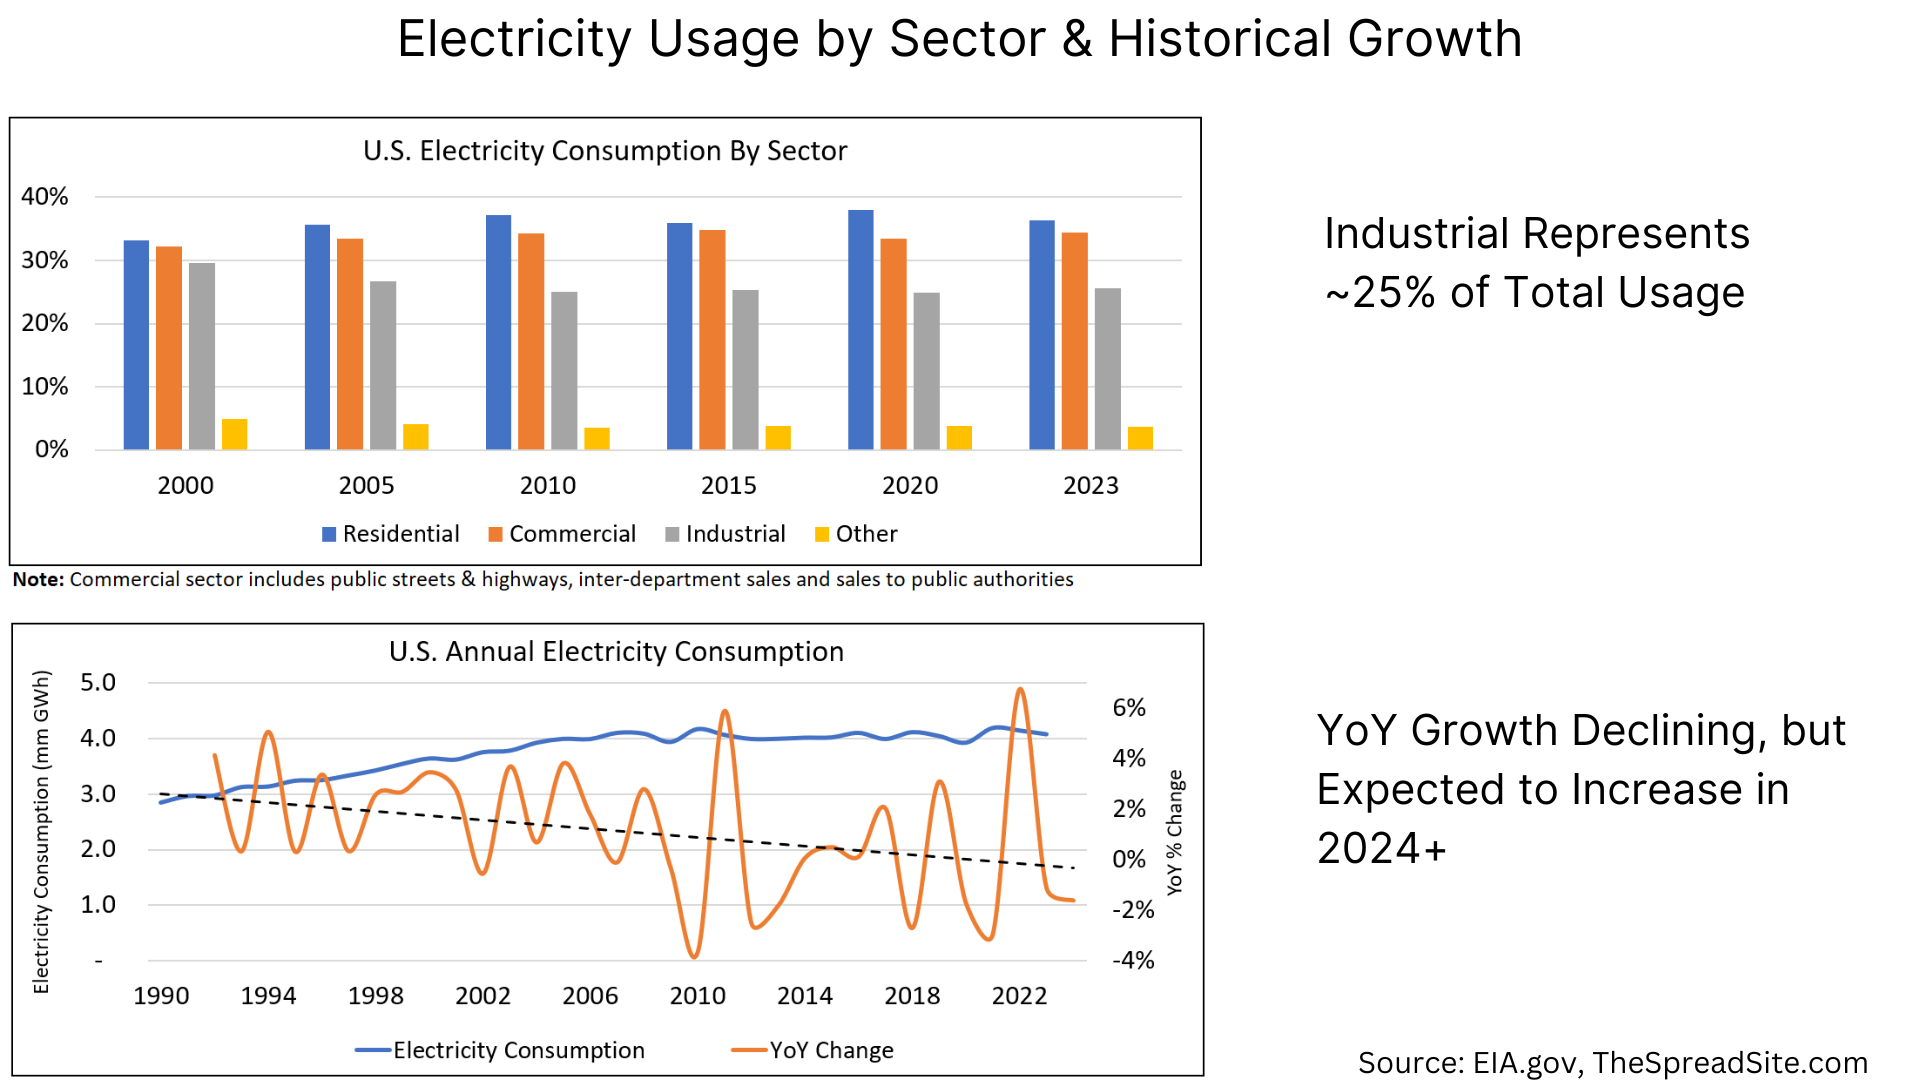
Increased capex is ultimately driven by electricity usage. Up through 2023, demand has trended towards zero, but more recently industry groups such as NERC and Investment Banks such as Goldman Sachs have put out reports forecasting growth in the coming decade with NERC in the 1-2% range and Goldman predicting a 2.4% CAGR through 2030. The NERC report can be found here while the Goldman report can be found here.
A few other wildcards worth mentioning include the upcoming presidential election in addition to extreme weather risks. President Biden’s passing of the Inflation Reduction Act (IRA) provided significant tax credits to energy produced without emitting greenhouse gases. Going into detail here is beyond the scope of this report, but generally a Republican White House is considered a downside risk for Utilities given a higher likelihood of a partial IRA repeal. With respect to weather risk (especially wildfires), Utilities can face significant liability if they are found negligent (as was the case in 2019 with PCG’s bankruptcy), but more recently Utah’s governor signed legislation attempting to cap fire risk to state utilities. Whether other states follow suit and/or there is a Republican White House remain risk factors to consider.
Valuation Overview in Chart Form
The two main categories of valuation for Utilities are relative P/E and a dividend yield relative to a bond benchmark. As Utilities do not have a maturity date like bonds, total return must incorporate price changes over a holding period. While we cannot predict ending valuations, looking at the starting point relative to history is helpful.
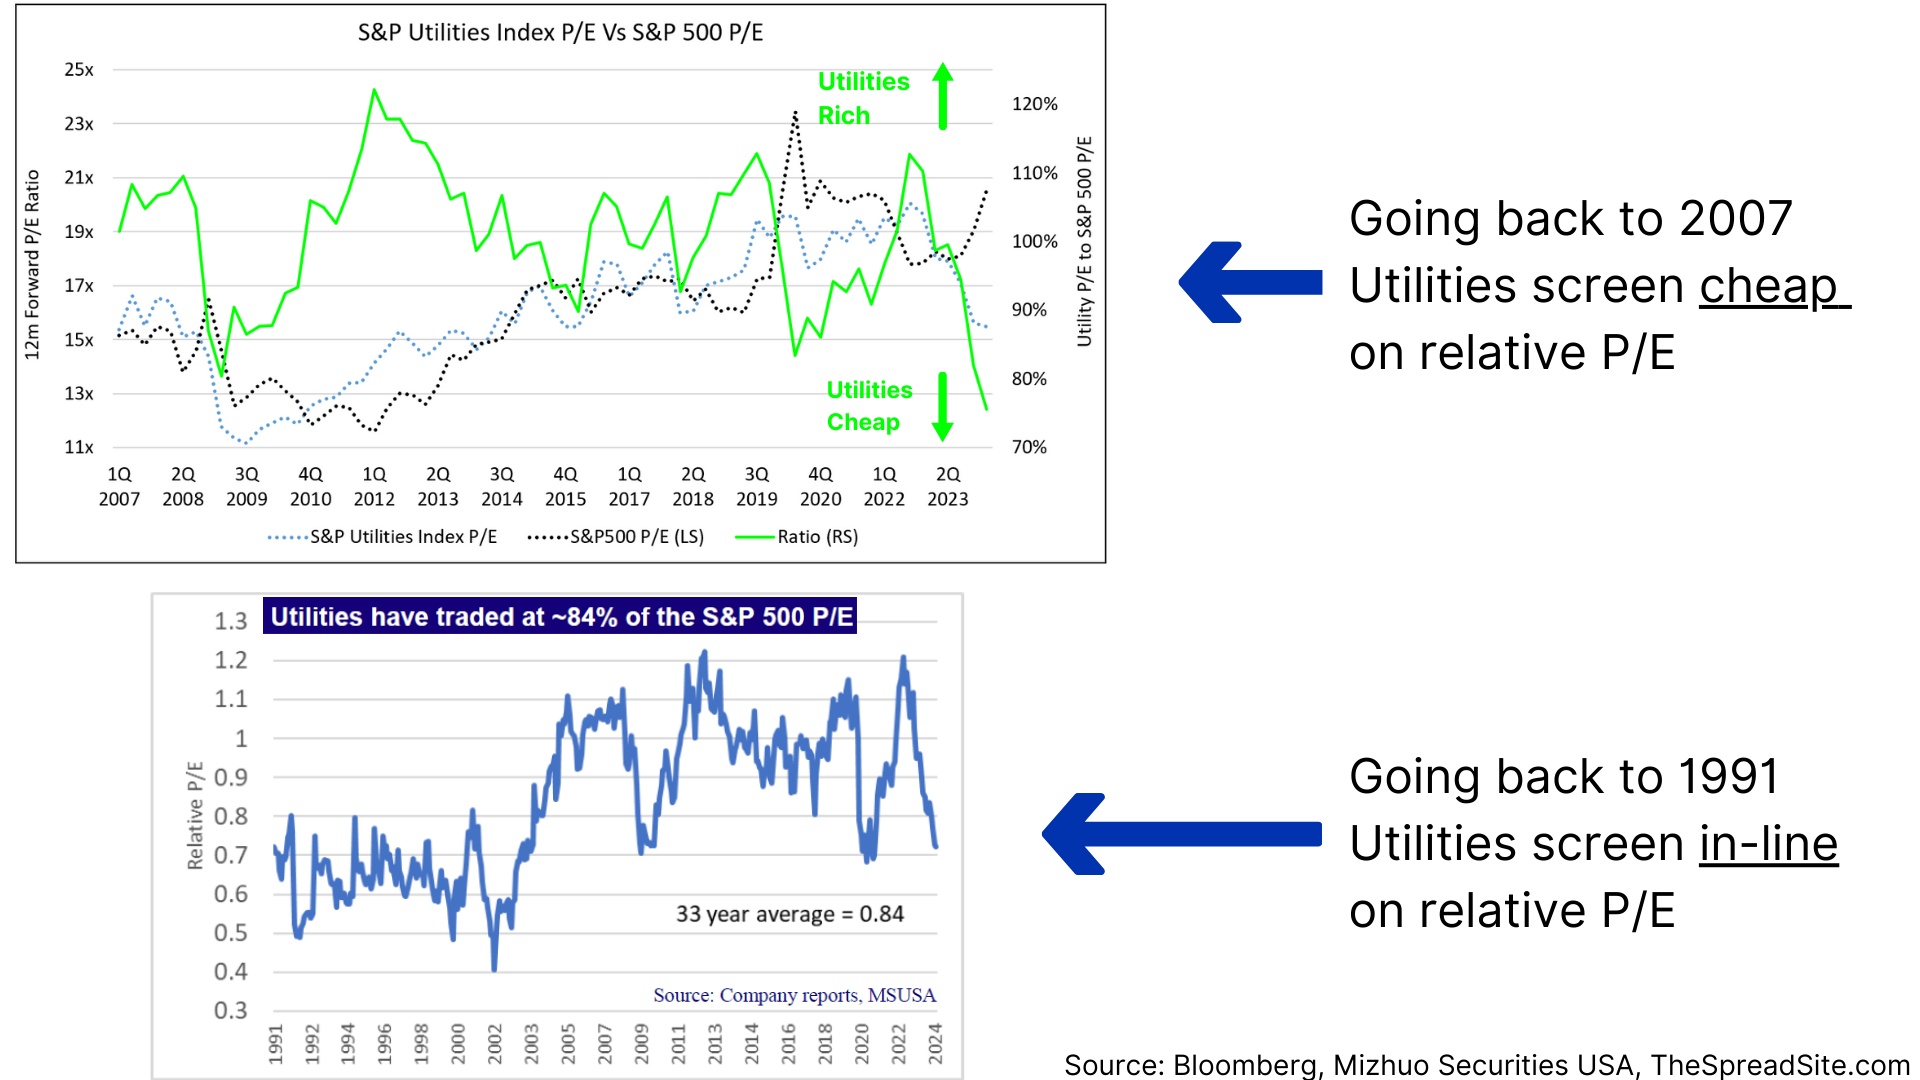
Utilities screen cheap using P/E data going back to 2007, but in-line going back to the early 1990s with a few additional comments on relative P/E valuation below:
- Through Bloomberg, forward estimates only go back to 2007, which incorporates a long period of very low interest rates. Using Mizuho data back to 1991, Utilities have traded at 84% of the S&P 500 P/E.
- Since these are forward looking P/E ratios and there is an expectation for higher demand and capex growth from AI/ data centers, some amount of growth is already priced in.
- About 16% of the S&P Utilities Index contains IPPs where EPS growth is in the double digits (CEG and VST have a blended ’24 to ’25 EPS growth of 28% and 40%, respectively).
As for dividend yield relative to bond benchmarks, Utilities screen slightly expensive which is partly explained by the trailing nature of this data (i.e. forward growth is not accounted for), in our view. We illustrate relative yields using the 10yr UST and Moody’s Baa Index below (tax impacts on dividends vs bond interest are not included).
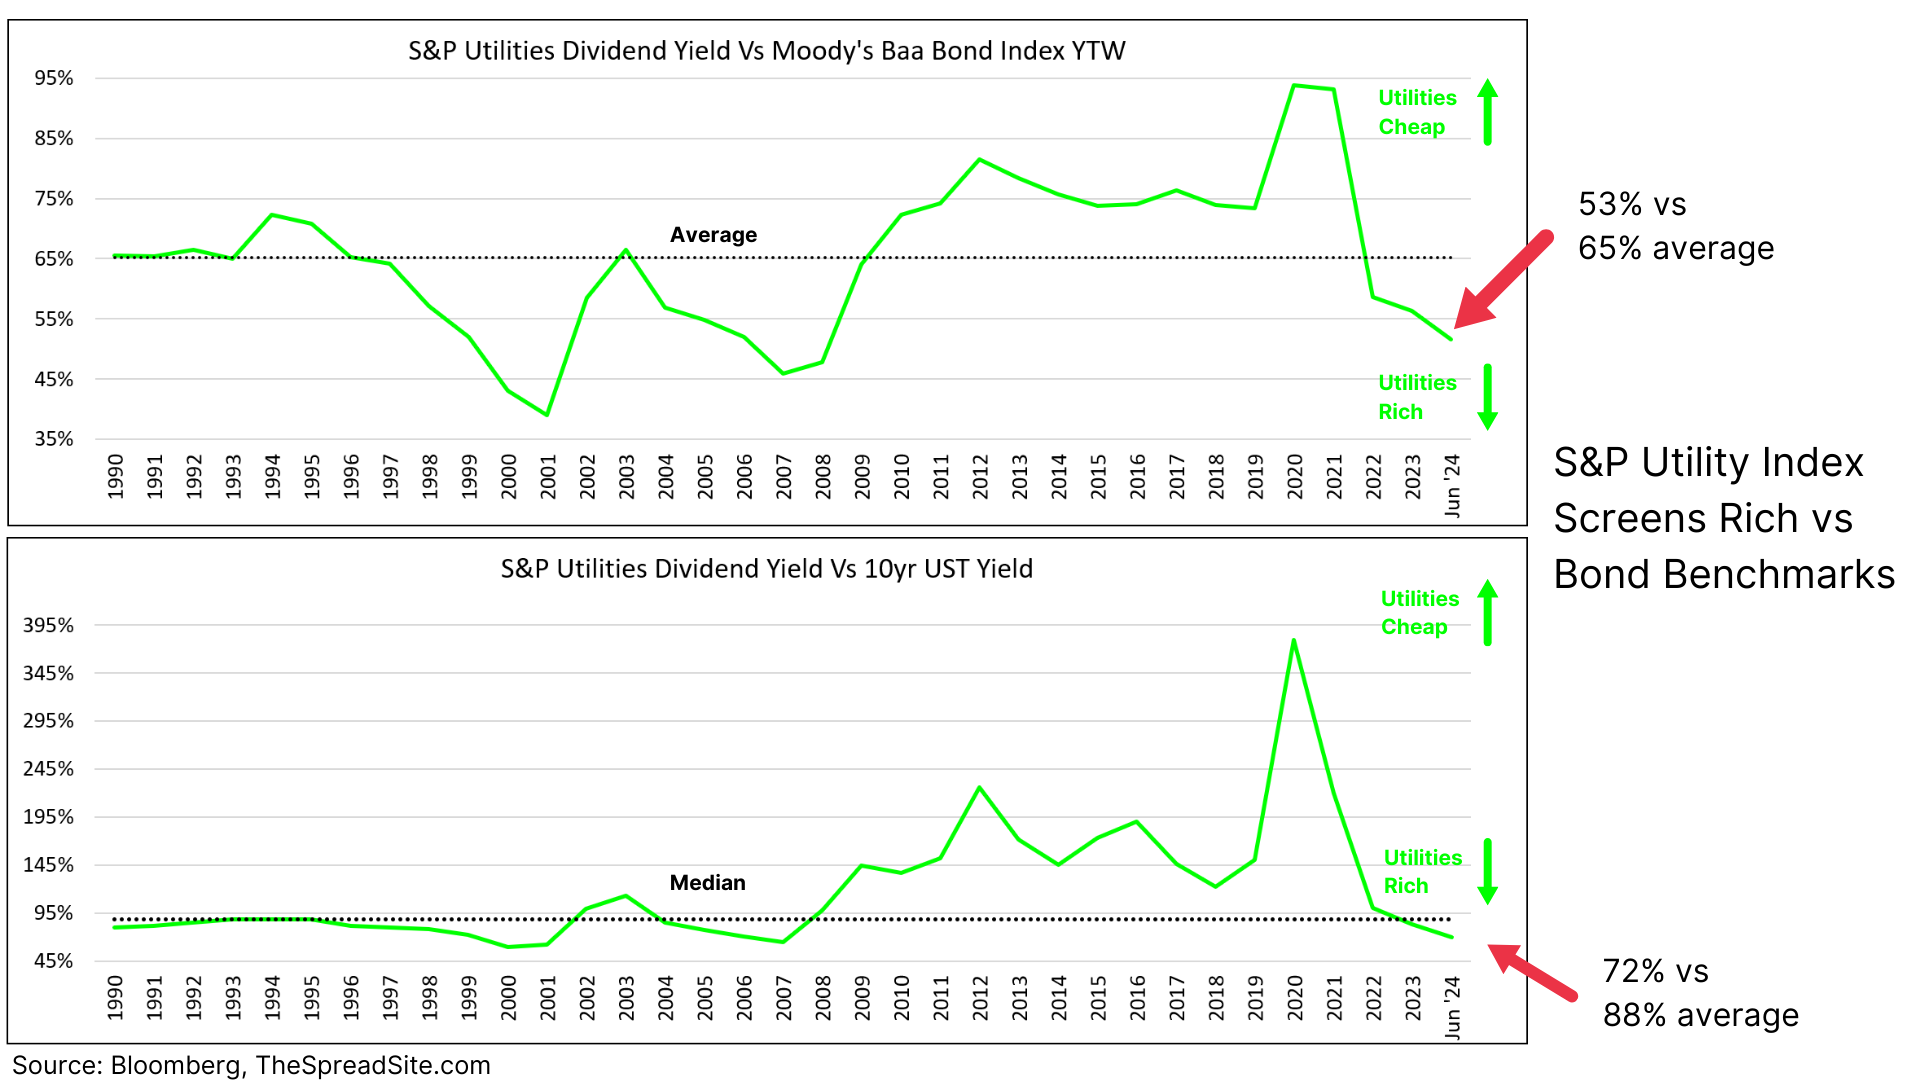
Given the increase in interest rates in the past few years we are not surprised that Utilities are slightly expensive on a yield basis. However, there is substantially more risk paying up for Utilities in a low-rate environment than a more normal environment, plus the sector carries some inflation protection with optionality on growth as discussed.
Electric Utility Total Return
Barring extreme scenarios where interest rates move significantly higher, economic growth moves significantly lower or there is a broad repeal of the IRA, we show scenarios for total returns below assuming a 3yr hold period.
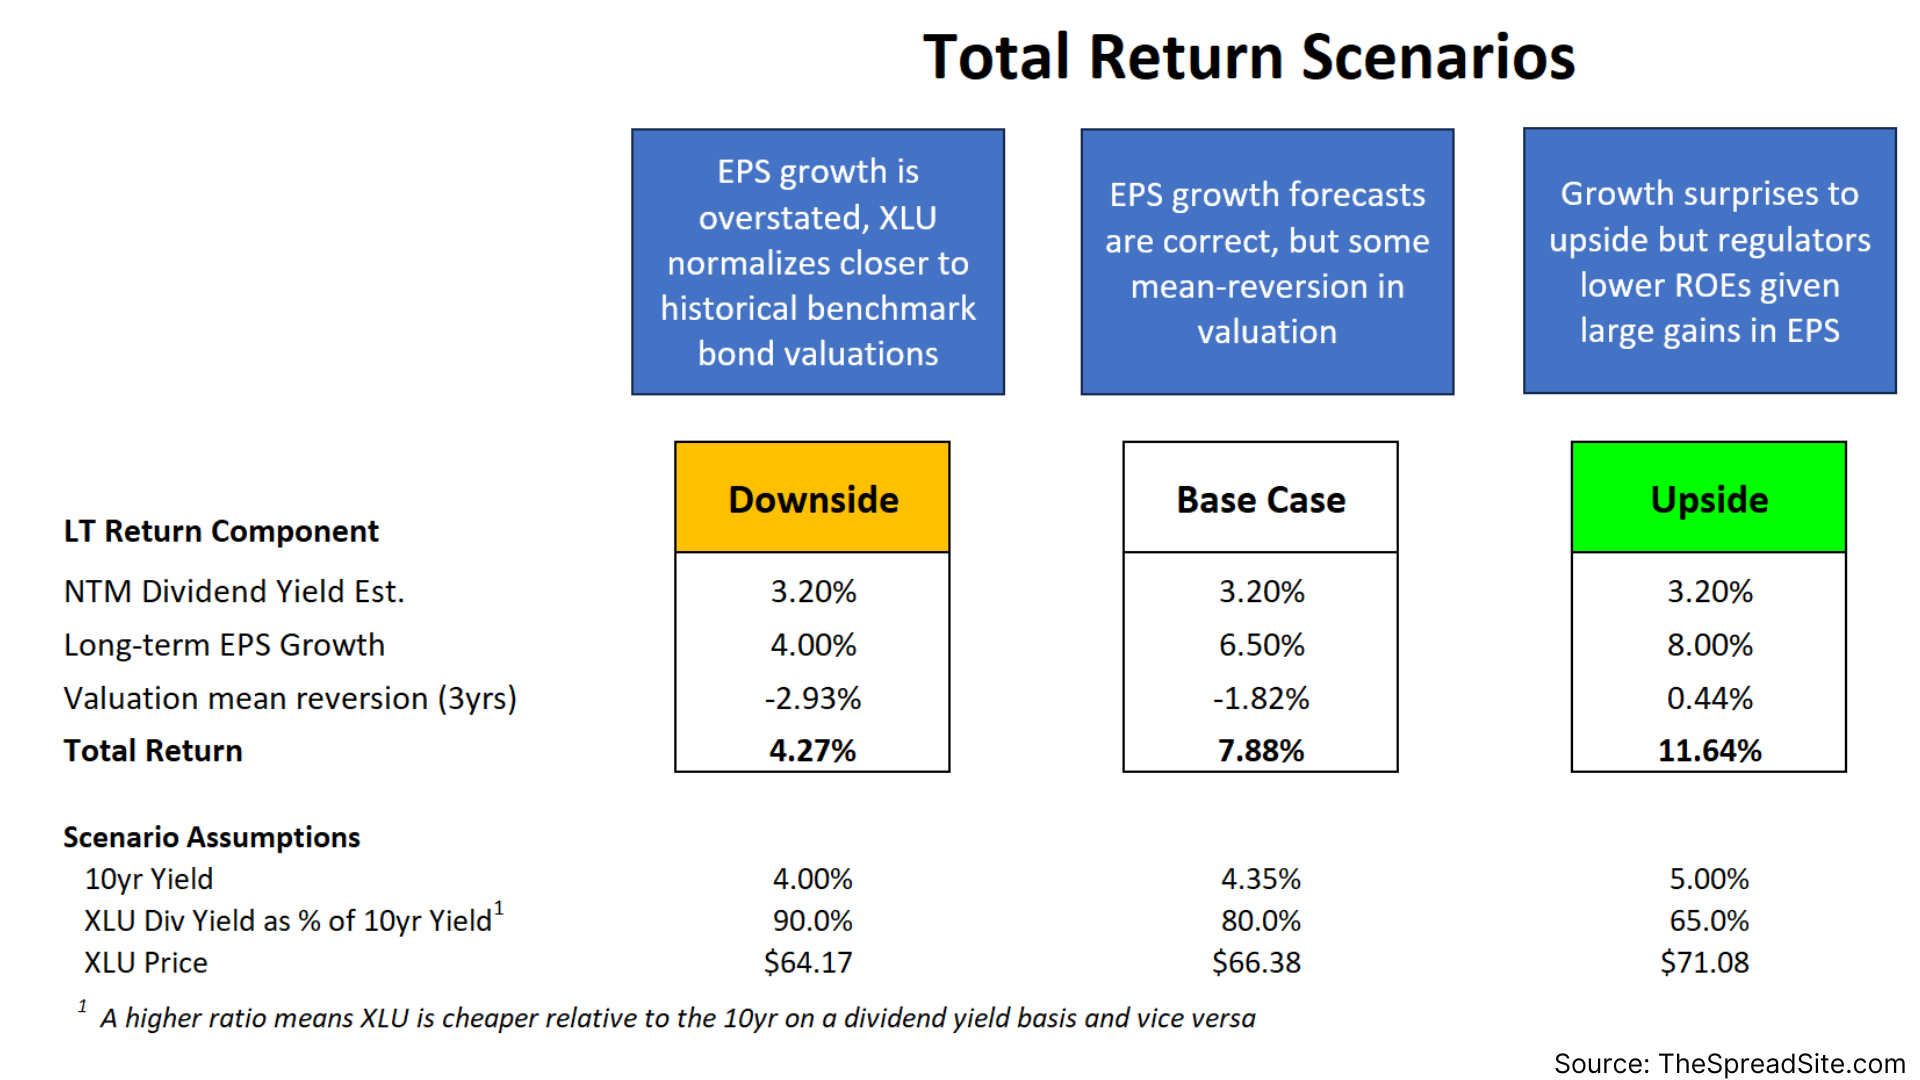
The rationale behind our scenarios is as follows:
- Downside: If demand growth disappoints (partly driven by slower economic growth), XLU’s dividend yield likely moves closer to the long-term average relative to 10yr yields (~88%), but in this scenario we also assume a lower 10yr yield given lower overall economic growth.
- Base Case: As our analysis focuses on regulated utilities, we want to account for a reversal of some of the IPP driven momentum and assume a dividend yield ratio (vs 10yr UST) with some mean reversion closer to a historical average, but we also assume higher EPS growth.
- Upside: If EPS growth is sustainably higher than recent levels, we think P/E will matter more and the XLU dividend yield ratios will continue to move lower vs 10yr UST yields.
Conclusion
The Base Case and Upside scenarios appear more likely given tailwinds from AI/data center driven demand leading to a higher long-term CAGR in rate base and consequently, EPS growth.
Utilities, as represented by XLU, offer total expected returns in the high single digits and we think offer a reasonable defensive play. Given the recent momentum in IPPs, a short-term pullback is likely, but over a longer-term holding period, we find expected total returns attractive.
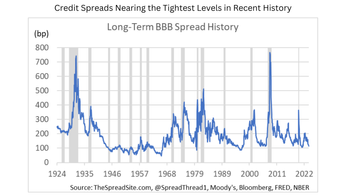
Defensive parts of the fixed income market such as IG credit remain tight on a spread basis while all-in yields remain high relative to recent history. Utilities, which are also defensive, are also slightly rich but with added inflation protection and potential upside from higher growth.
Appendix
Utilities build up to revenue by starting with the Net Income allowed by regulators. All costs are passed through to end users with a per Kw/h rate determined by a utility’s revenue divided by their expected demand. While costs are passed through to end users, Utilities can see a benefit or detriment based on the lag between when costs are realized and their next rate case.
Disclosures
Please click here to see our standard legal disclosures.
The Spread Site Research
Receive our latest publications directly to your inbox. Its Free!.


