
Agency Mortgage REITs: Leveraging An Attractive Asset
Summary
- Rising rates in addition to elevated interest rate volatility have led to a widening in agency MBS spreads and significant declines in book value within the agency mortgage REITs. We think that presents an attractive buying opportunity. We walk through the mREIT business models in detail.
- We like investments in “AGNC” and “NLY” given their exposure to agency MBS and their significantly larger size relative to “ARR” and “DX”. “AGNC” represents a slightly higher beta pure-play but also trades at higher price to book value as compared to “NLY”.
- Agency mortgage REITs carry modest interest rate risk (given rate hedges) but meaningful basis risk if MBS spreads widen. And given their significant leverage, they can get hit hard in a crisis or liquidity event where spreads blow out. Given this “tail risk,” we would size positions accordingly.
- Spread income and dividend payments remain high given elevated bond yields, but losses on hedged agency MBS have more than offset this cash inflow over the past few years. We illustrate each piece as a way of framing future expected returns.
- We would avoid the preferred securities as, in our view, they carry similar downside in a tail risk scenario without the associated potential for upside compared to the common stock.
Agency Mortgage REITs
The focus of this report is on agency mREITs, which we define as REITs with 90%+ of their portfolios in agency mortgages. The term “agency” refers to the Government Sponsored Entities of Fannie Mae and Freddie Mac as well as Ginnie Mae, which is wholly owned by the federal government (i.e. Fannie & Freddie are implicitly backed whereas Ginnie is explicitly backed).
High-level comp data is below:
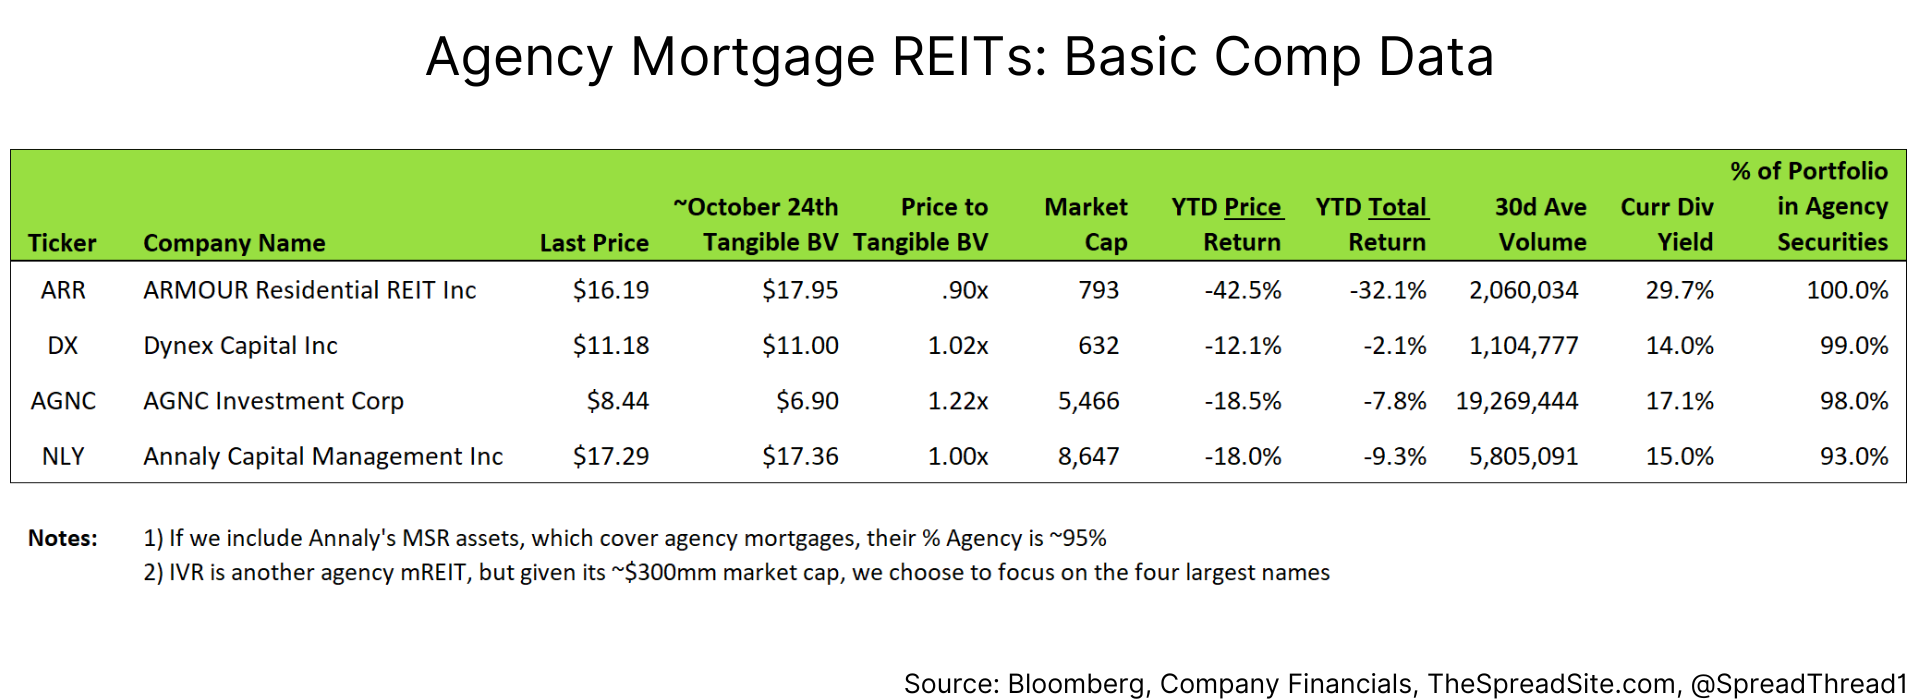
Mortgages issued by these entities carry guaranteed repayment of principal and interest, which means they do not carry risk of principal loss. Fannie and Freddie lack an explicit US Government guarantee, but the market views their implicit guarantee as reliable and their mortgages are priced accordingly.
There are numerous companies described generally as mortgage REITs but it is important to understand the types of mortgages held. We are specifically highlighting the companies with portfolios almost entirely consisting of agency mortgages.
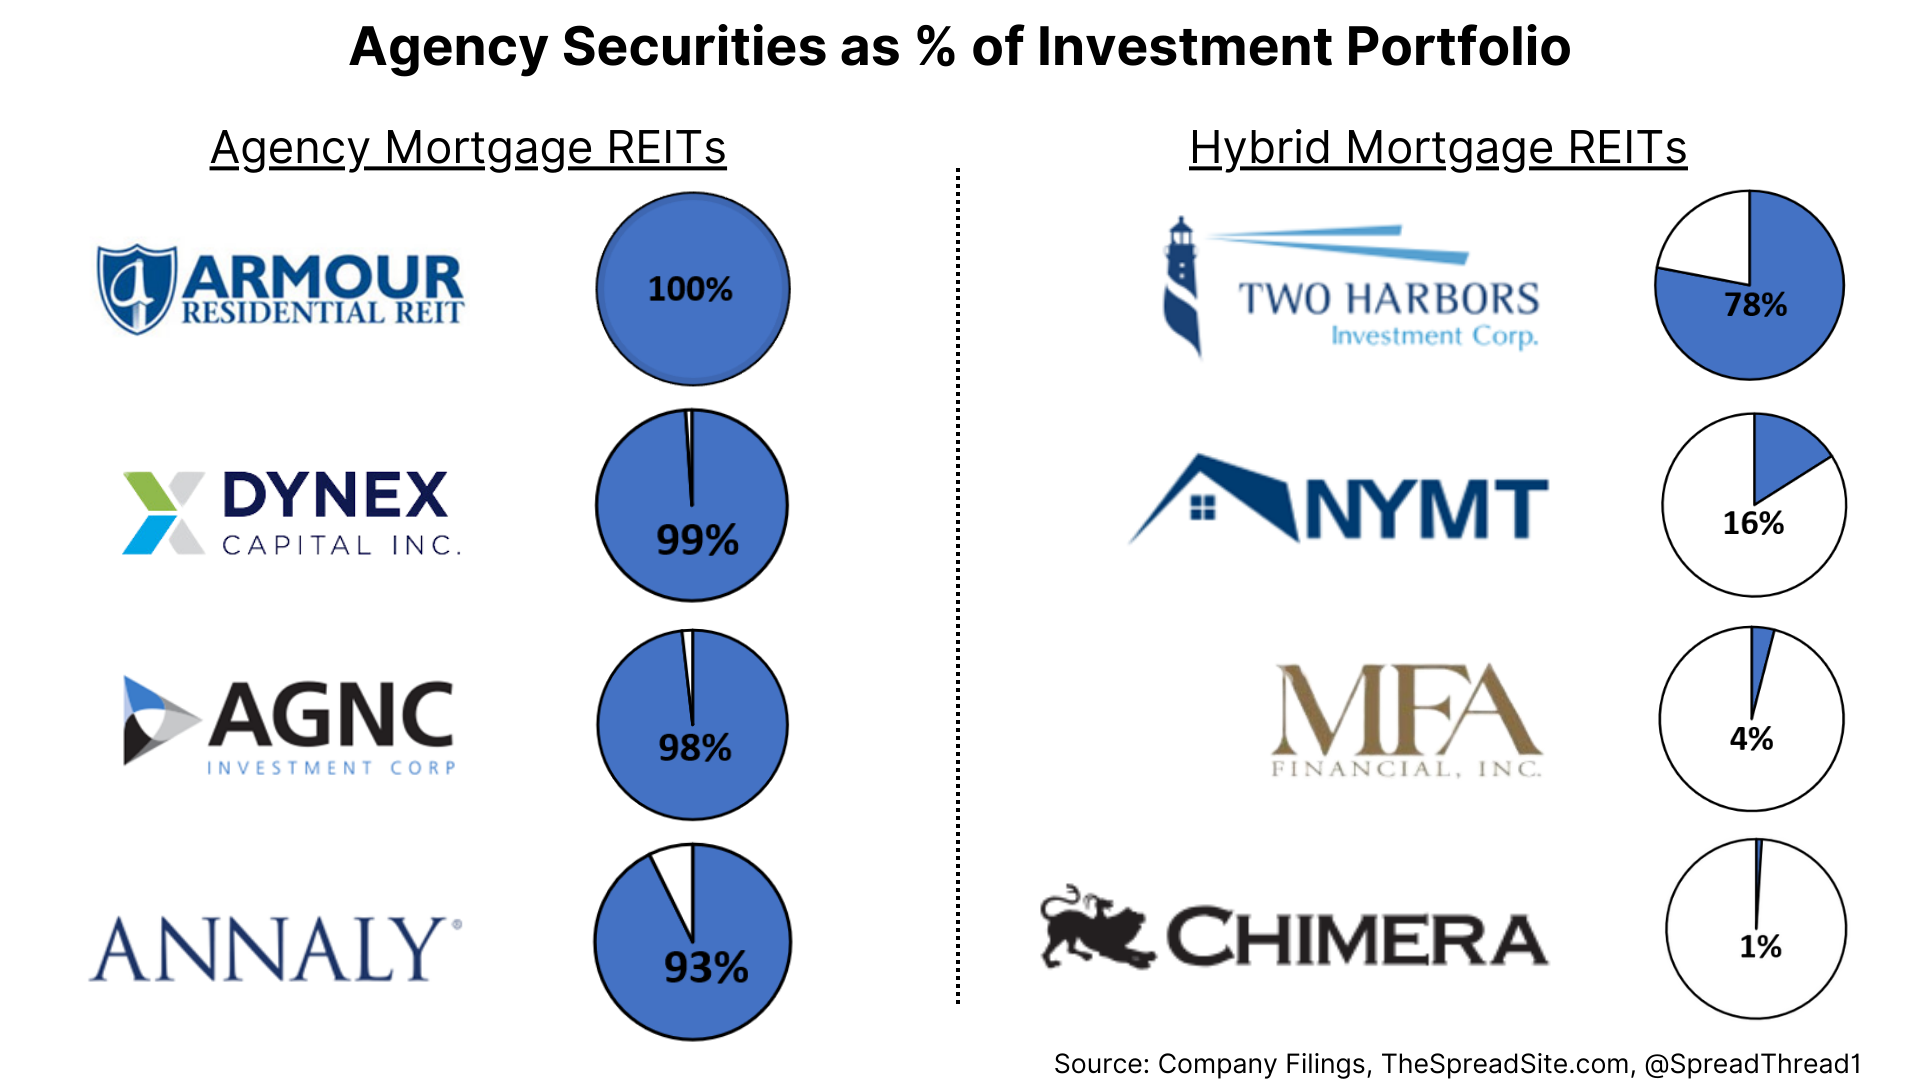
For example, we often see “hybrid” mREITs conflated with agency mREITs yet the former has significant exposure to credit risk, even though they both primarily hold residential mortgages.
Below we show the agency holdings of agency mREITs (left) and hybrid mREITs (right) to illustrate the contrast:
The reasons why we focus on agency mREITs are three-fold:
- High quality fixed income is cheap relative to the alternatives and agency mortgage-backed securities (“agency MBS”) fit within this category.
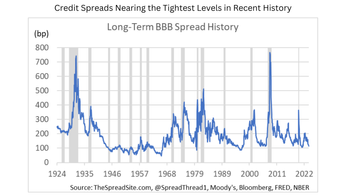
- Historically wide Option Adjusted Spreads (“OAS”) on agency MBS offer value relative to other spread products like corporate credit.
- Book values have been decimated since 4Q19 (50%+ for “AGNC” and “NLY”), setting up attractive future returns.
Below we provide an overview of the main drivers impacting the agency mortgage market. We are fundamental analysts with sector expertise in corporate credit and will not pretend to be mortgage specialists. For those interested in more detail on mortgages we recommend the Convexity Maven website.
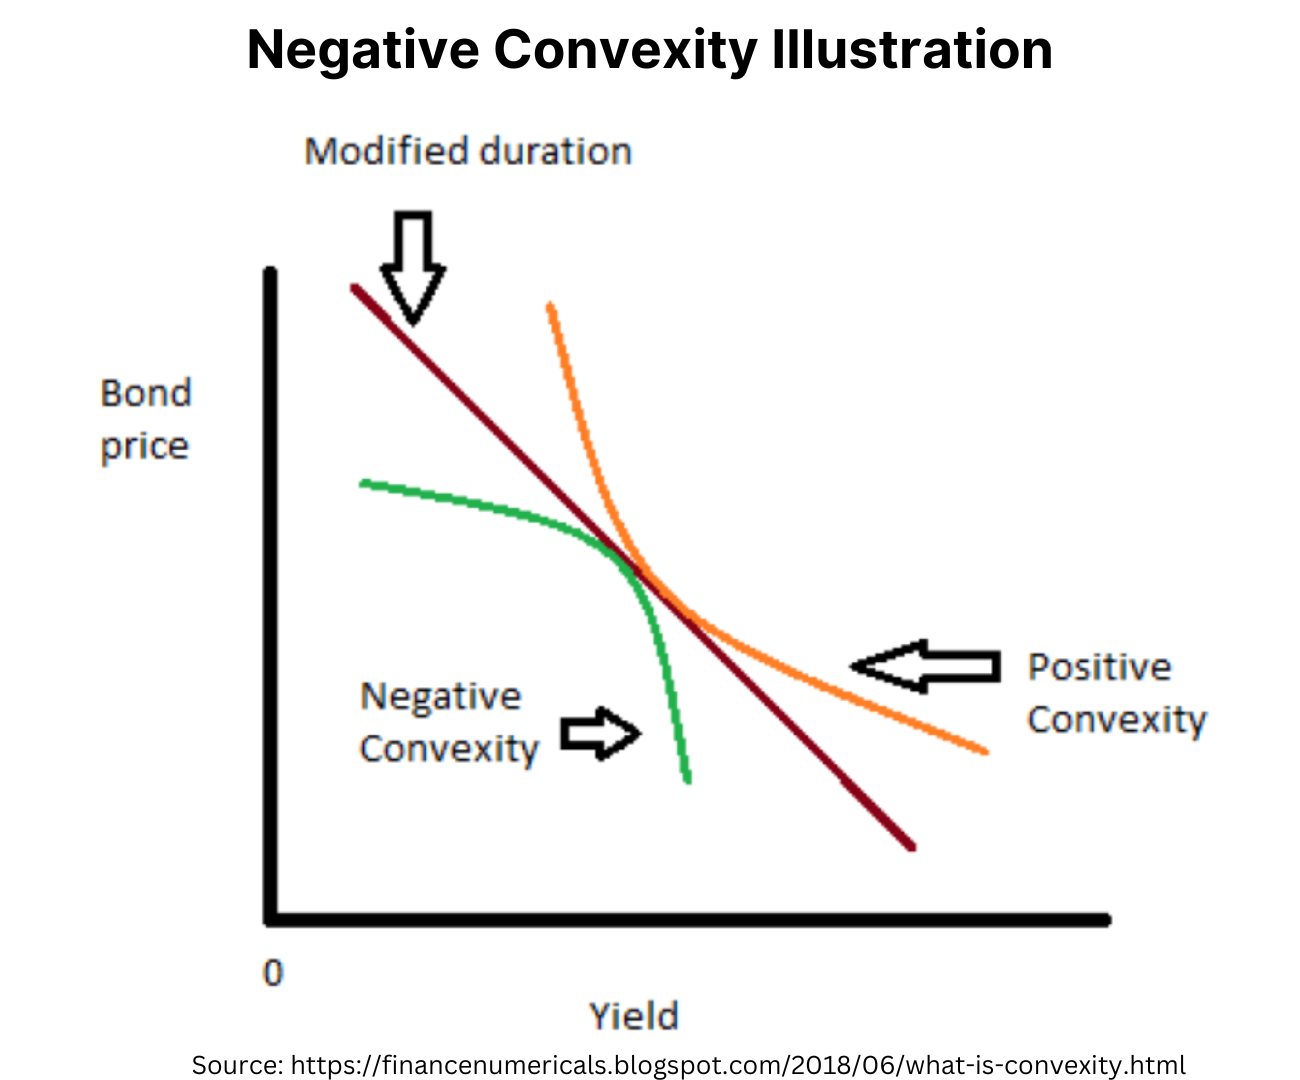
While agency MBS are considered “risk free,” they will trade with a spread to USTs because they carry prepayment risk and consequently, they are negatively convex. This means that as interest rates decline, the price increase of an agency MBS will usually go up less than a UST since homeowners can prepay their mortgage at any time. The MBS holder needs to be compensated for this risk. The image below shows how the price of a negatively convex bond (green line) flattens out as yields decline.
Note, while MBS bonds issued around current mortgage rates are very negatively convex, bonds issued prior to this rate rise are much less so, and even slightly positively convex in cases. For example, a homeowner with a 3% mortgage rate is very unlikely to prepay even with large moves lower in interest rates. The MBS index currently trades at very discounted price of $84 because of many of these low interest rate mortgages.
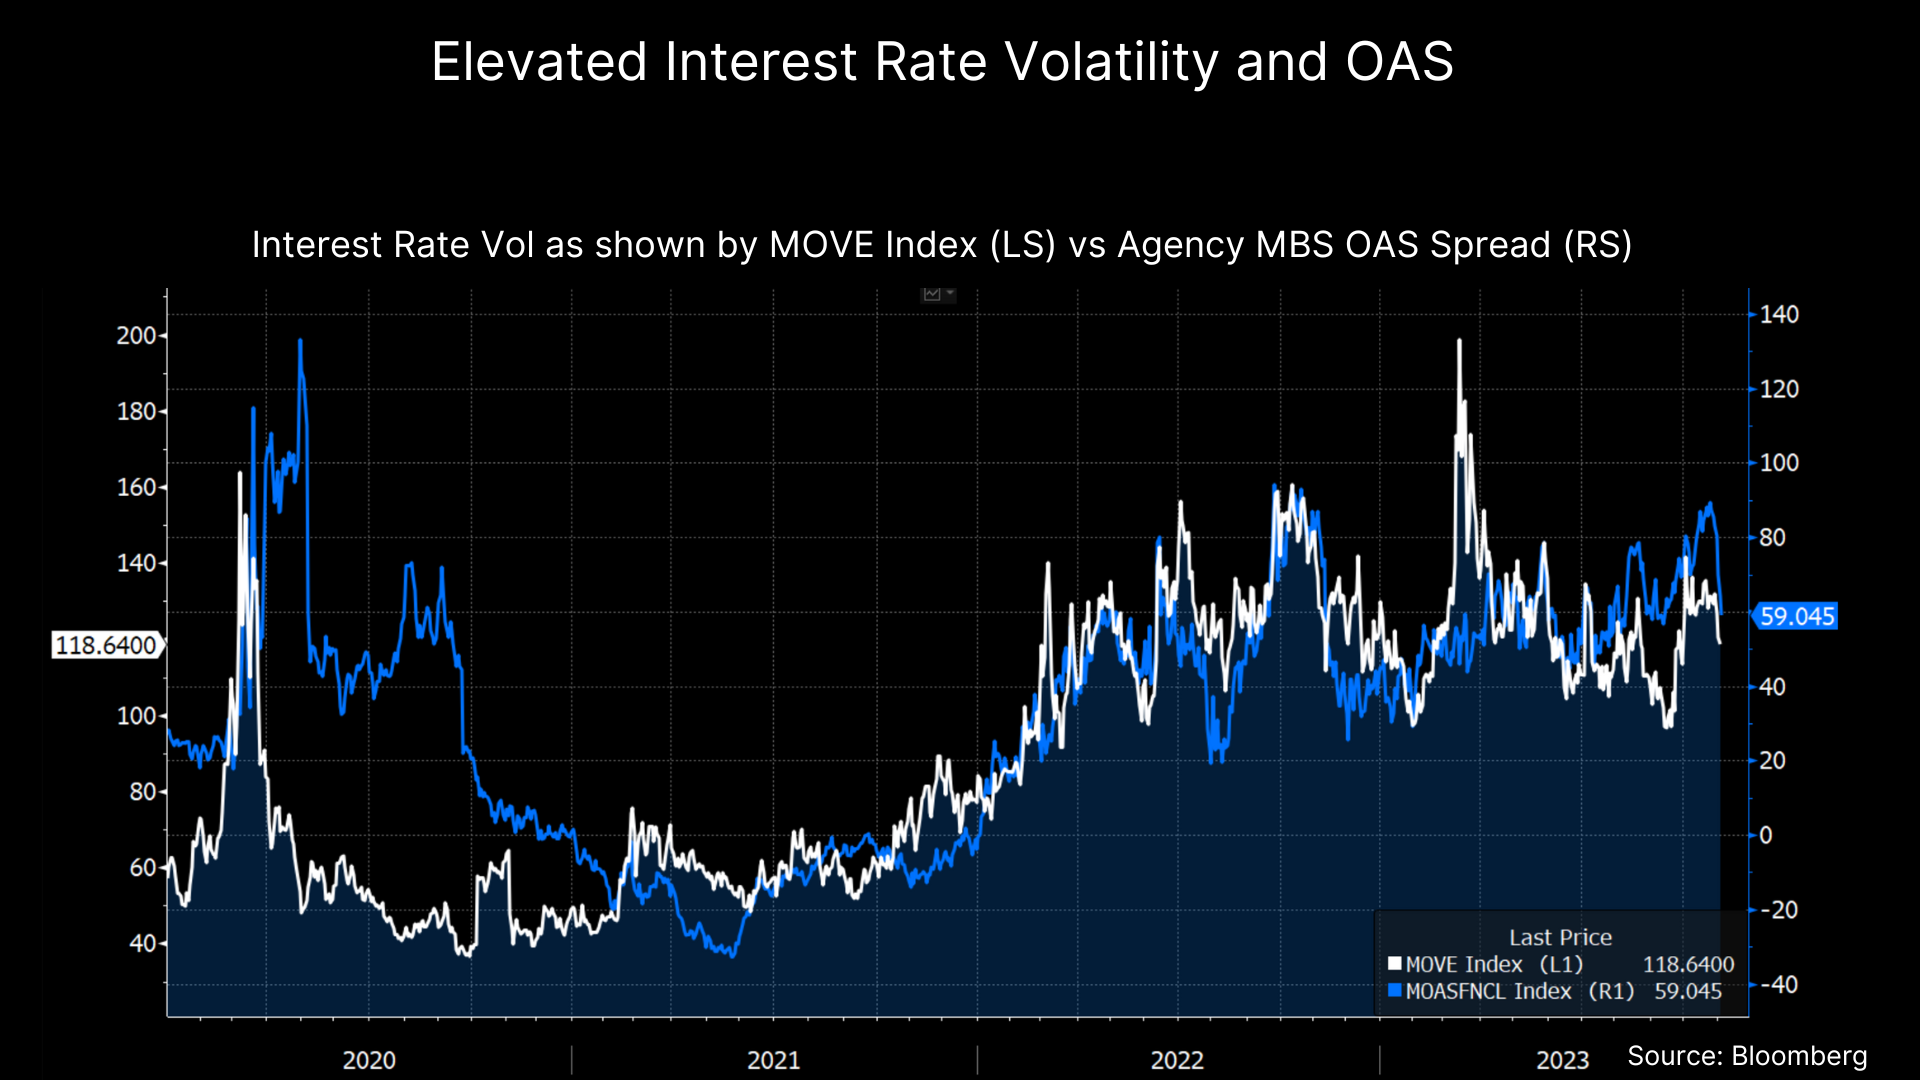
The spread of an agency MBS is driven in large part by interest rate volatility (as an MBS owner is effectively short a call option on interest rates) as well several other supply/demand drivers within the MBS market. Note, the OAS attempts to measure the spread on agency MBS after accounting for prepayment optionality.
Below we show the MOVE Index, which is an index of US bond market volatility and the OAS of a par coupon agency MBS. Both have moved significantly higher in recent years as interest rates have risen.
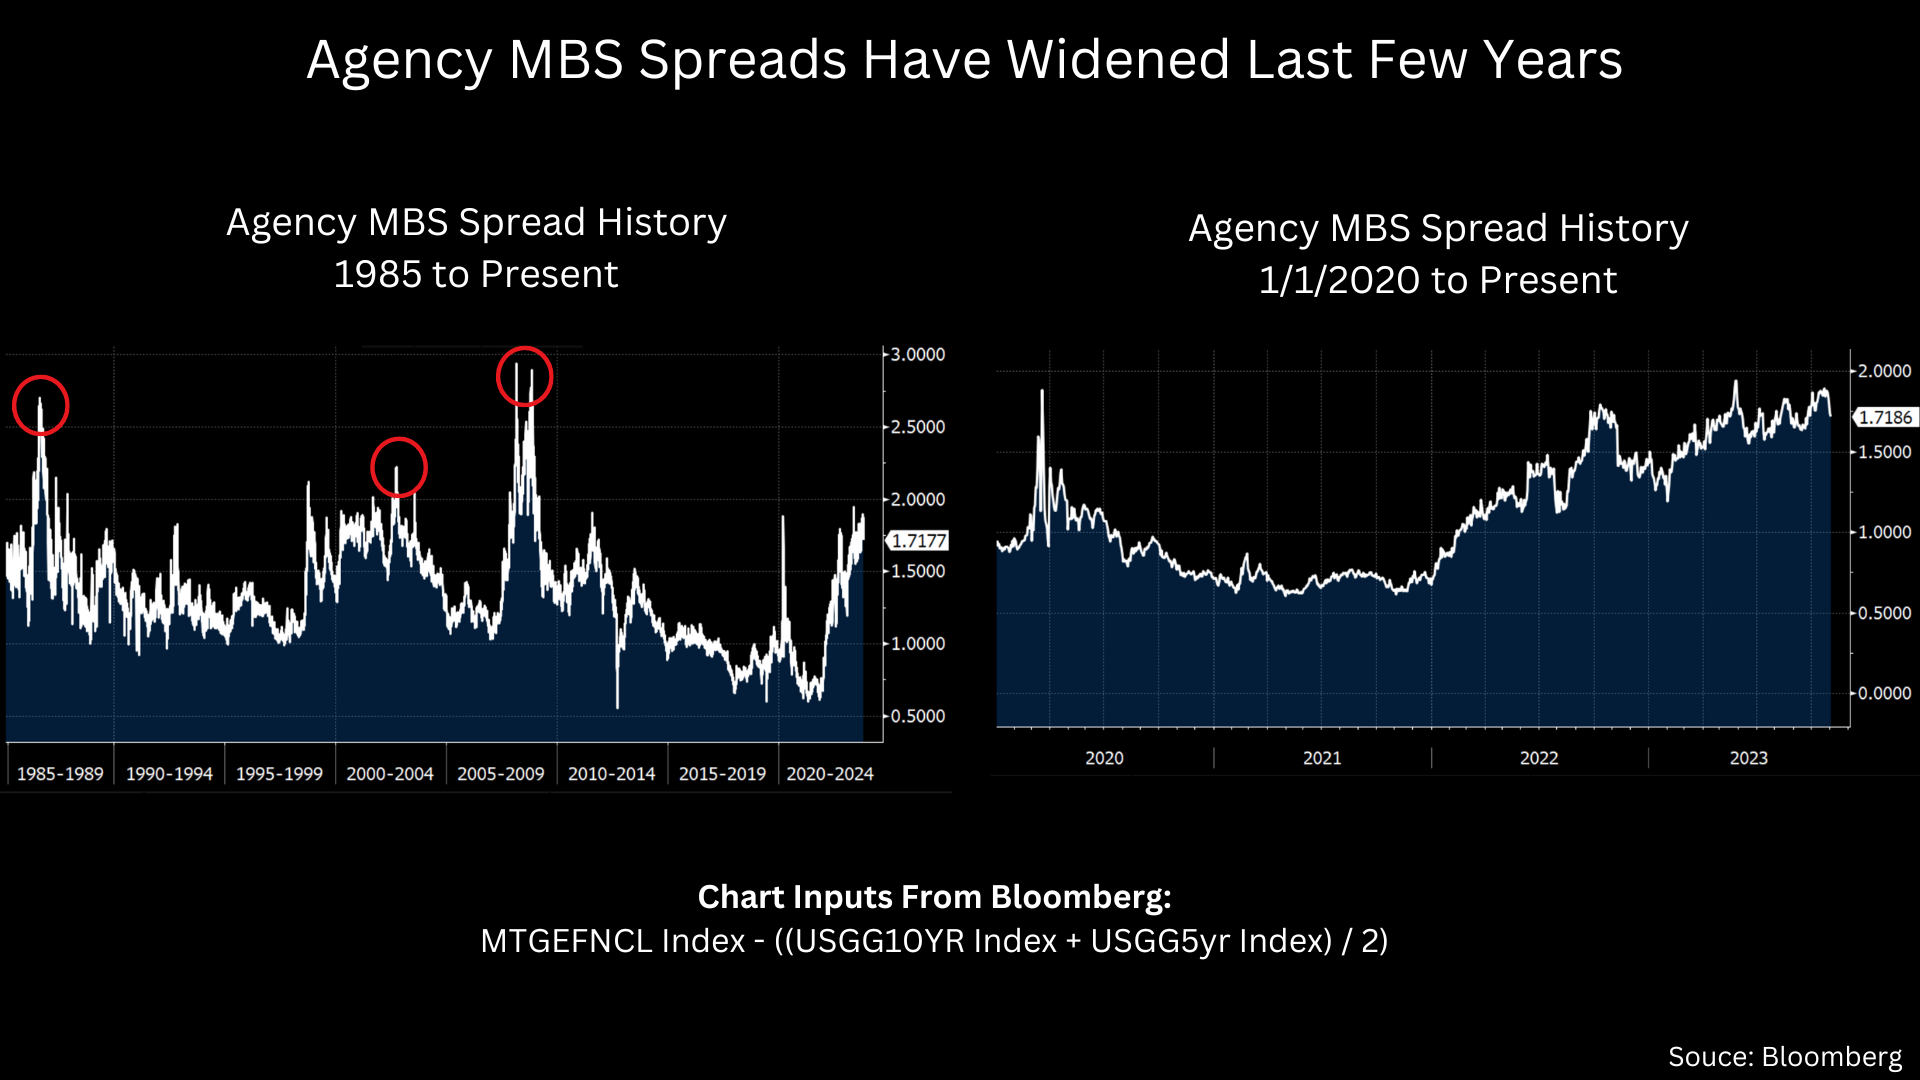
Below we show a straight agency MBS spread history (i.e. not adjusting for the prepayment option) going back 40+ years (left) and the last 3 years (right), using Bloomberg’s model.
An important consideration for agency mREITs is that MBS spreads can spike for various reasons during a crisis as the charts above show. In this scenario, agency mREITs carry material tail risk given they are levered vehicles, and positions should be sized accordingly.
For example, in the early days of COVID (1Q20) when markets were undergoing significant stress, “AGNC” and “NLY” saw 20%+ hits to their book value. However, they fared significantly better than their hybrid counterparts (like “TWO” and “NYMT”) who lost 50%+ of book value.
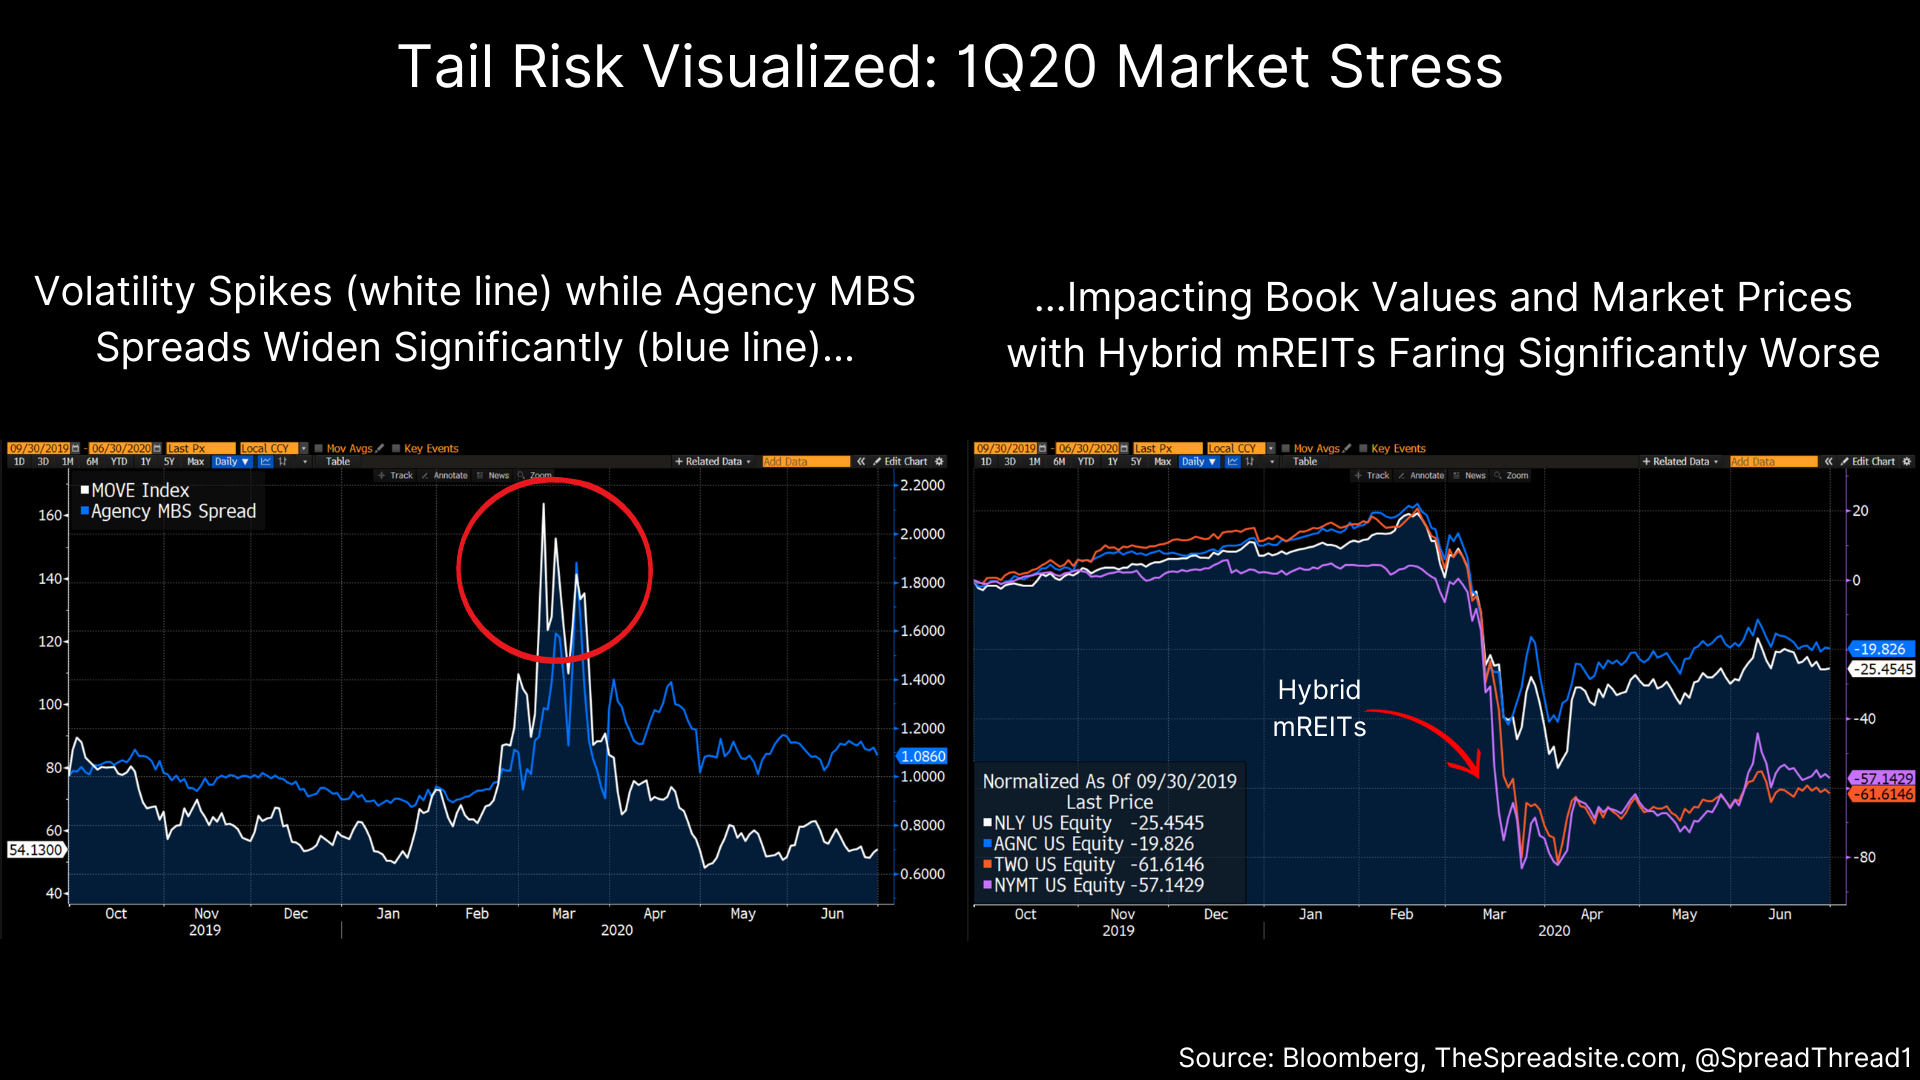
The agency mREITs fared better because the Fed stepped in to buy agency mortgages and calmed the market, but the hybrid mREITs faced margin calls on their non-agency mortgages as repo costs spiked and prices for credit sensitive mortgages collapsed.
The Basics of an agency mREIT
With that macro backdrop we now discuss the structure of an agency mREIT, which is actually quite simple. They own portfolios of residential agency mortgages, commercial agency mortgages and in smaller size, mortgages with credit risk (plus, in the case of “NLY,” mortgage servicing rights).
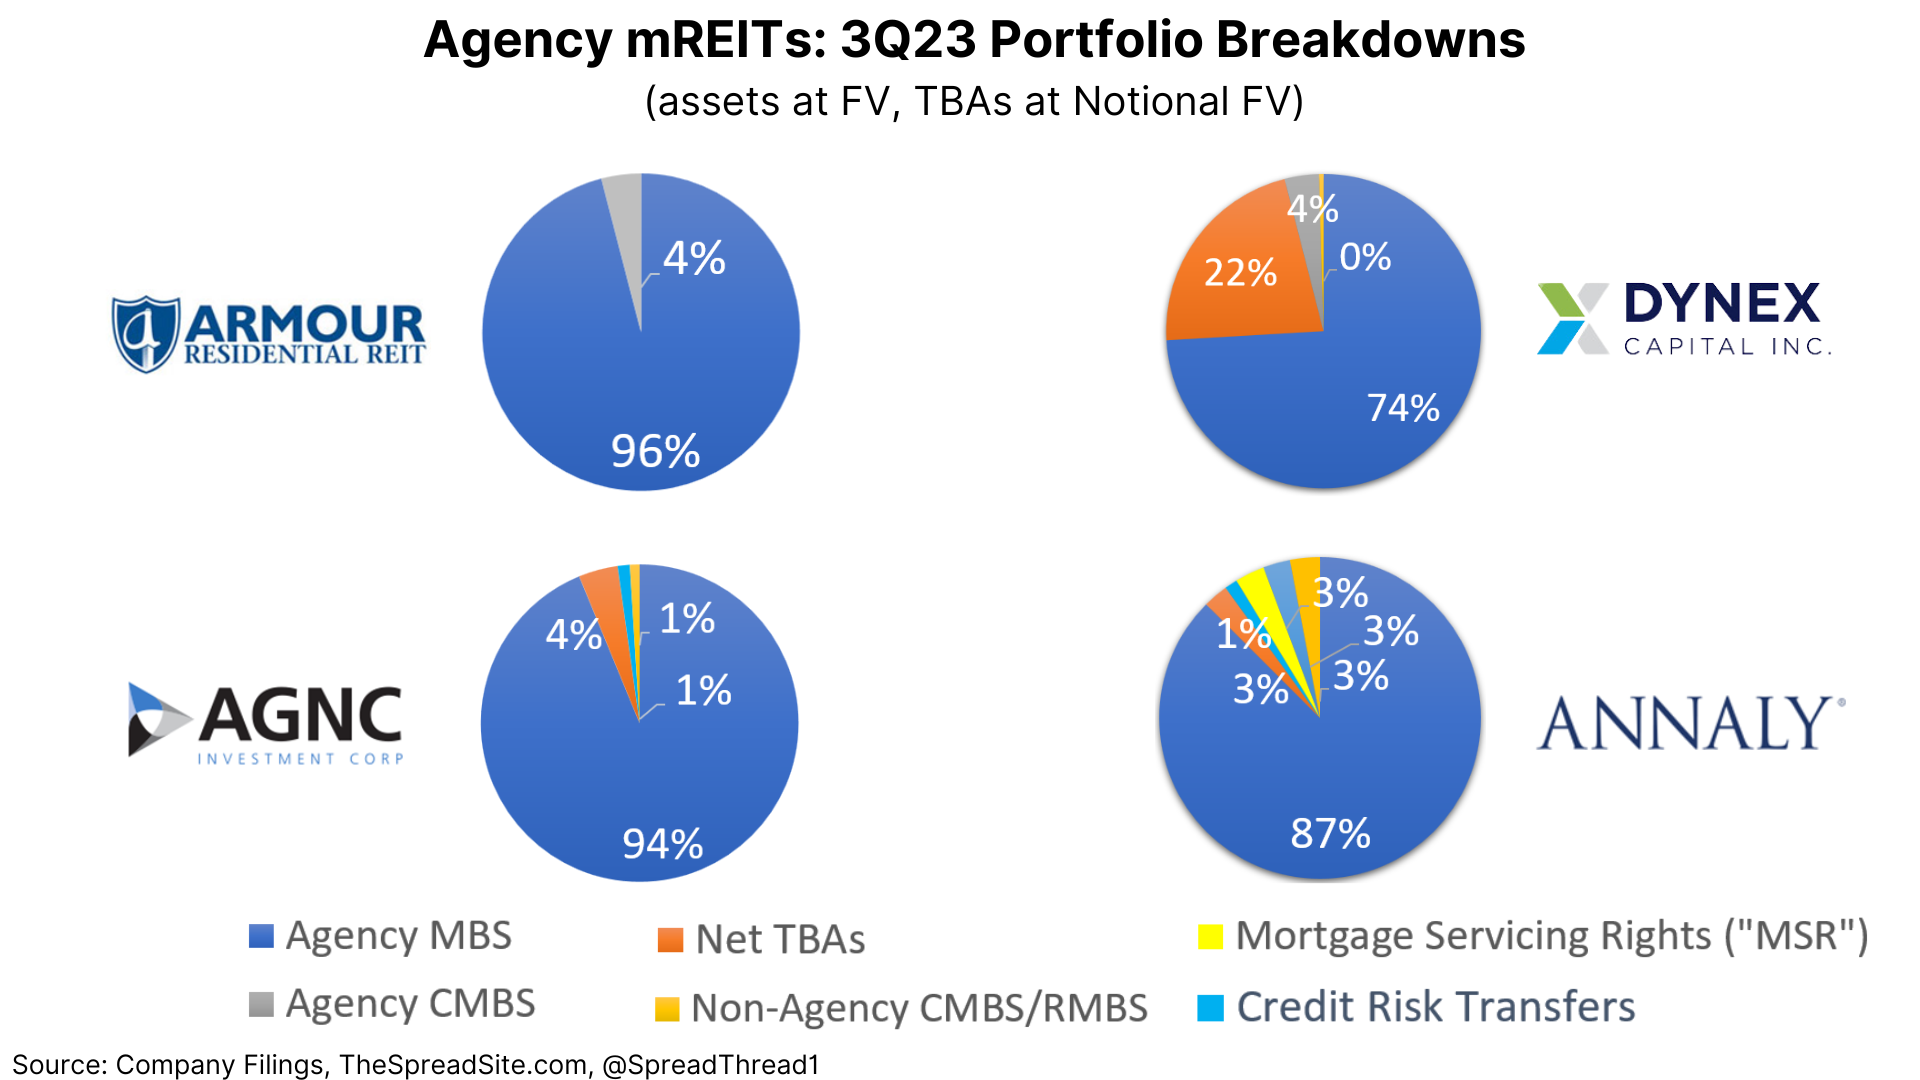
Below, a snapshot of their respective portfolios:
Defining a few additional categories shown above:
- TBAs: the “To-Be-Announced” market is a huge and highly liquid market for forward settling agency MBS pools where the issuer (Fannie/Freddie/Ginnie), maturity, coupon, face value, price and settlement date is determined in advance, but the specific mortgages delivered into the pool can vary. Think of this as the futures market for agency MBS.
- MSR: Mortgage Servicing Rights are the rights to service mortgages whereby the servicer earns a small spread as a fee for managing payments/admin etc. This asset carries a directionally similar duration to MBS, but with slightly different risk/return characteristics.
- Credit Risk Transfers: This is an agency product whereby the risk of an agency mortgage defaulting is purchased by investors. We are not going into detail here, but these assets carry credit risk.
- Non-Agency CMBS & RMBS: These assets carry credit risk as they are not guaranteed by one of the agencies. Within the names above, “NLY” has the largest amount of credit risk within its portfolio at ~5%, which is quite small.
To reiterate, the four names above have portfolios made up almost entirely of agency MBS/CMBS. In other words, they have very little or zero credit risk.
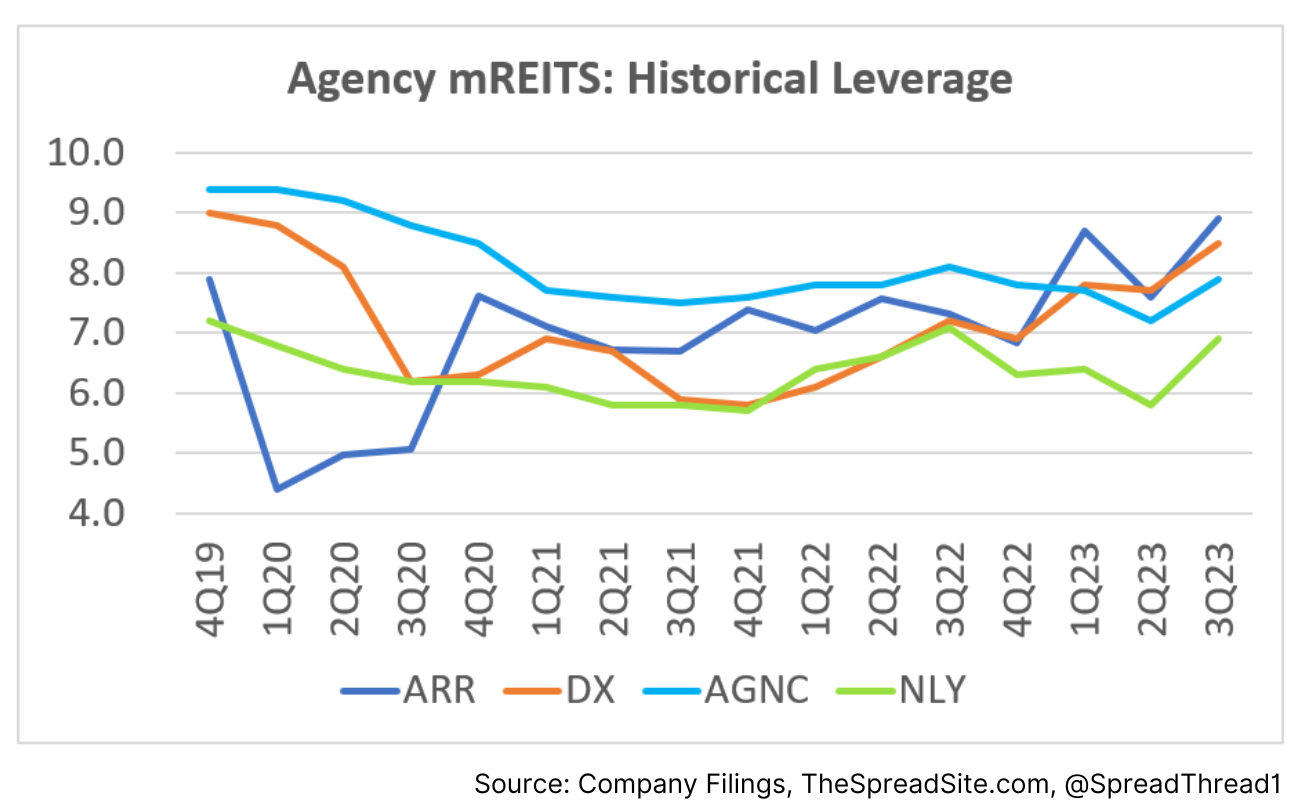
Yet these companies carry significant amounts of basis risk and some interest rate risk, which are magnified given their leverage of ~6-8x. Meaning for every $1.00 dollar of equity, they will own $6.00 to $8.00+ worth of assets. A quick history of their respective leverage below:
The primary funding source for agency mREITs is the repurchase (“repo”) market (currently 5.4%), though leverage can come from multiple places.
Due to substantial leverage and the need to manage interest rate risk, each company carries interest rate hedges. These can also take multiple forms including swaps, short USTs, swaptions etc.
A snapshot of each company’s repo outstanding and rate hedge data is shown below. Disclosure differs by company and we try to provide as much information as is available. There are also preferreds outstanding for each (added source of leverage), discussed later in this report.
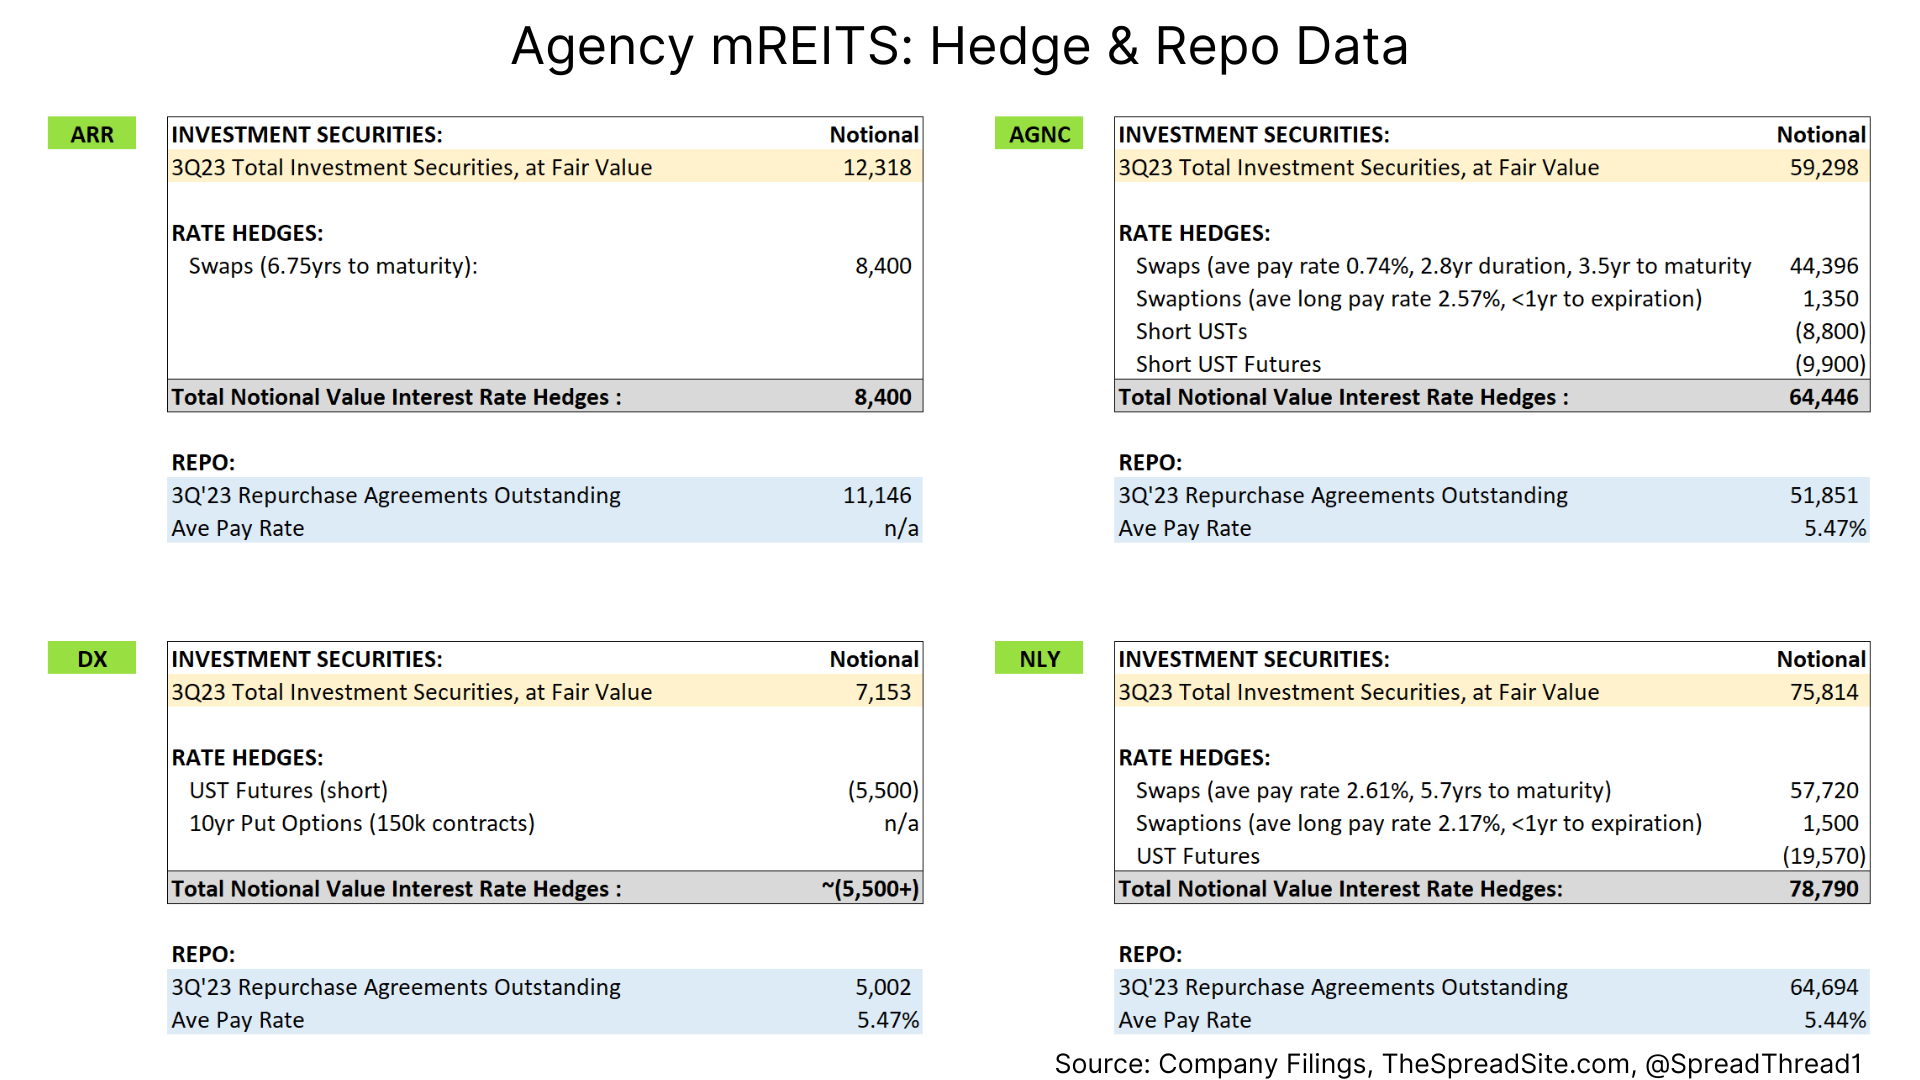
With the main pieces of an agency mREIT outlined (investment assets, leverage, interest rate hedges), the fundamental cash flows can be broken down into four main components:
- Asset Yield: A cash inflow which comes from owning agency MBS
- Repo Rate: The cost of leverage
- Interest Rate Hedge: This can be swaps, USTs, options or a combination
- Prepayments: The cost of negative convexity - dynamic hedging, purchasing options, or a combination
Below is an example attempting to illustrate the moving pieces:
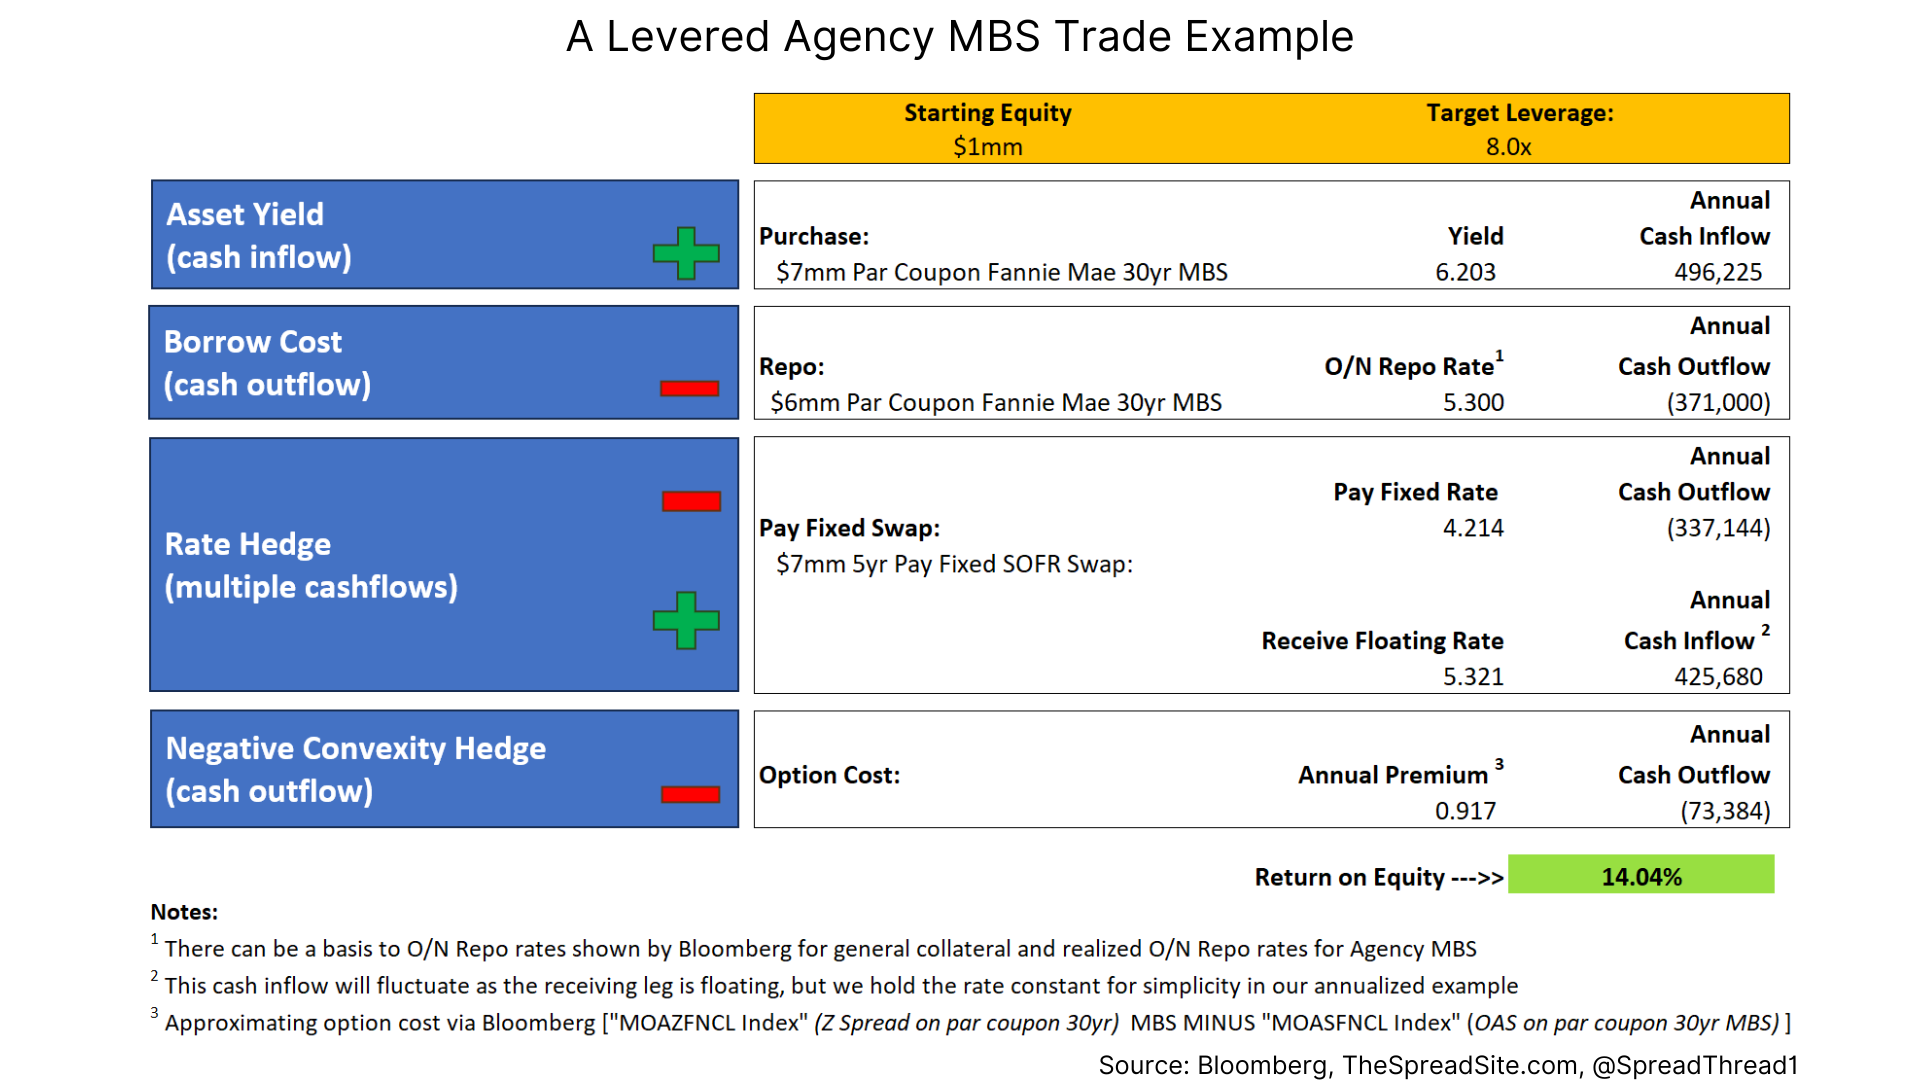
Our example is static and uses a single current coupon MBS. In practice, agency mREITs have huge portfolios that vary in price, coupon, maturity, duration, etc. Furthermore, interest rate hedges can vary by company and by quarter. The example above is meant to simplify a generic levered MBS trade.
Interest Rate & Basis Risk:
With very little credit risk the question likely arises as to why agency mREIT book values are getting decimated?
There are multiple reasons, but the primary culprit has been a widening of agency MBS spreads (i.e., the basis risk). As described above, agency mREITs hedge interest rate risk, though they generally carry some duration (usually between 0 and 1yr). However, their rate risk is significantly smaller than their basis risk. The latter is meaningful given their leveraged portfolios.
The table below attempts to illustrate why a “shift” in rates causes a modest impact (1.3%) to BV given the interest rate hedge.
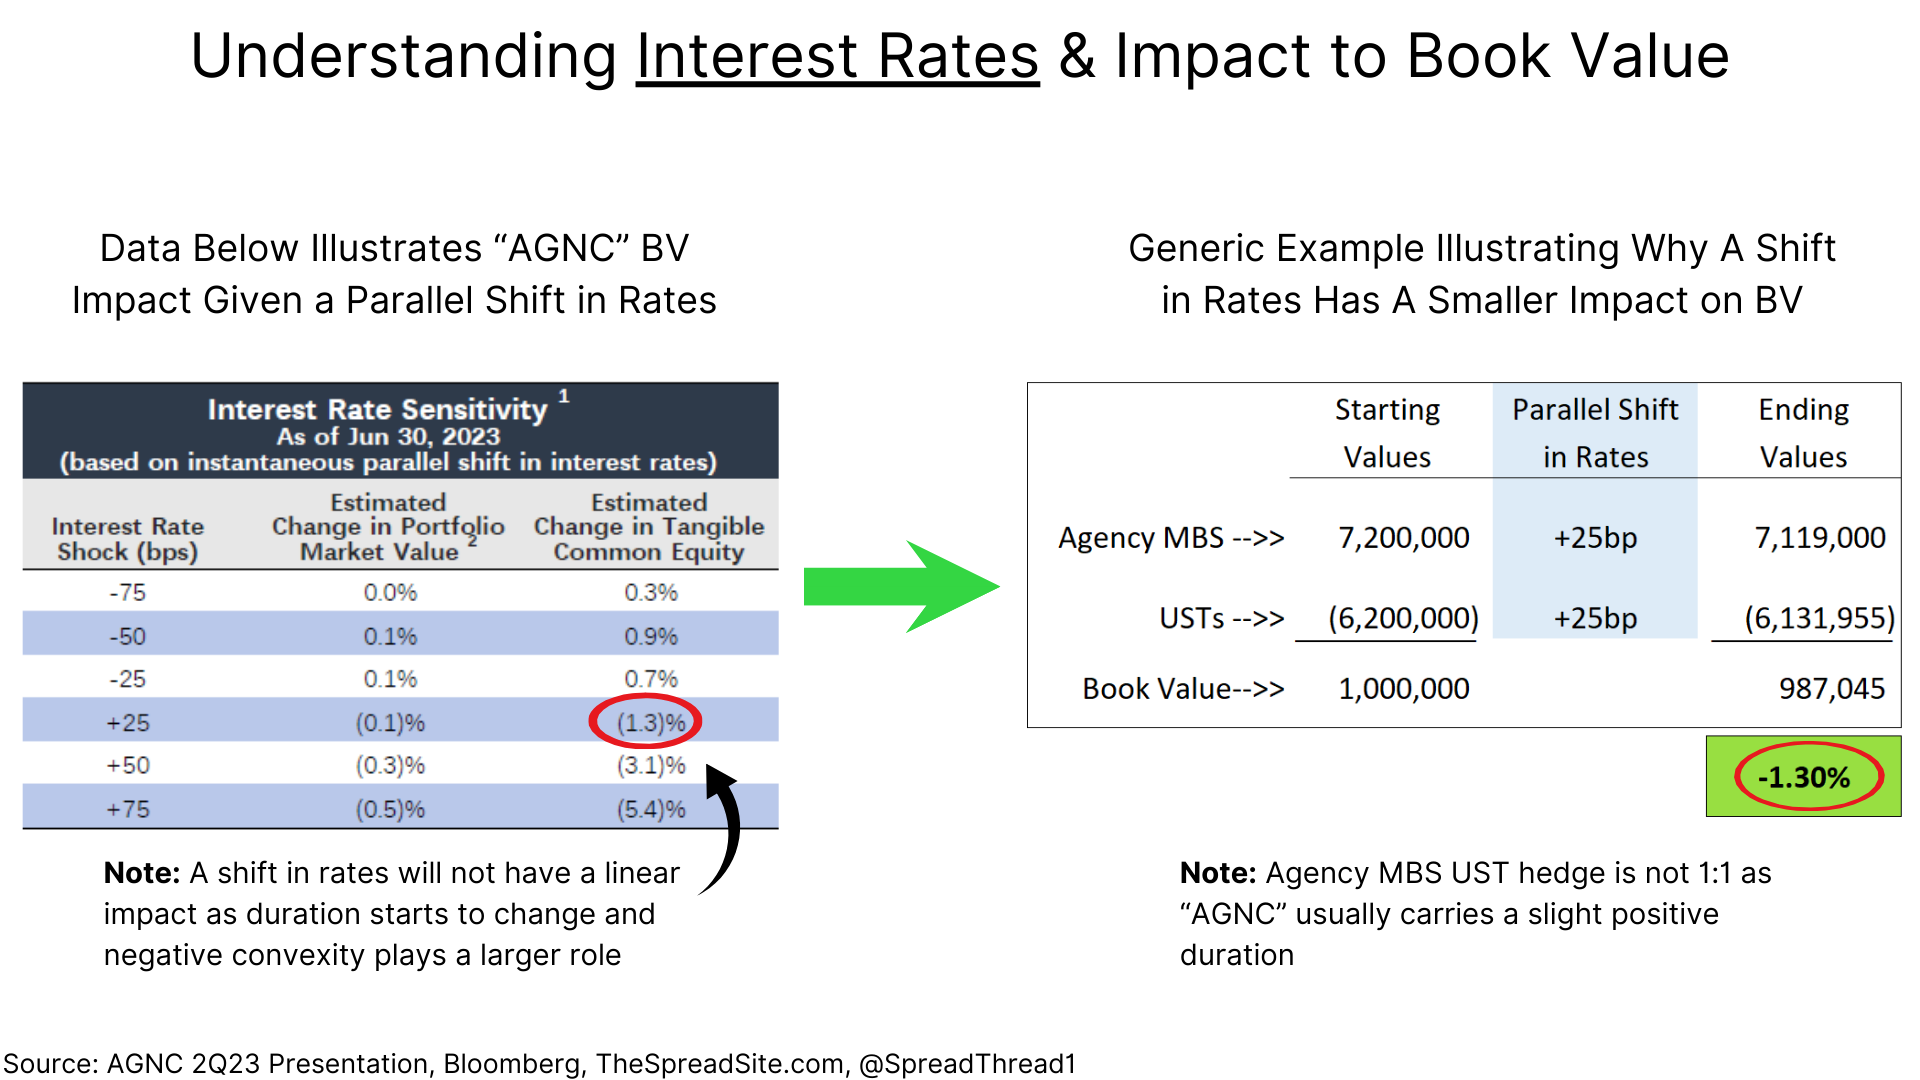
But with basis risk, when the spread between the asset and hedge does not move in sync and the portfolio carries significant leverage, book value changes are magnified.
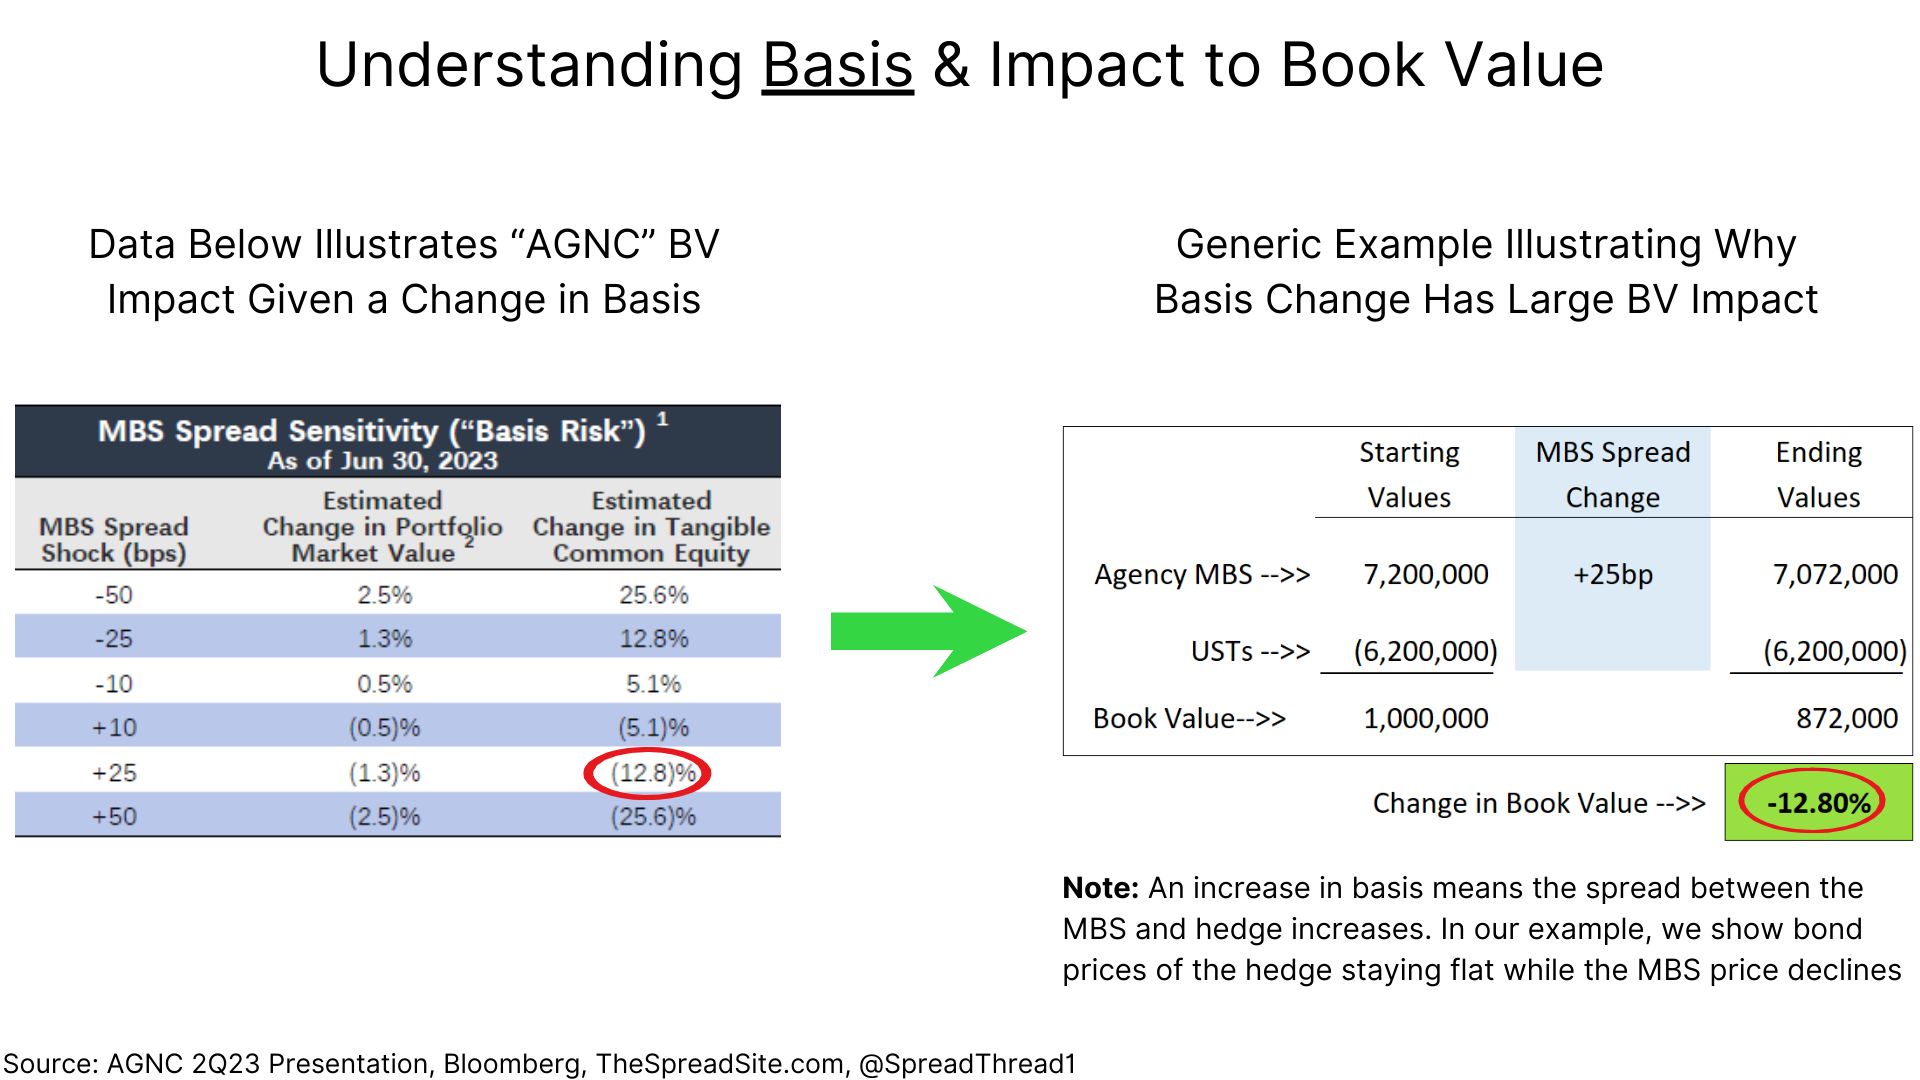
As mentioned in our chart titled “Historical Agency MBS Spread,” this spread has widened dramatically in the past ~2 years from ~65bp to ~175bp. Book values have declined accordingly as shown below.
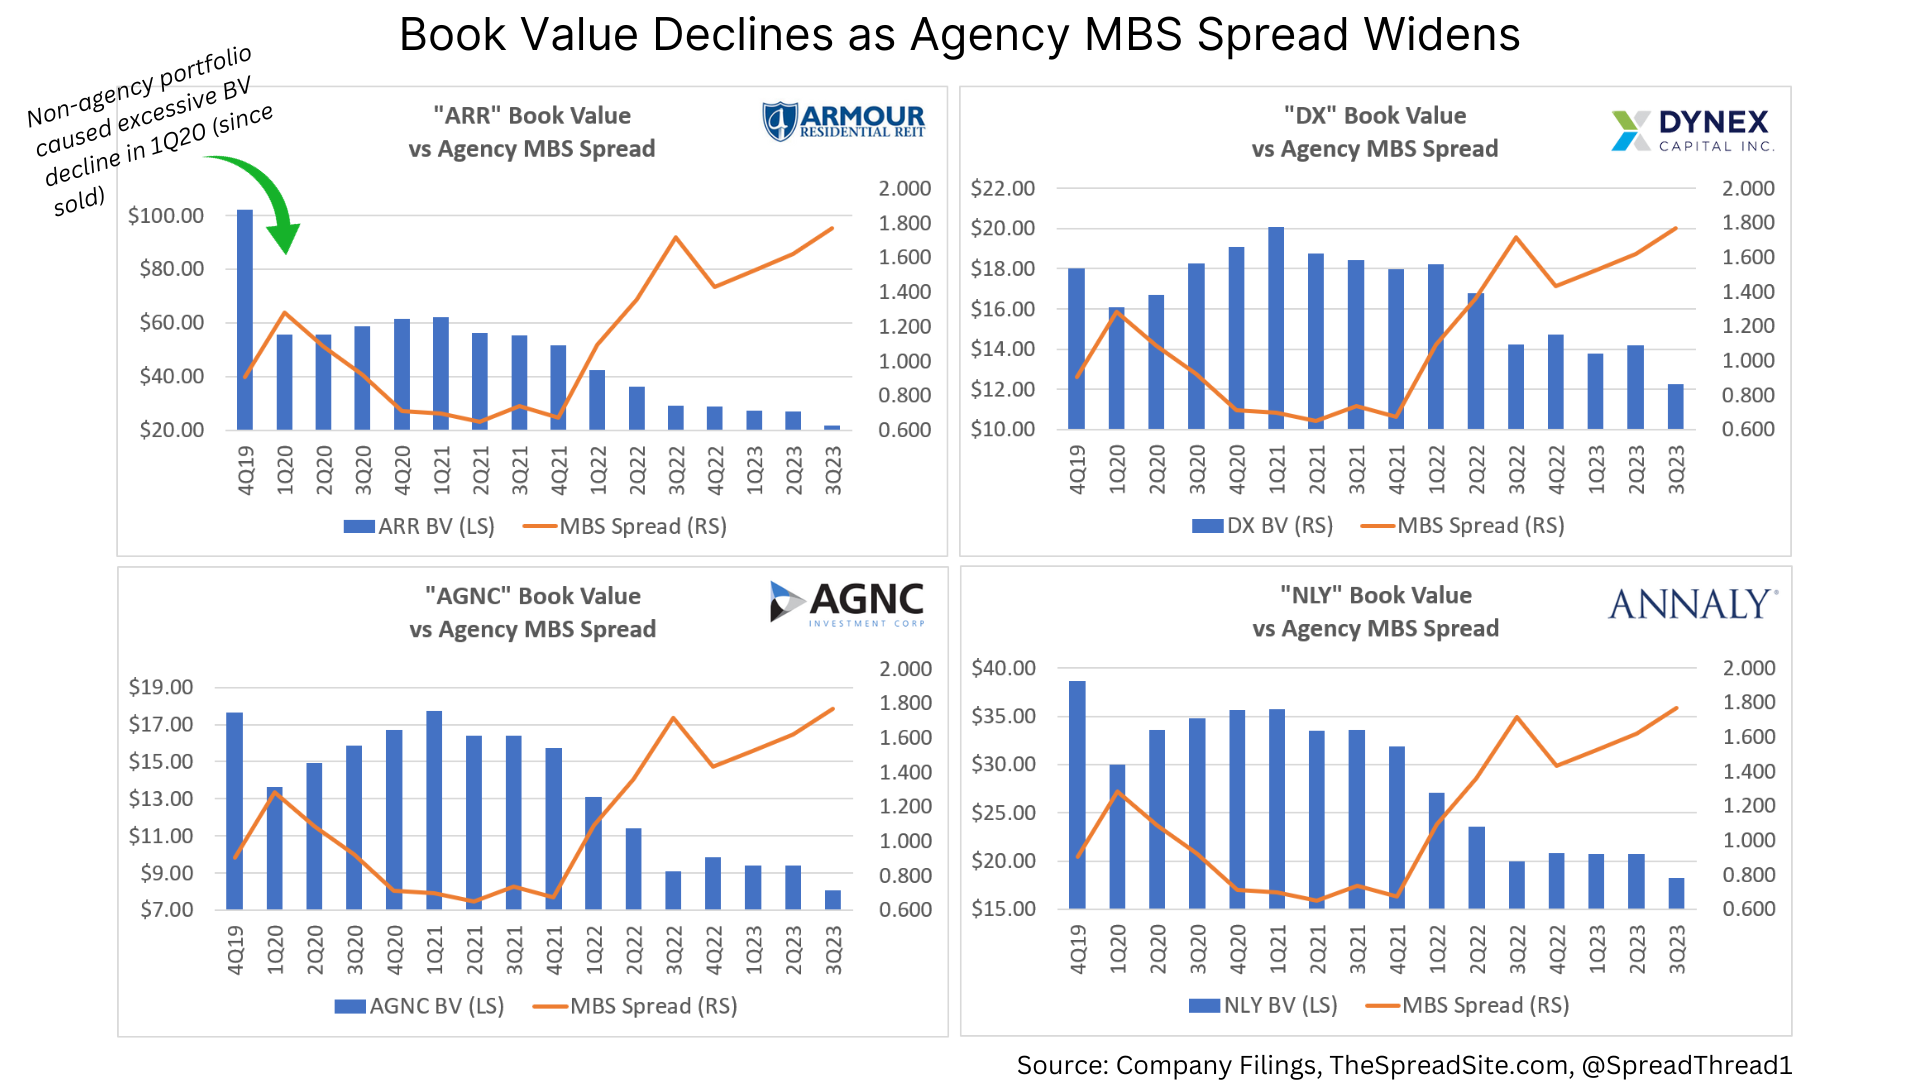
While the move wider in the agency MBS spread has been painful for shareholders, we think the current environment bodes well for future returns, as discussed below.
Wide Spreads & Future Returns
To be clear, these companies carry significant book value risk as shareholders are essentially short the agency MBS spread. This spread will move wider with increased interest rate volatility, poor MBS technicals, and economic shocks that cause illiquidity in the MBS market.
Yet future returns are typically best when the starting asset value is “cheap.” Wide MBS spreads, combined with our view that long duration treasuries are cheap (less so after this week’s rally), is a favorable setup, in our view.
The CEO of “AGNC” put specifics around returns during their 3Q23 conference call, and we can use our “Levered Agency MBS Trade” example to put numbers around his comments:
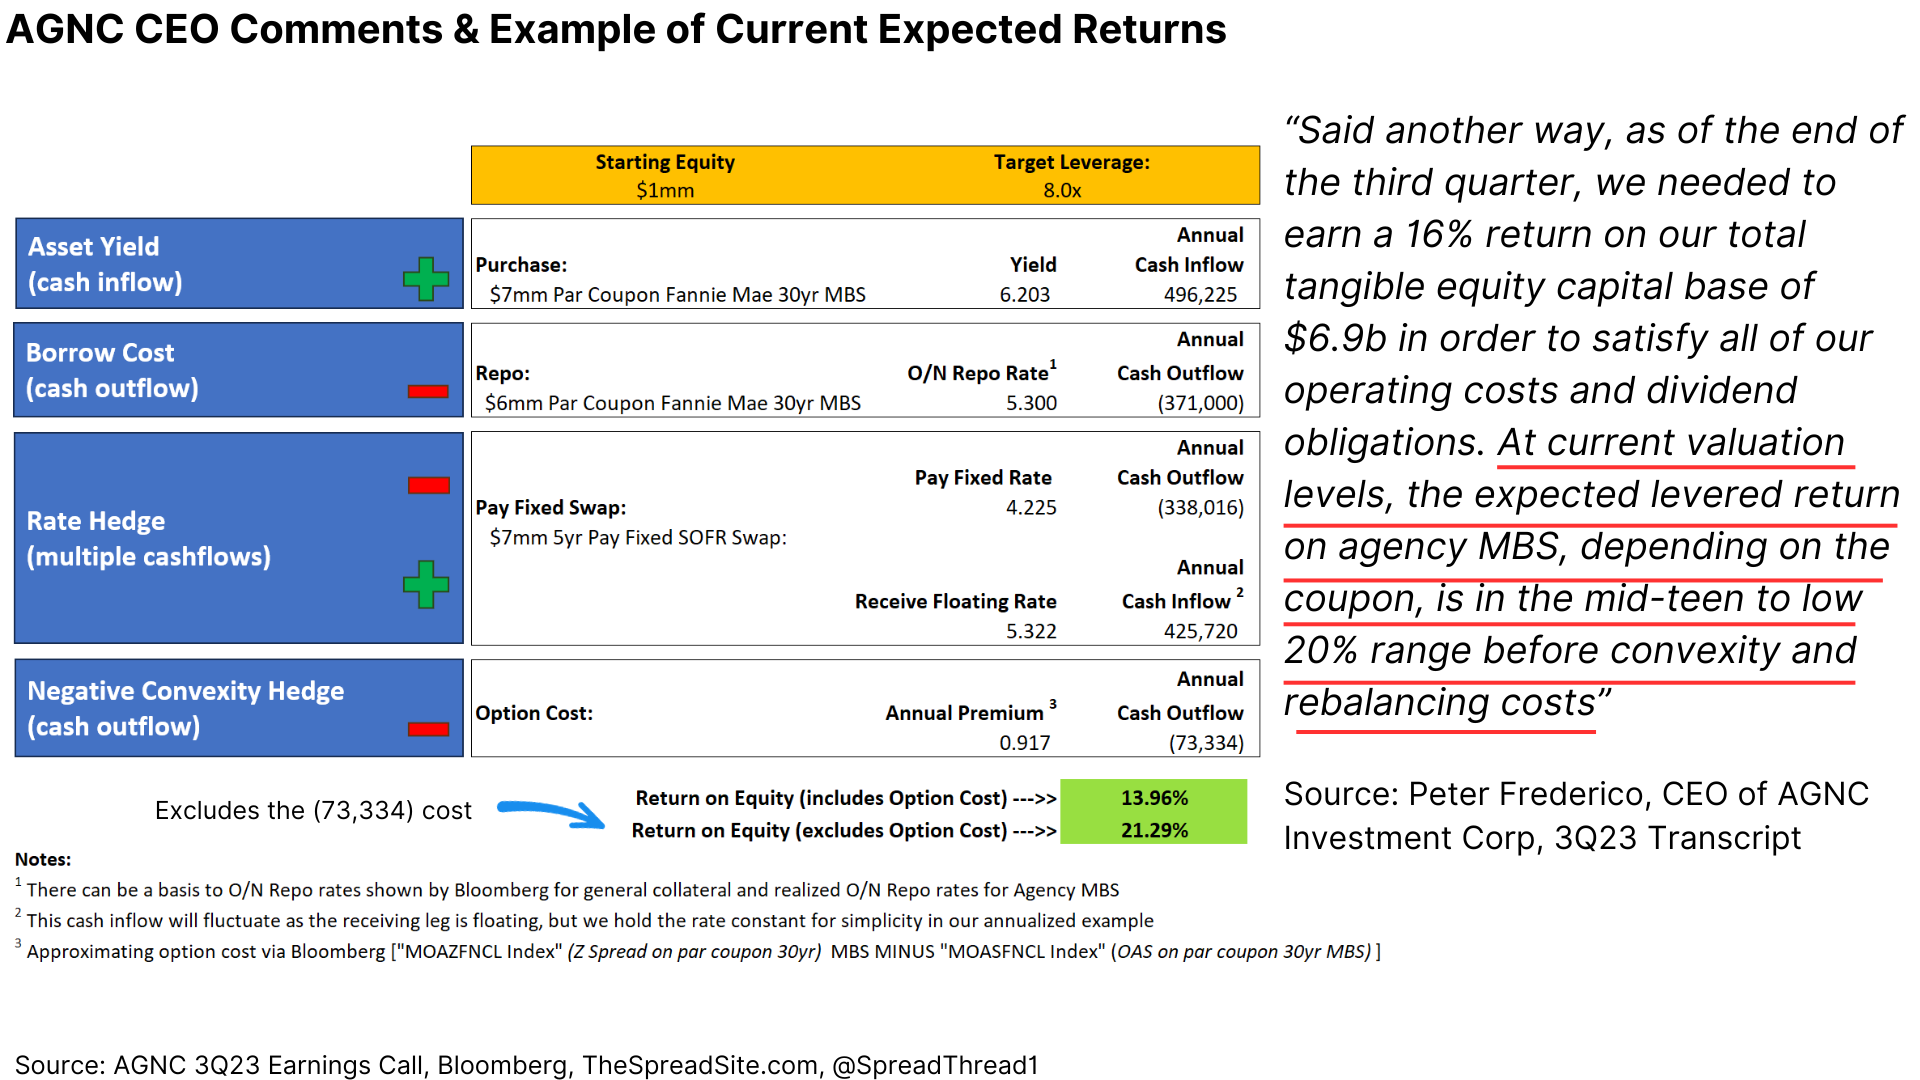
It is clearly not appropriate to think about returns EXCLUDING convexity and rebalancing costs (operating expenses of ~1.5% also should be subtracted), but we think a low to mid-teens type return is reasonable assuming agency MBS spreads remain stable. If spreads tighten either from lower interest rates, lower interest volatility or a less inverted yield curve, the return from book value appreciation could be substantial.
Understanding Financial Statements:
Our focus will be on “AGNC” and “NLY” as we prefer to stay up in quality and size when it comes to agency mREITS. They have also outperformed “ARR” and “DX” in total return over the long-term.
The financial statements are quite confusing (at least to us). We find it helpful to think of each company in two parts:
- Income from their net interest spread and
- The price change of their hedged MBS securities
Said another way, there is a current yield component which is the income used to pay dividends, but also gains or losses as their MBS securities move around and hedges adjust accordingly. Without going into excessive detail, duration, mortgage prepayment estimates (i.e. “CPR”), and volatility change with interest rates. All these moving pieces lead to adjustments to investment portfolios and associated hedges, often with a cost.
In terms of net interest spread, both “AGNC” and “NLY” use slightly different terms for this metric, but it is essentially what they view as spread income that can be paid to shareholders.
- For “AGNC” this metric is “Net Spread and Dollar Roll Income, Excluding Estimated “Catch Up” Premium Amortization”
- For “NLY” this metric is “Earnings Available for Distribution”
Both companies back out a GAAP accounting convention that requires unrealistic mortgage amortization assumptions to flow through their income statements. The metrics above back out this amortization (which we think this is appropriate) and can be found in quarterly and annual filings.
However, it is important to know these metrics DO NOT include price changes in their hedged MBS securities.
We can chart this spread income compared to declared dividends and overlay the changes in hedged MBS, which is shown below.
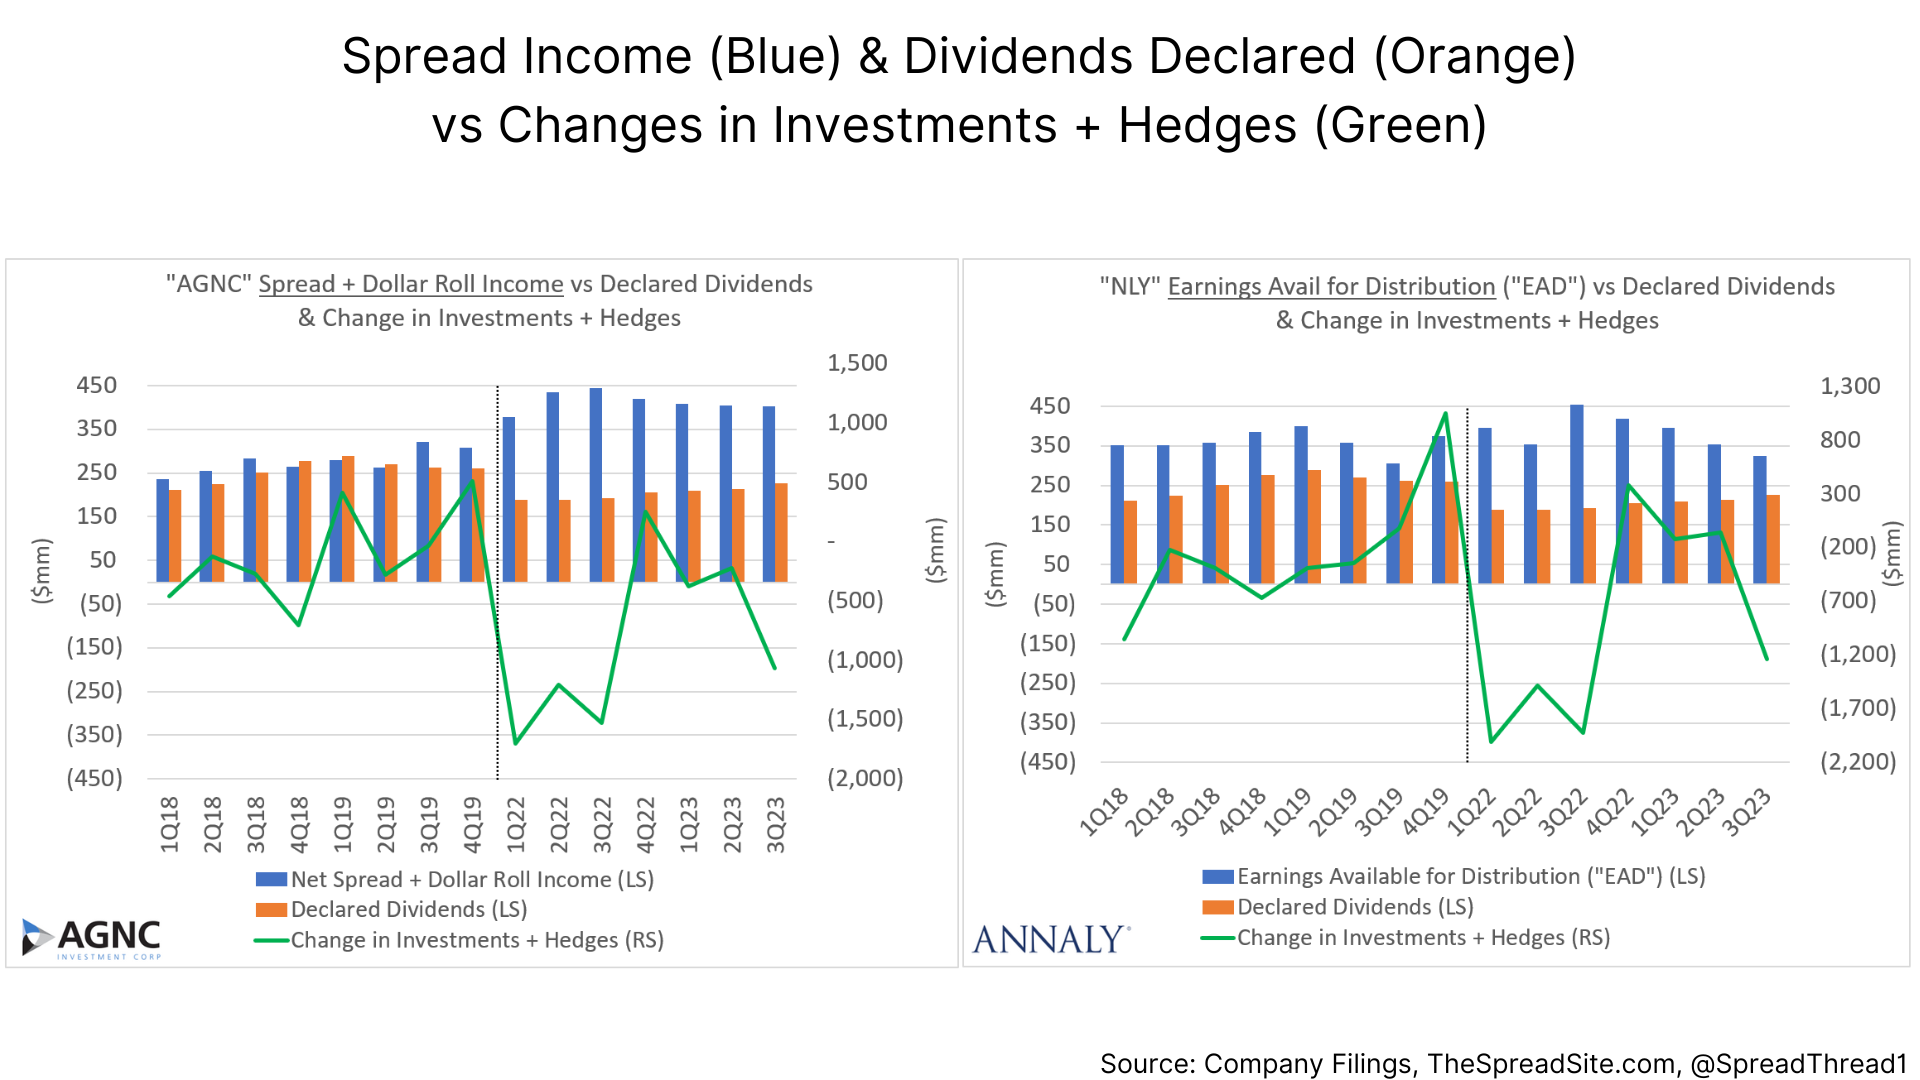
The key takeaway is that since 2022, each company has suffered significant losses to book value as the basis between agency MBS and respective hedges has widened (among other factors).
Clearly there is enough spread income to pay dividends at current levels, but to the extent each company continues suffering losses on their hedged investments, this could change.
As a further illustration we show data from 3Q23. As the table shows, the double-digit dividend yields are covered by spread income. But each company is taking huge hits on the prices of their hedged MBS.
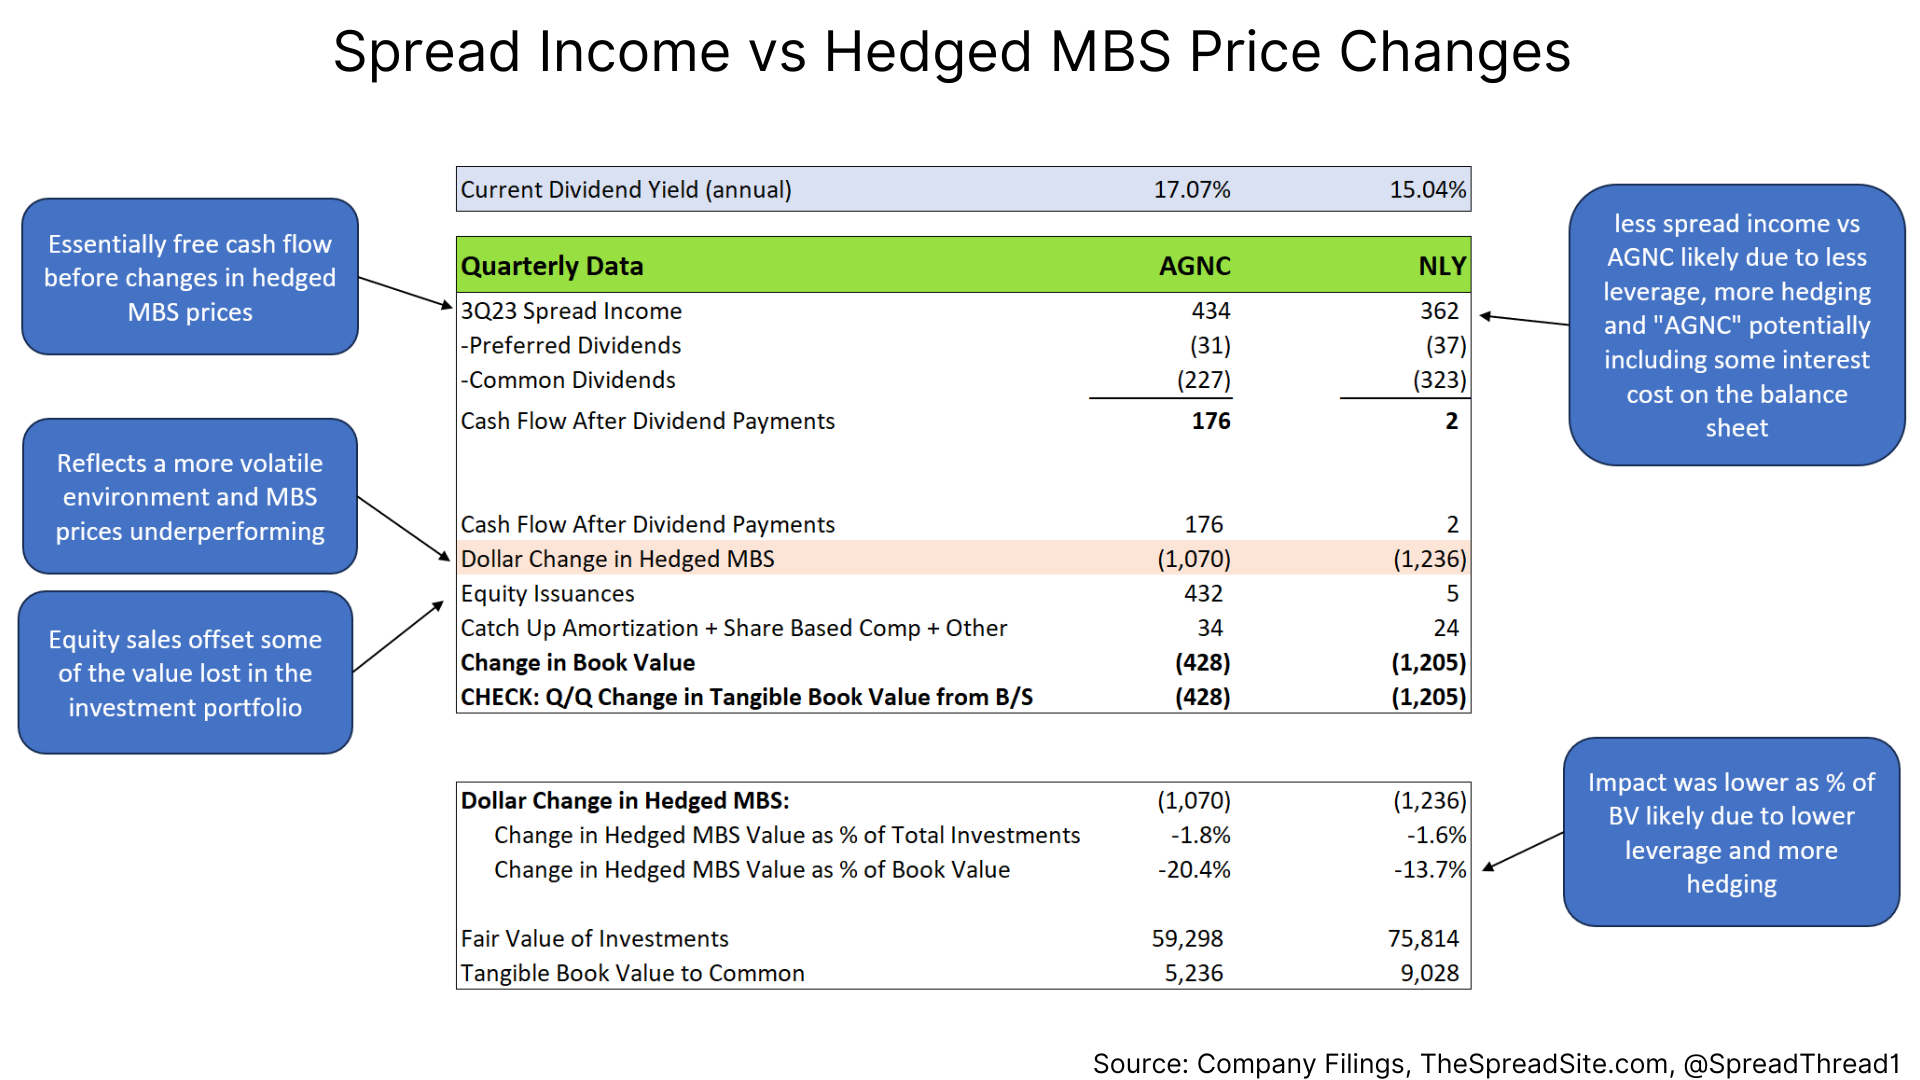
The table details the drivers of total return. To the extent losses in their hedged MBS portfolios stabilize, a mid-teen return appears reasonable. And as mentioned earlier, there is upside if MBS spreads tighten.
Finally, looking at historical returns, the table below shows sizeable dividend income over time, offset by book value declines, though still a positive total return.
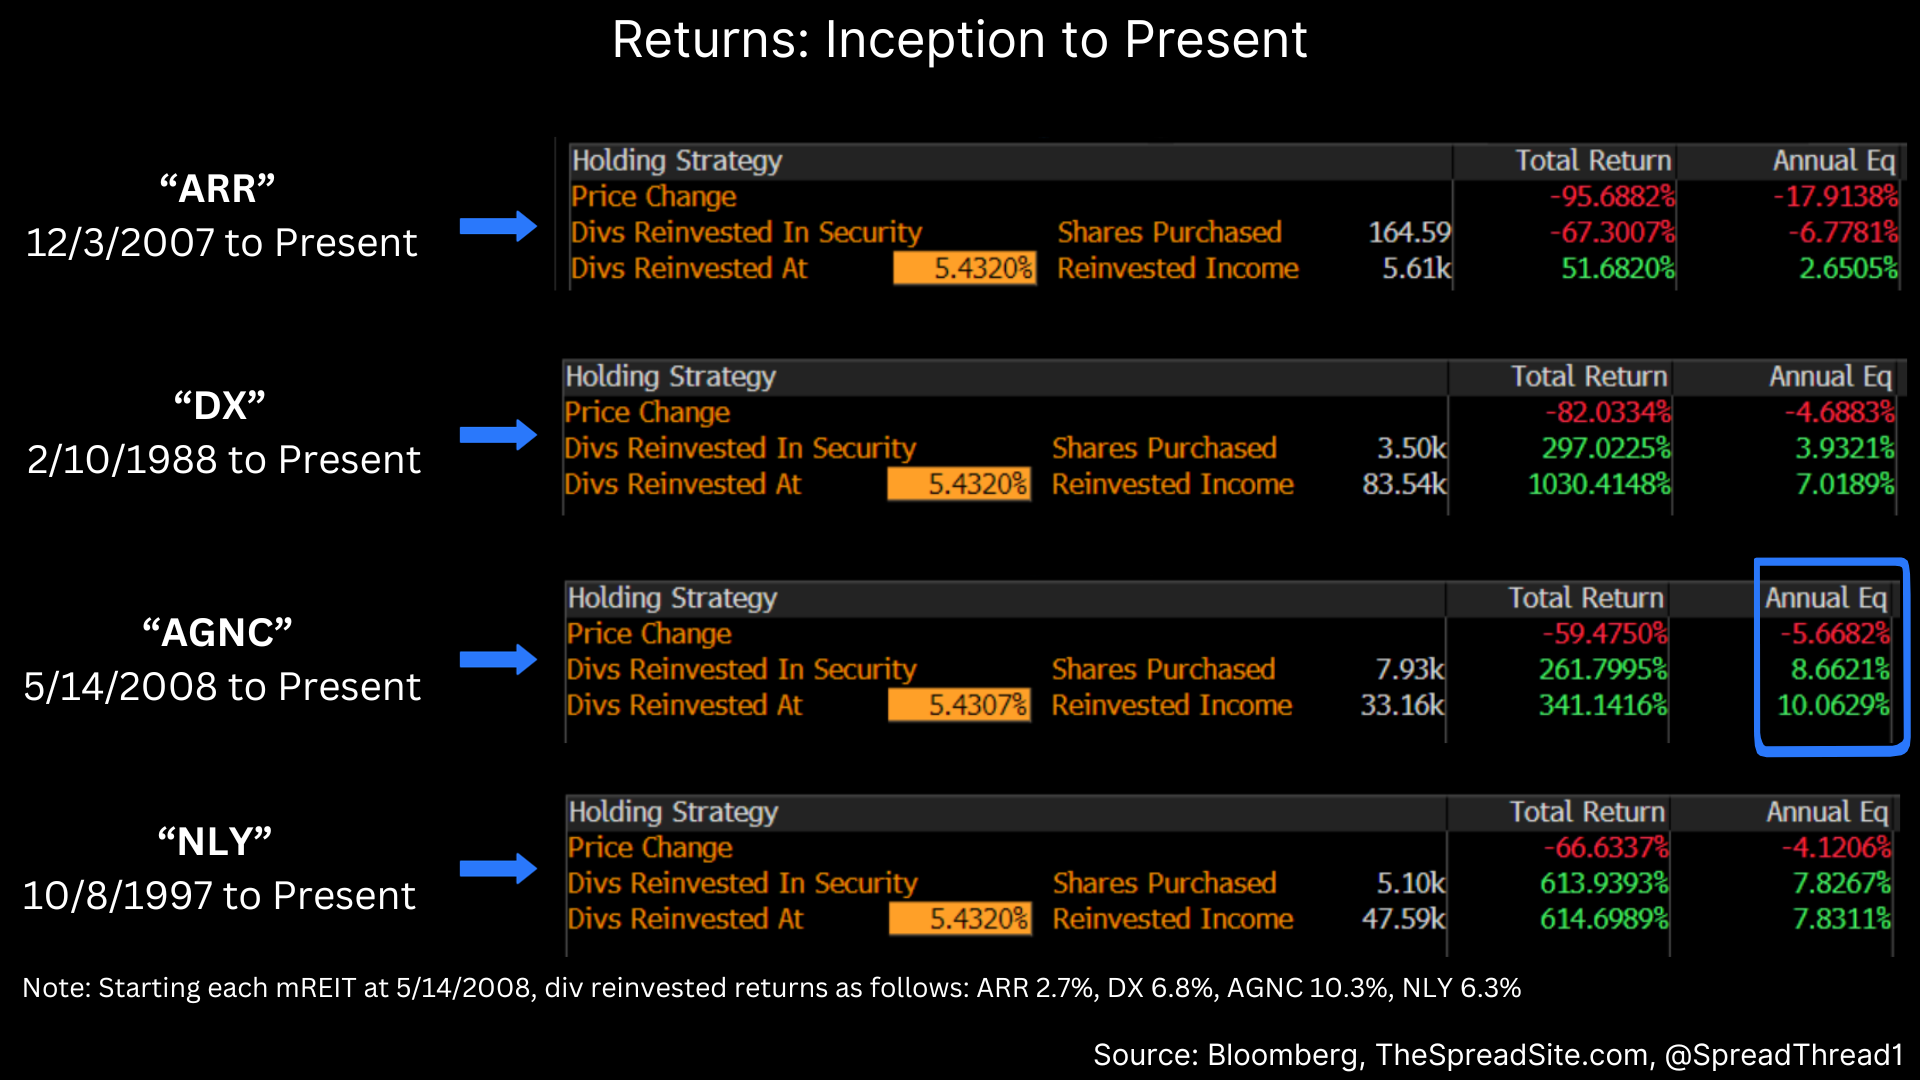
When viewed from inception, it is debateable whether high single-digit to low double-digit total returns is appropriate for agency mREITs given their tail risks. If the starting point was a low-rate environment with very tight spreads, we would be much more cautious on these companies.
Recommendations:
With above average option adjusted spreads, significant spread income, plus the potential for book value appreciation, our view is that “AGNC” and “NLY” have favorable risk/reward characteristics.
Due to inherent tail risks, we cannot advocate large positions in either, but we would buy at current levels.
“AGNC” is a more of a pure play on agency mortgages and has outperformed “NLY” since its inception date of 5/14/18. One downside is that their equity trades above book value whereas “NLY” is around 1x. Given how much book value erosion they’ve experienced in the past 3 years, some may argue a discount to book is warranted.
While only about 4.5% of their overall portfolio, “NLY” does have slightly higher credit risk, but also trades cheaper on P/BV and has suffered from less BV decline. Either way, they are investing in the same asset class and perhaps “AGNC” can be viewed as the higher beta play.
We choose to avoid “ARR” and “DX” as they are significantly smaller players and in volatile environments, size can be a big advantage.
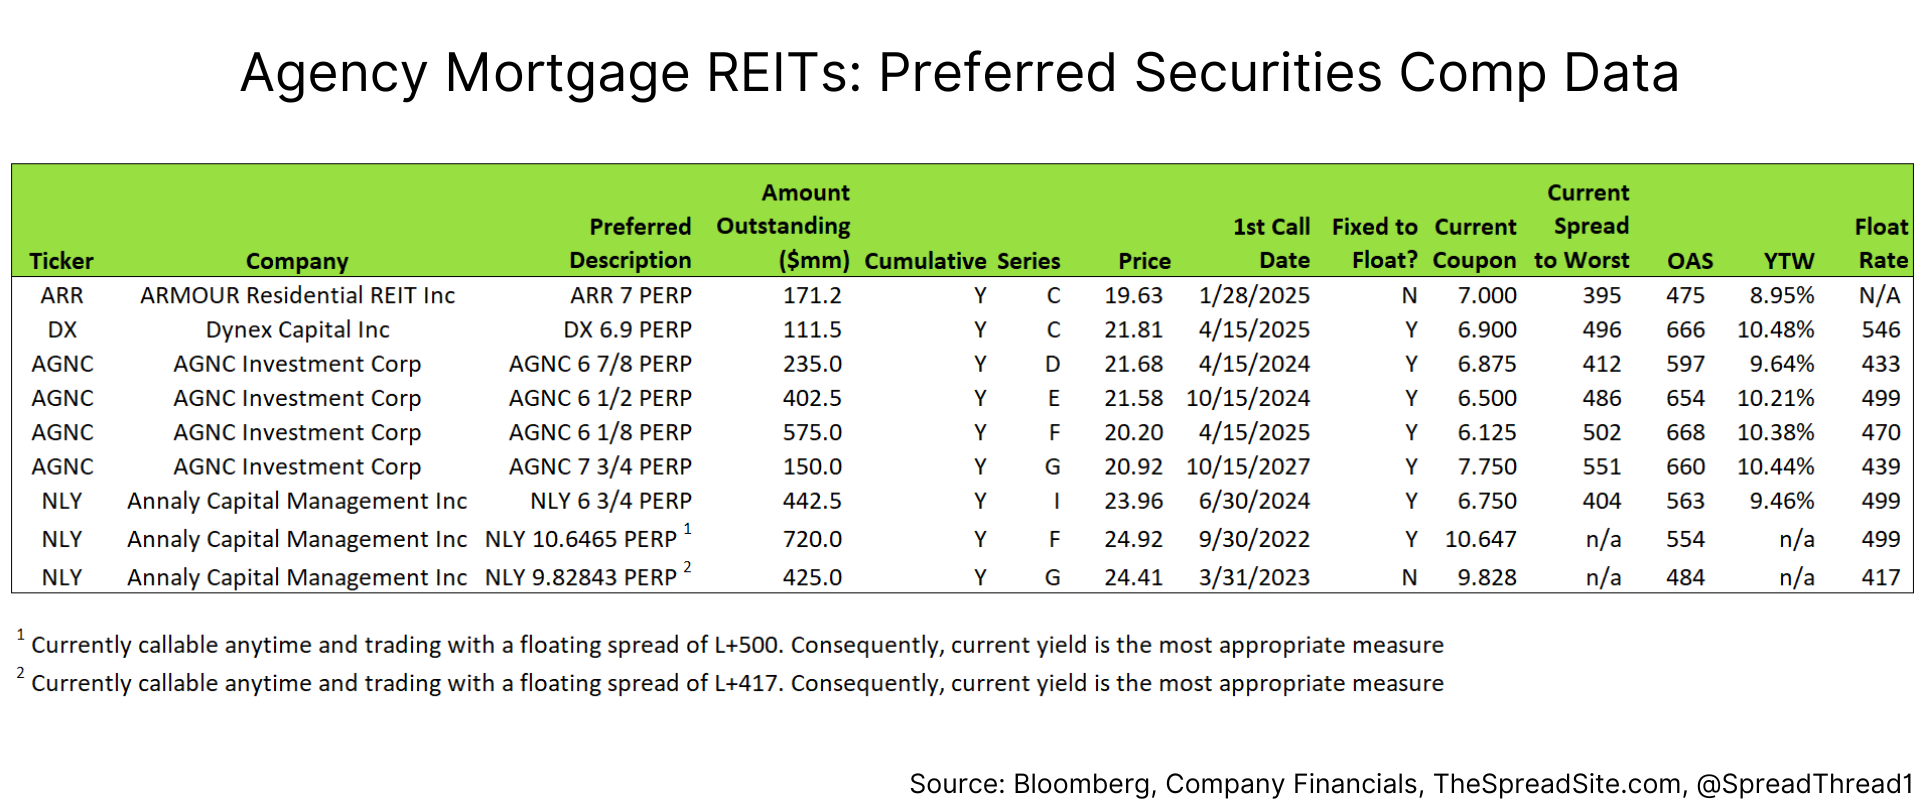
The Preferreds:
As mentioned earlier, each agency mREIT has preferred(s) outstanding. Given a limited leverage difference through the preferreds compared to the equity, we would avoid these securities. Said another way, in a bad scenario the preferreds could have similar downside risk to the equity but without the associated upside potential.
Appendix: 3Q23 Results:
Generally, quarterly results were weak with management teams highlighting a difficult macro environment (i.e. wider agency MBS spreads and higher volatility) but also mentioning a very attractive return outlook. Furthermore, dividend cuts were not mentioned. Quarter over quarter book value declines were as follows:
ARR: (19%)
DX: (15%)
AGNC: (14%)
NLY: (12%)
Additionally, each company highlighted that through the third week of October, book values were down again vs 3Q23 in the following amounts:
ARR: (17%)
DX: (14%)
AGNC: (15%)
NLY: (5%)
It is likely book values have appreciated from the intra quarter update as interest rates and agency MBS spreads have declined.
Appendix: "The Dollar Roll"
“AGNC” mentions “The Dollar Roll” often and typically earns an income from what is essentially a feature of the TBA market. At a high level, the (mostly) persistent supply and demand mismatch in the TBA market allows them to either obtain a slightly cheaper cost of funding agency MBS purchases or to earn additional spread.
In terms of the supply/demand mismatch, the following is usually true in the TBA market:
- Mortgage originators need to sell production for later months given they have locked rates for future delivery. This leads to systemic selling in outer months.
- Banks usually want to buy front month MBS so they can start accruing interest once they own settled securities.
- Trading desks that structure collateralized mortgages have a need to buy various types of agency pass throughs for the current month to settle their deals. This leads to front month buying.
If an agency mREIT is selling The Dollar Roll, they are taking the opposing side of the dynamics mentioned above (i.e., buying out months and selling front months) to achieve a small spread.
For more on The Dollar Roll, please see the following article from TCW titled ”An Introduction to Mortgage TBAs”
Disclosures
Please click here to see our standard Legal Disclosures
The Spread Site Research
Receive our latest publications directly to your inbox. Its Free!.


