Bank Stocks, Charts & Data: 2Q23
The Banking Sector In Charts
Now that banks have reported 2Q23 earnings and filed their 10Qs, we present fundamental data across the sector, in chart form.
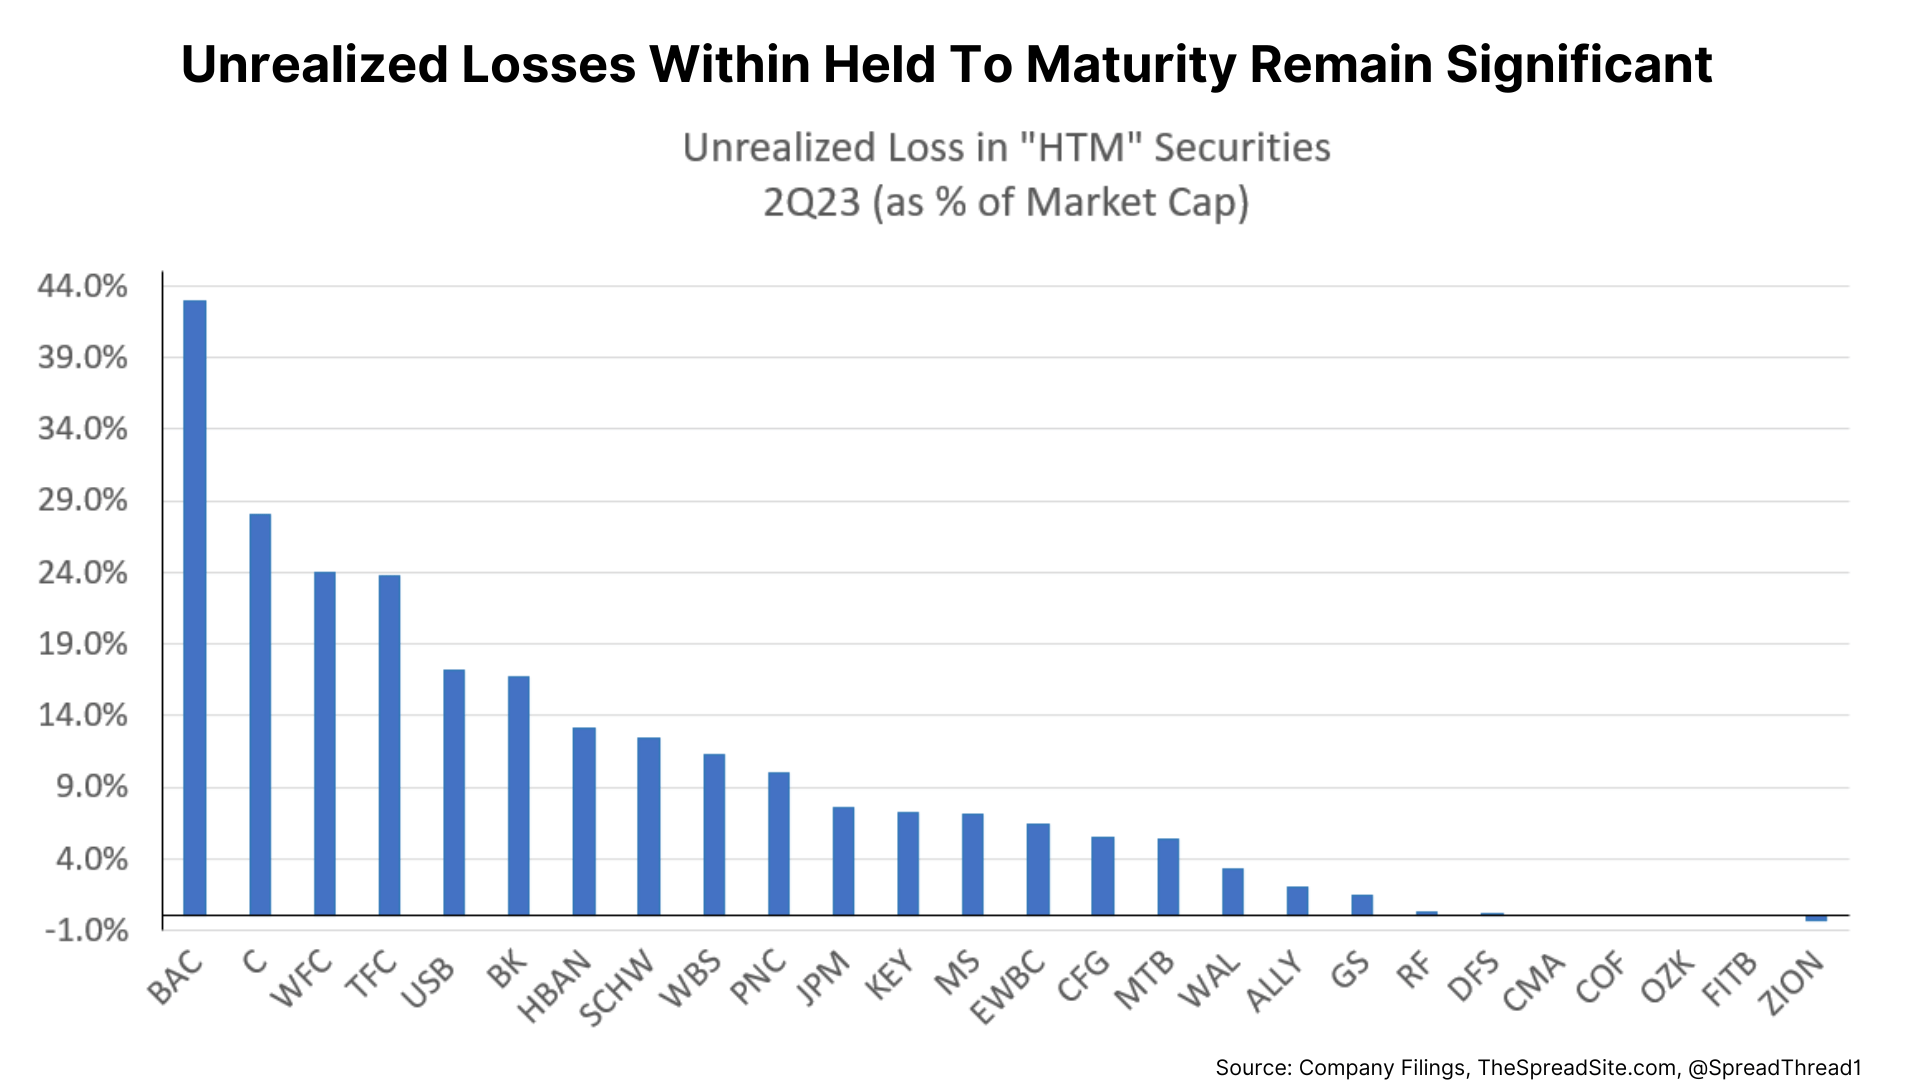
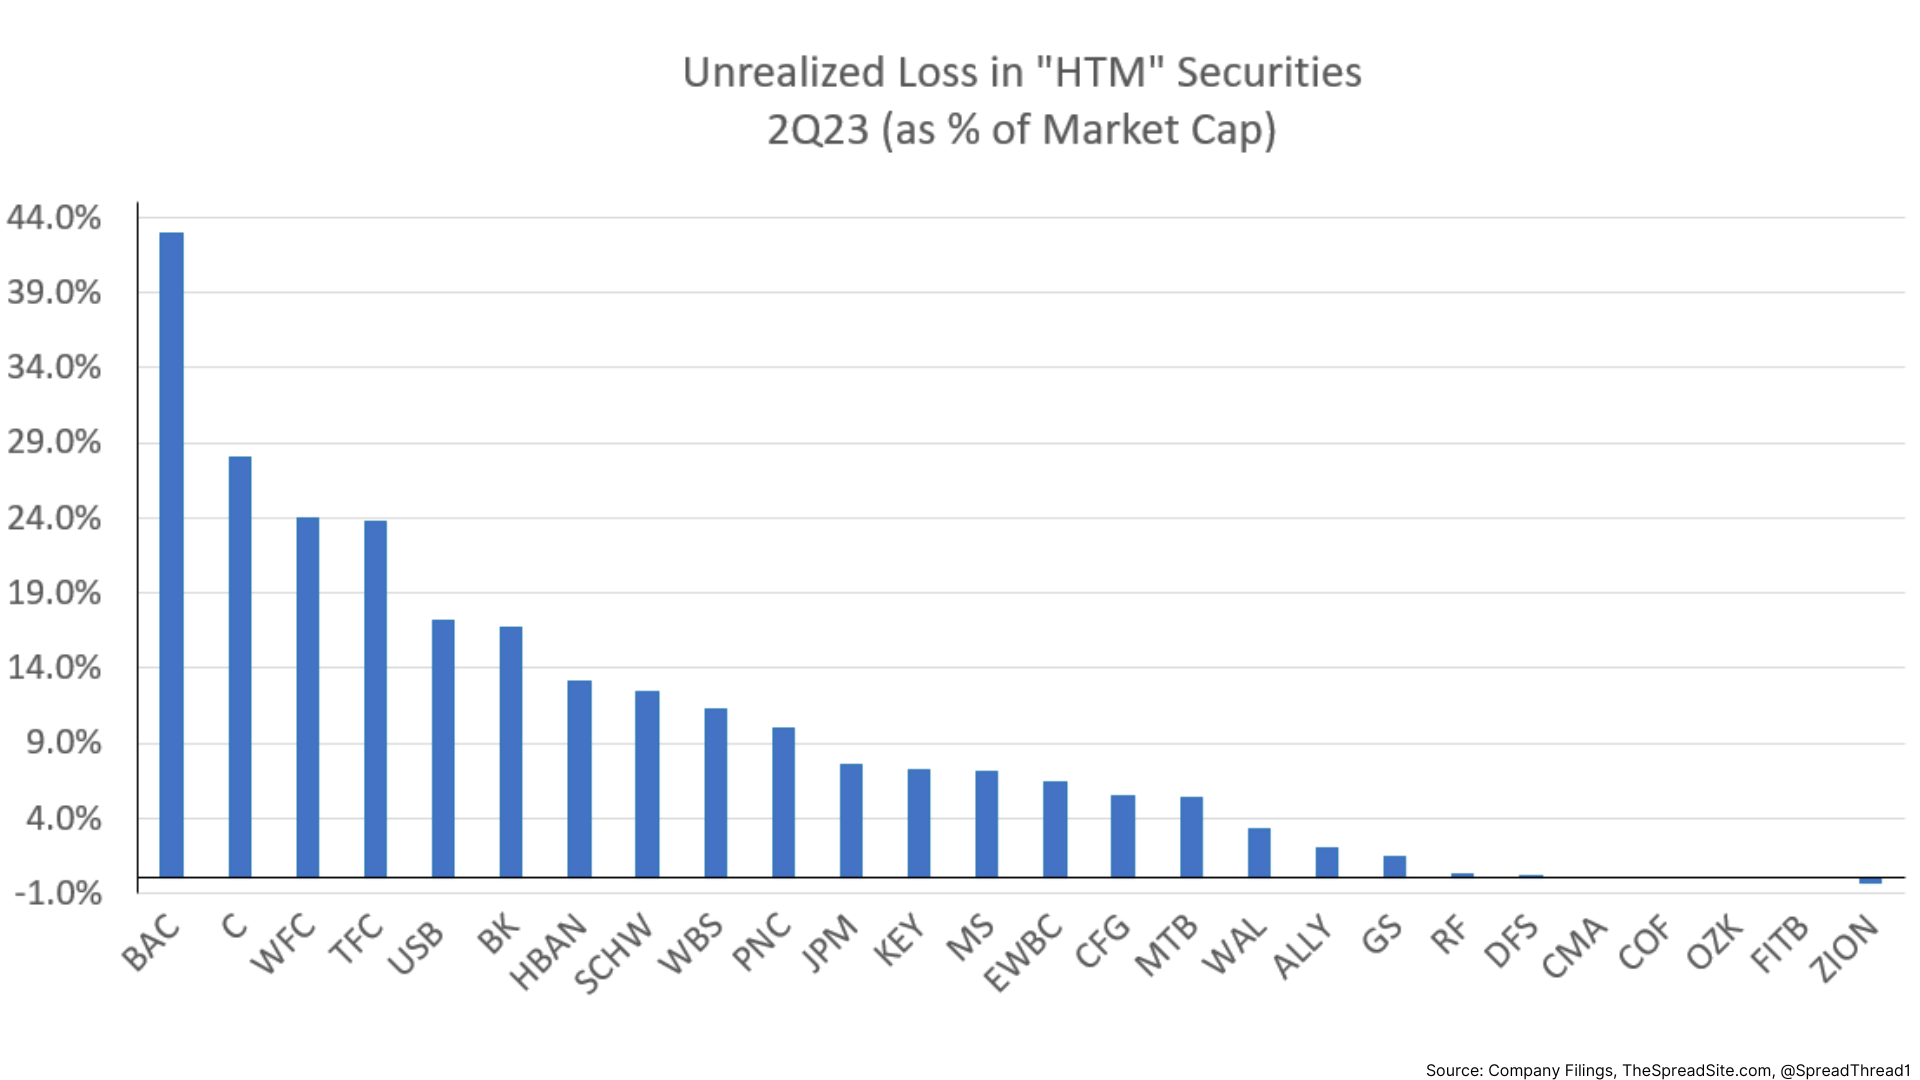
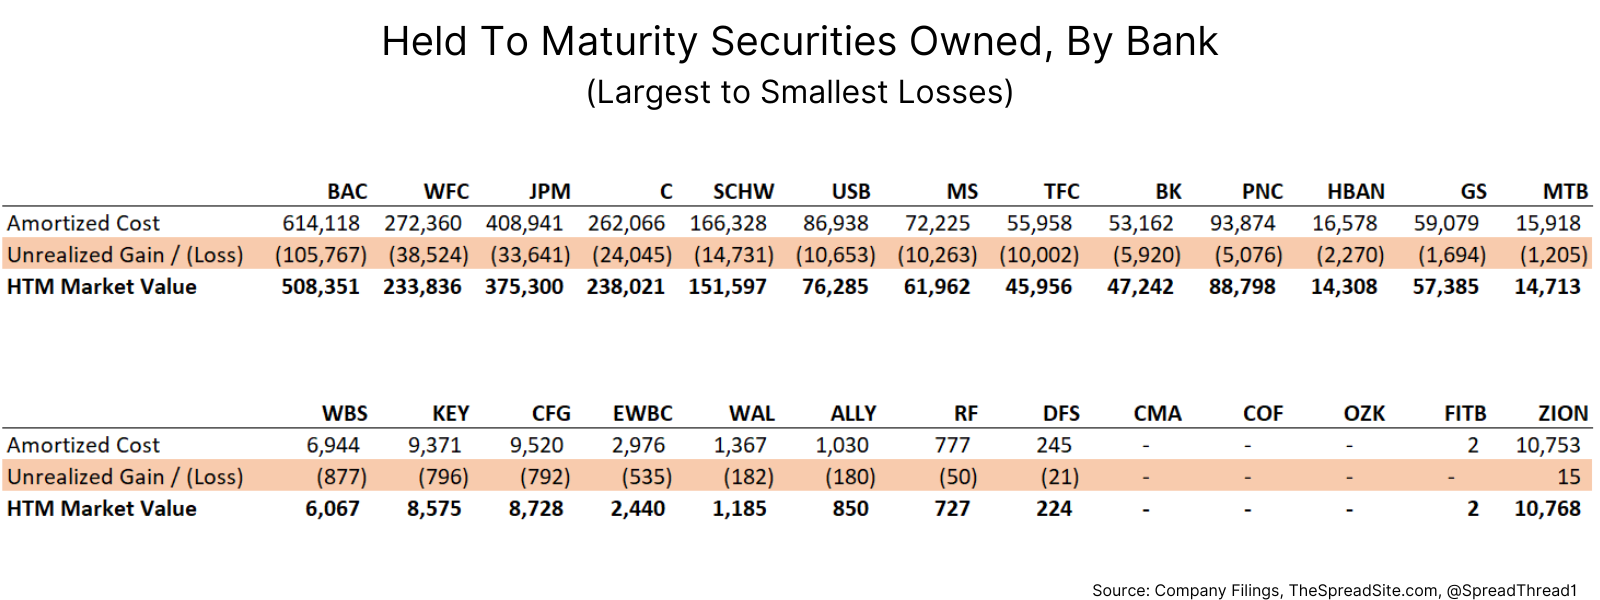
Held To Maturity ("HTM") Securities
Starting with HTM portfolios, we note that since 6/30/23 (for most banks, this is their period end date), 10Y Treasury yields have risen by 33bp, further reducing the value of HTM portfolios. However, the table below is where we stood as of 2Q23.
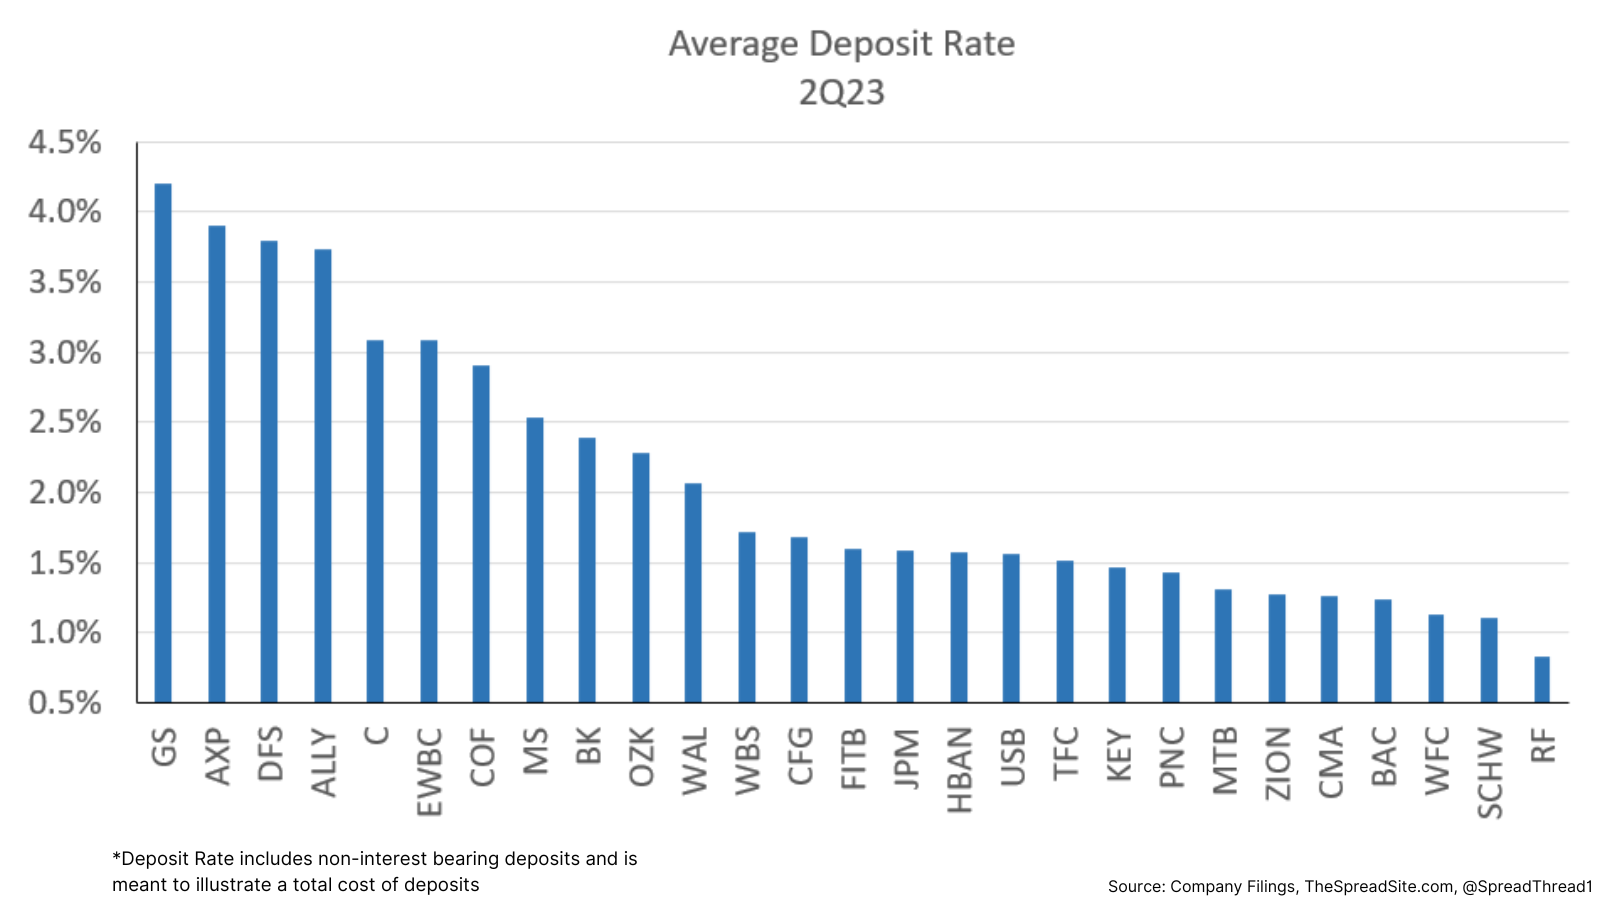
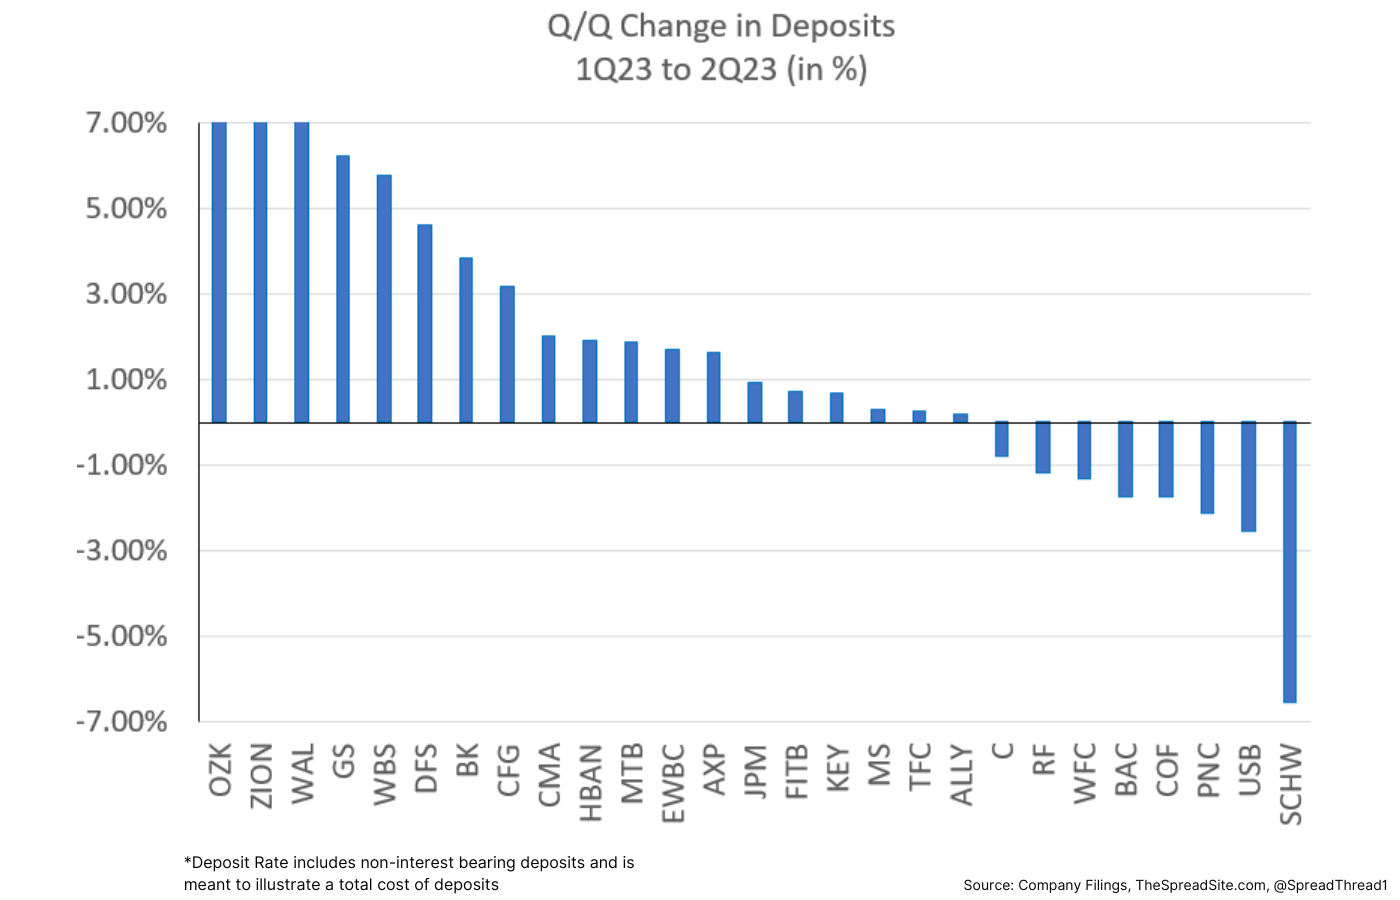
Deposit Data
We show average deposit rates at quarter end and the Q/Q change.
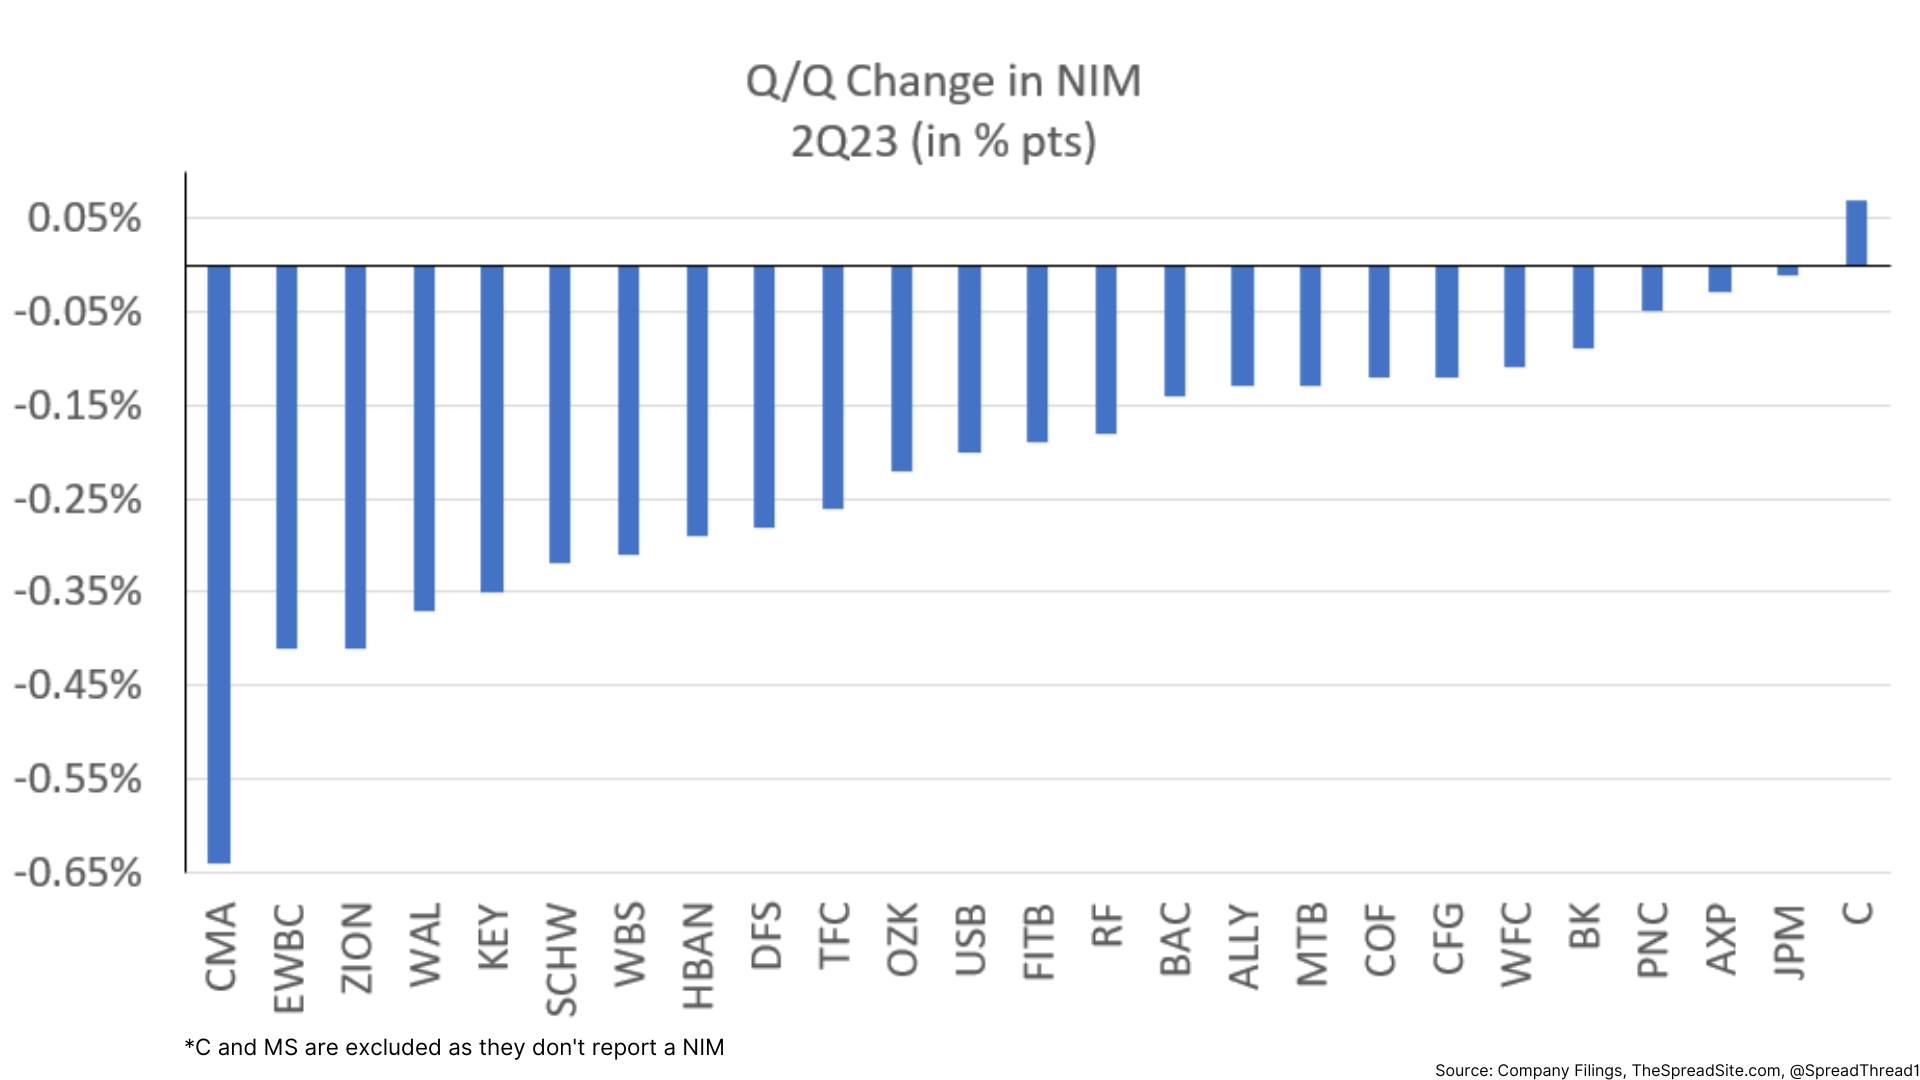
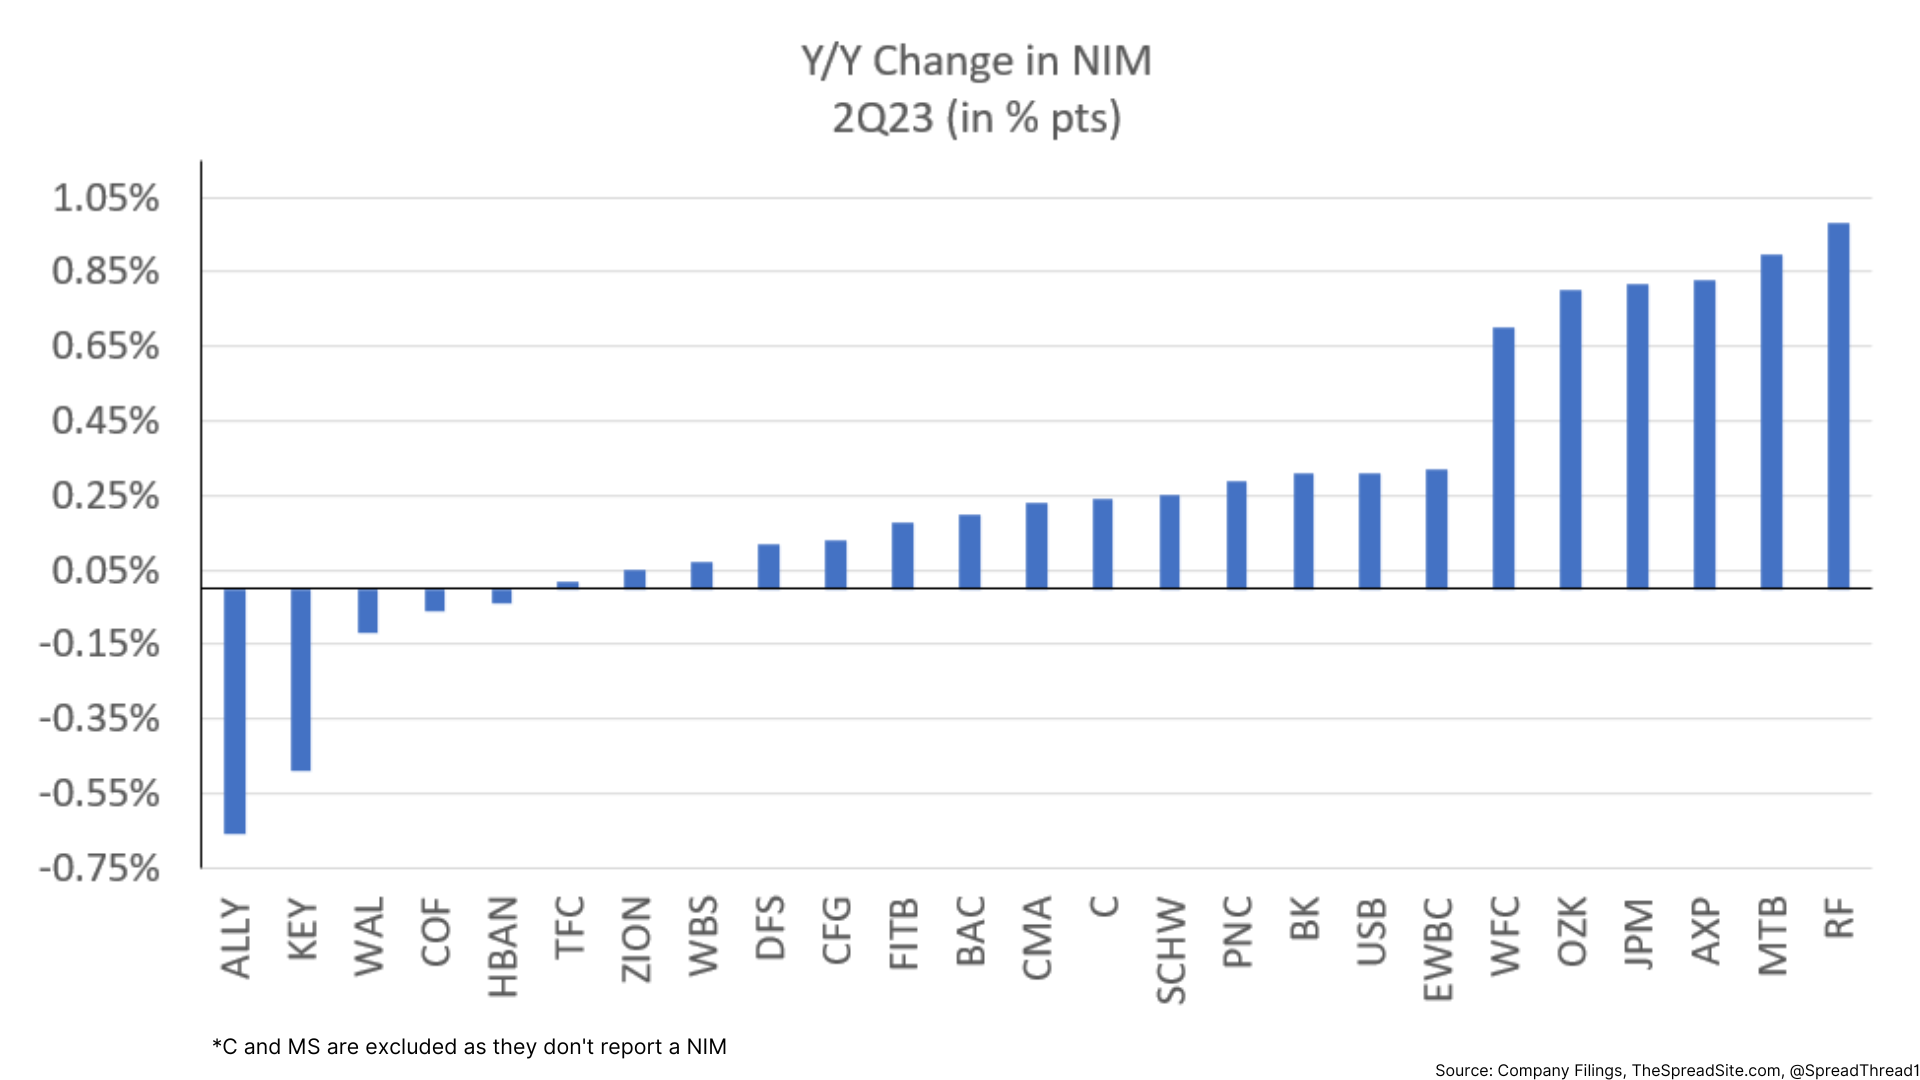
Net Interest Margin ("NIM")
On a Q/Q basis, higher deposit rates do appear to be impacting NIM (among other factors). We show a change in NIM on a Q/Q and Y/Y basis.
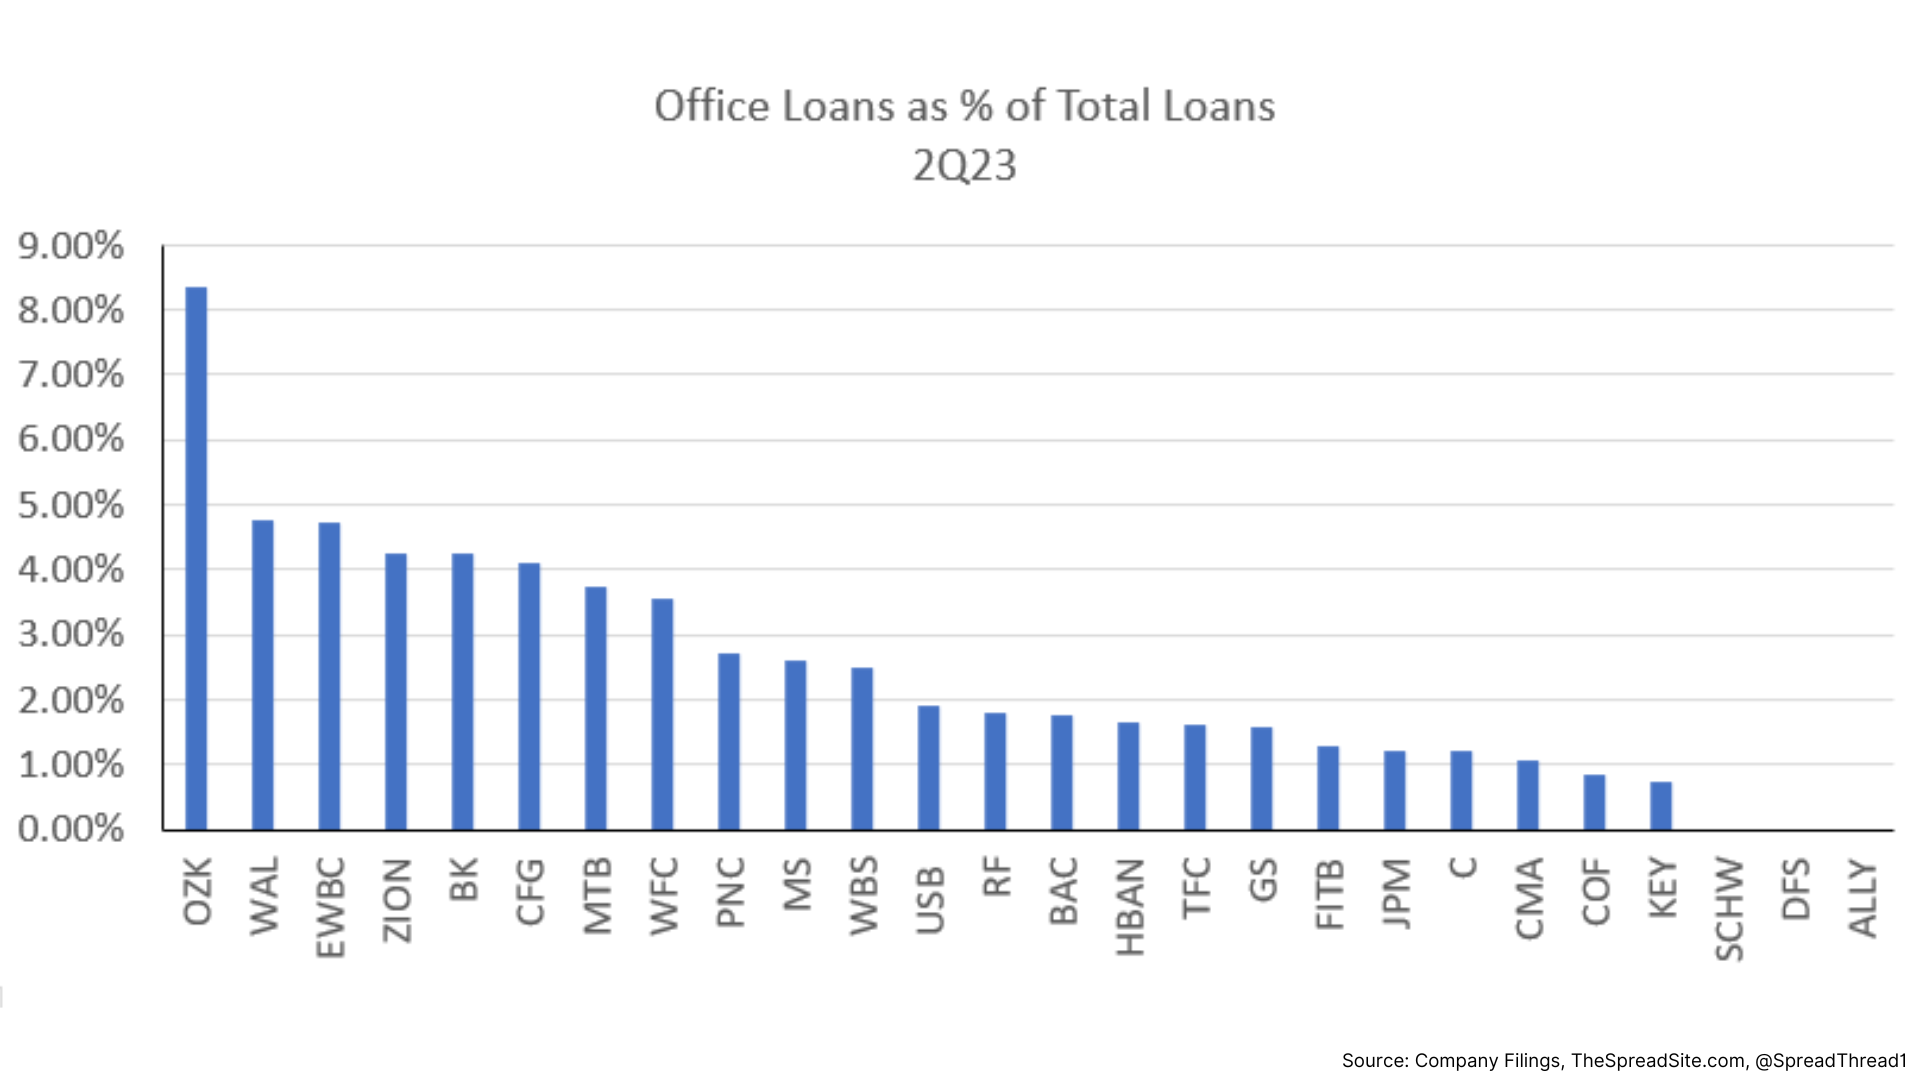
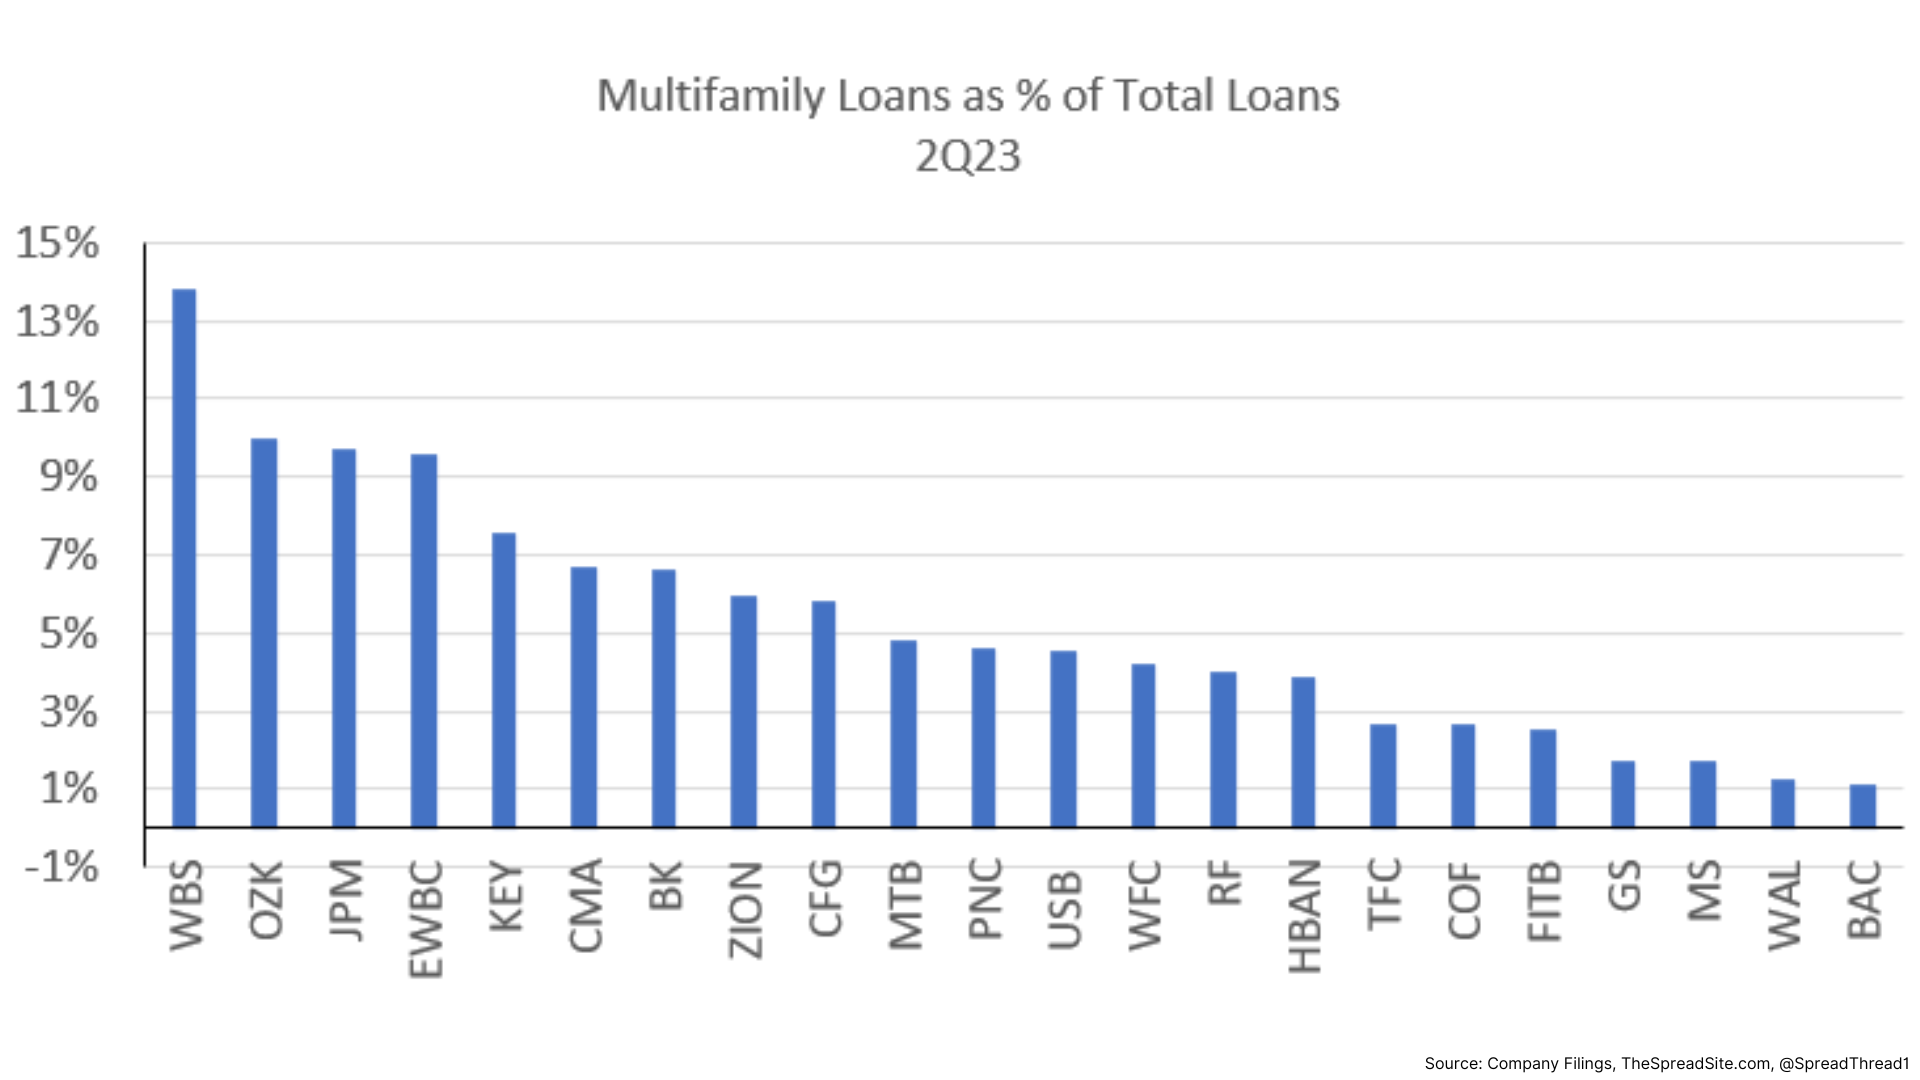
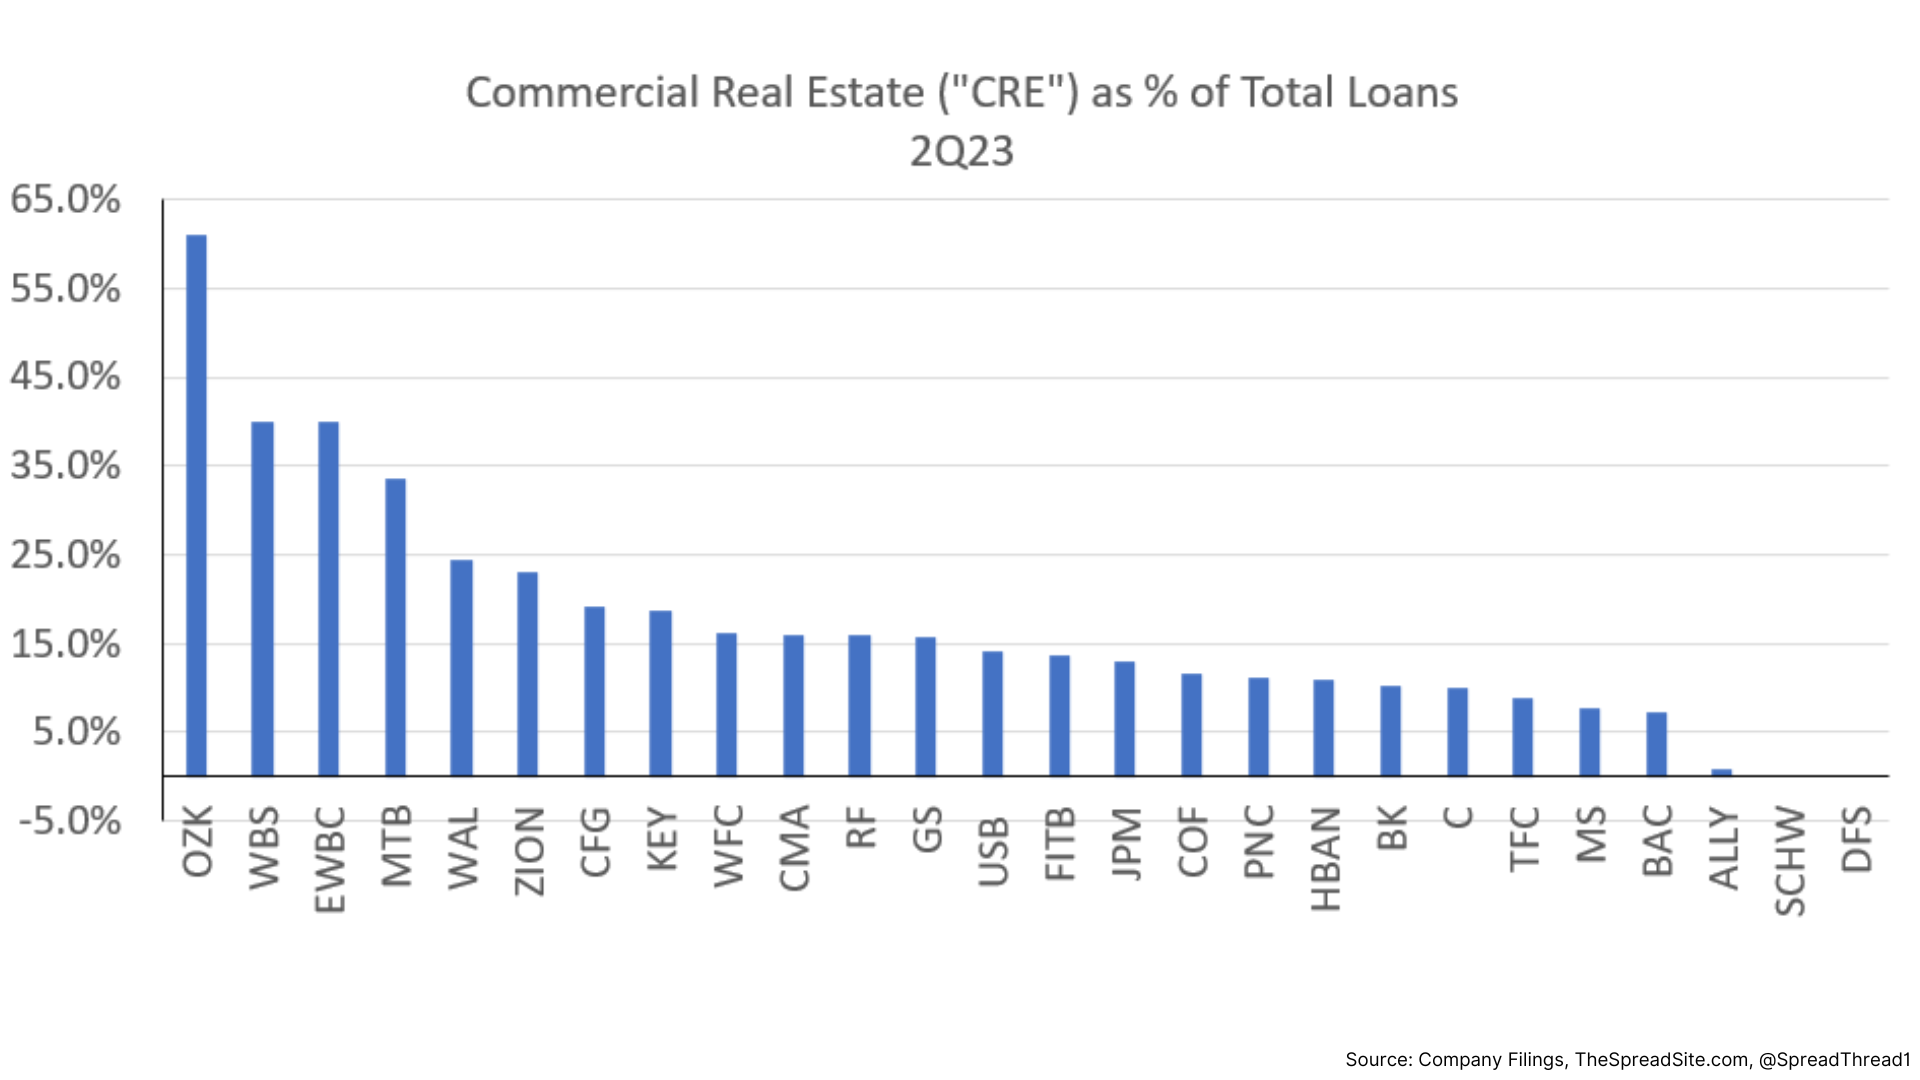
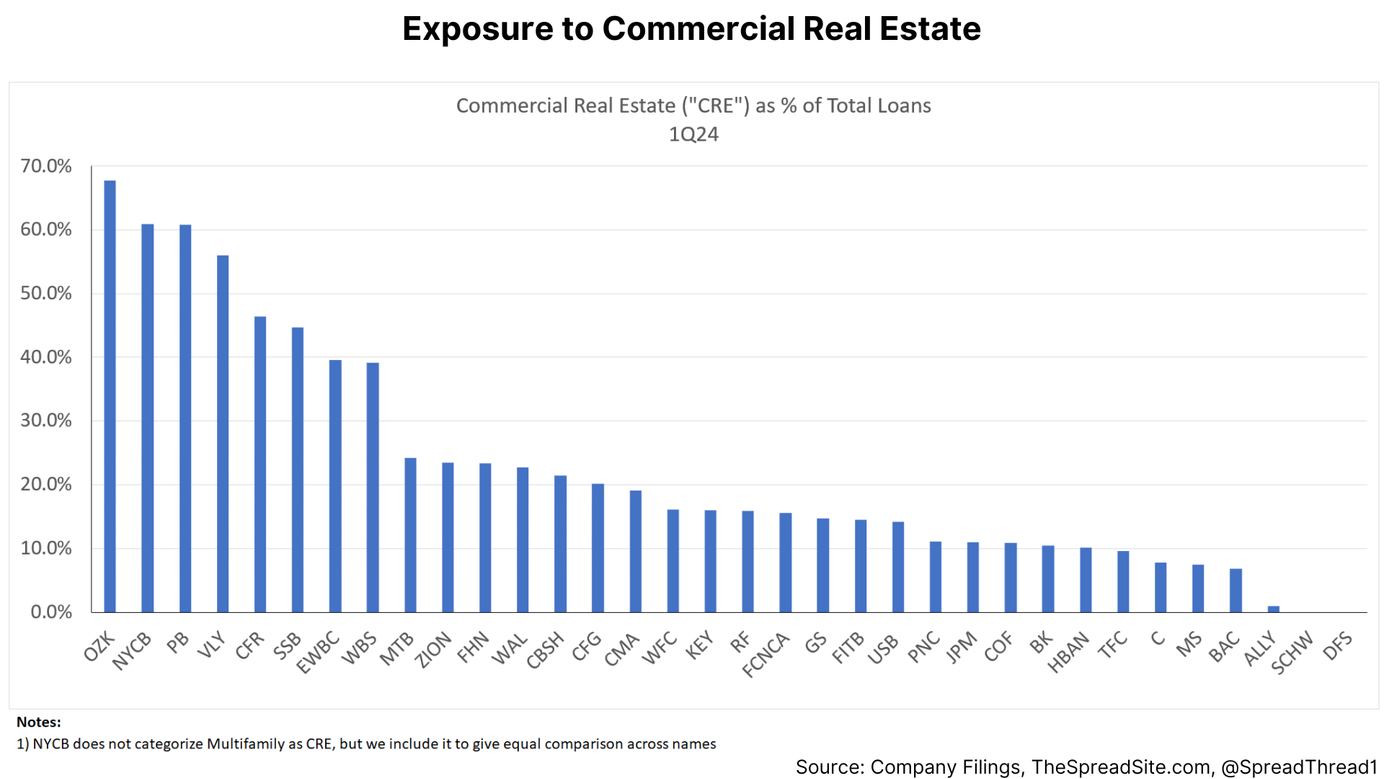
Loan Exposure By Category
We also look at a breakdown of loan portfolio concentrations, specifically within office, multifamily and commercial real estate ("CRE").
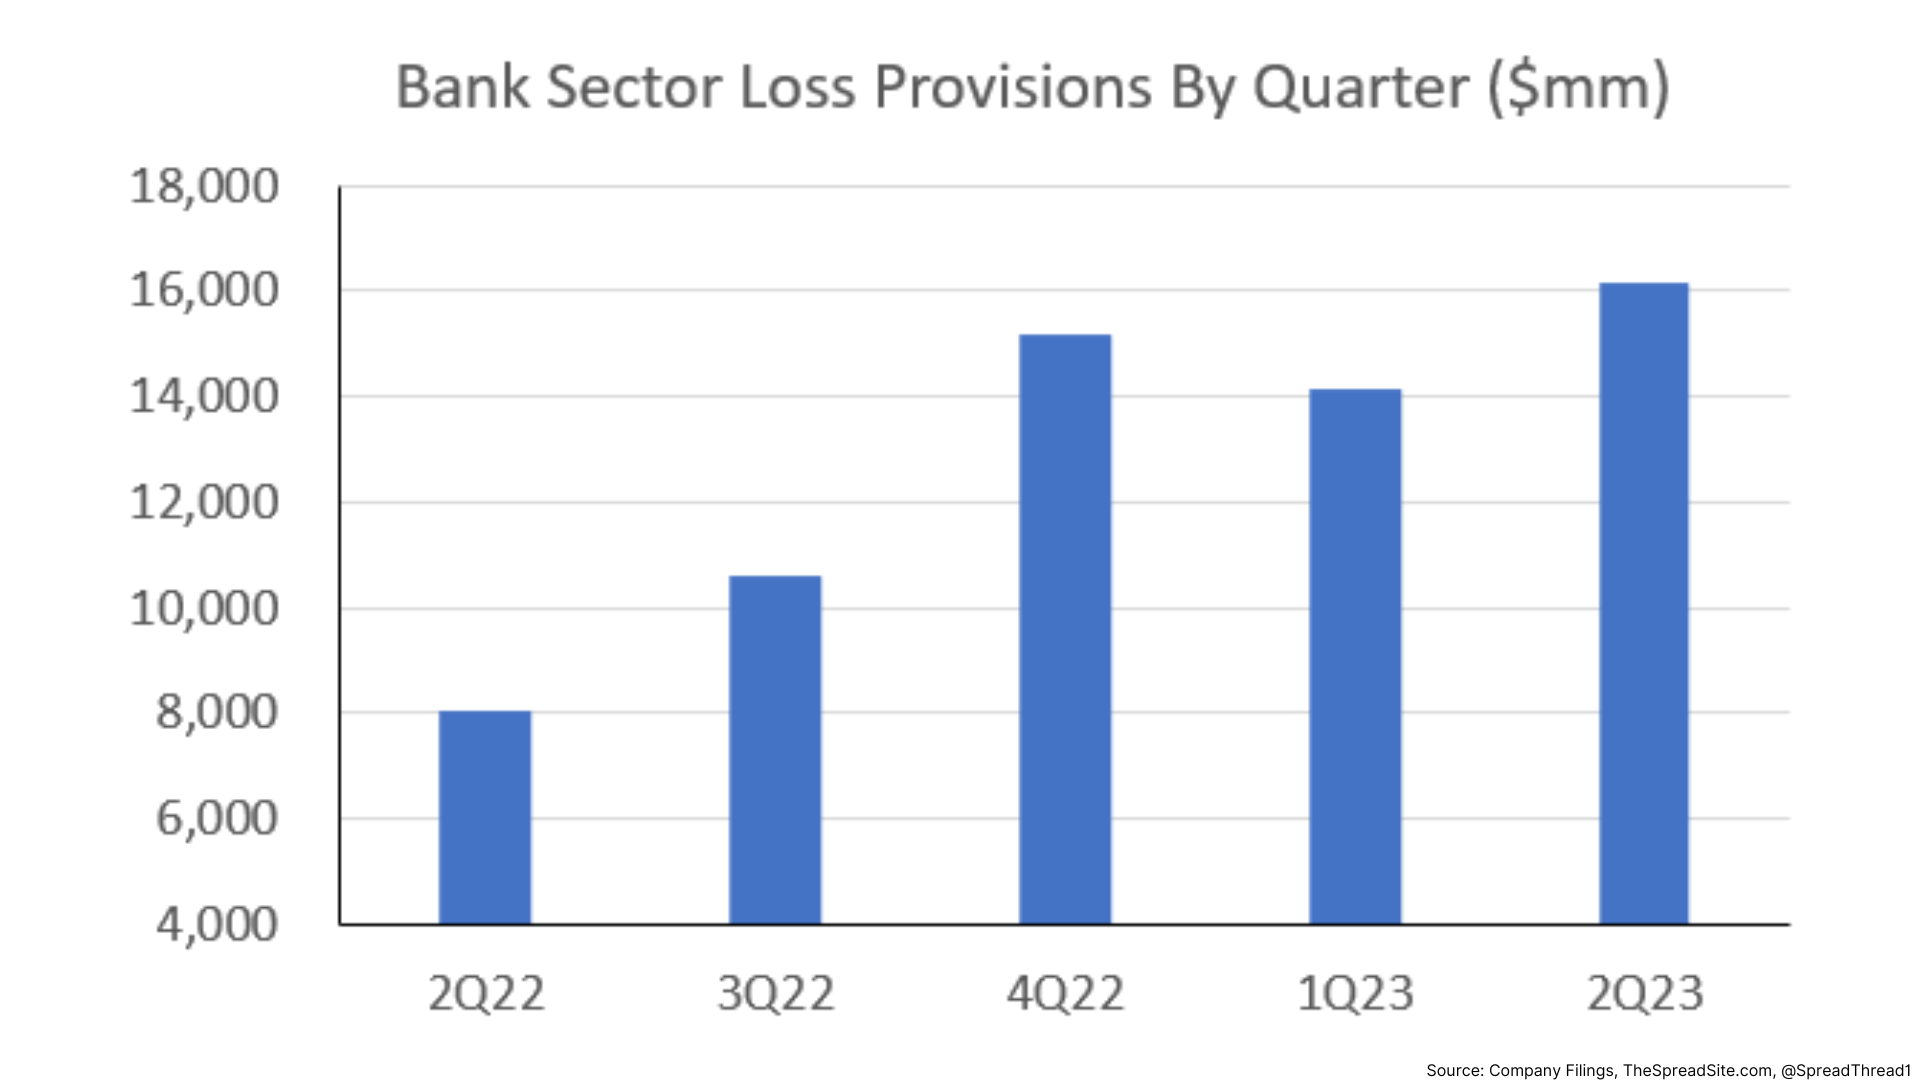
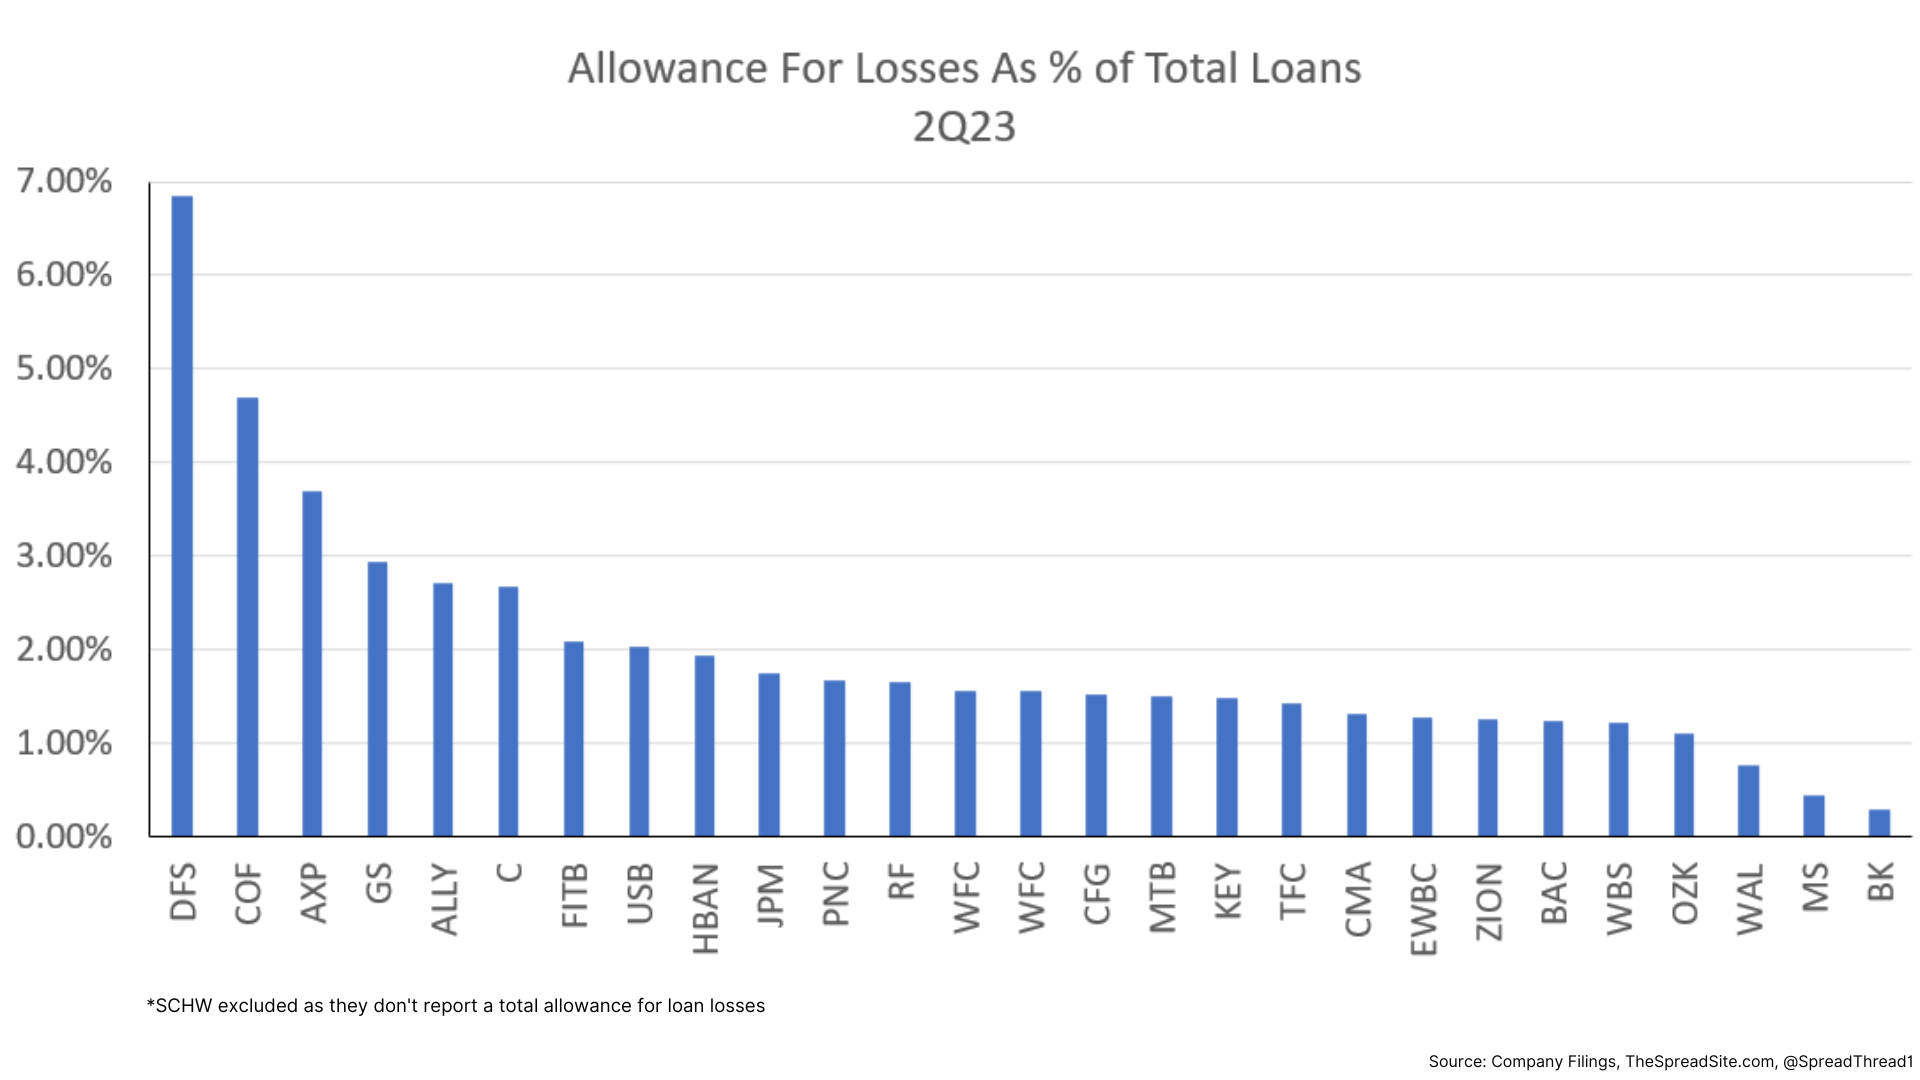
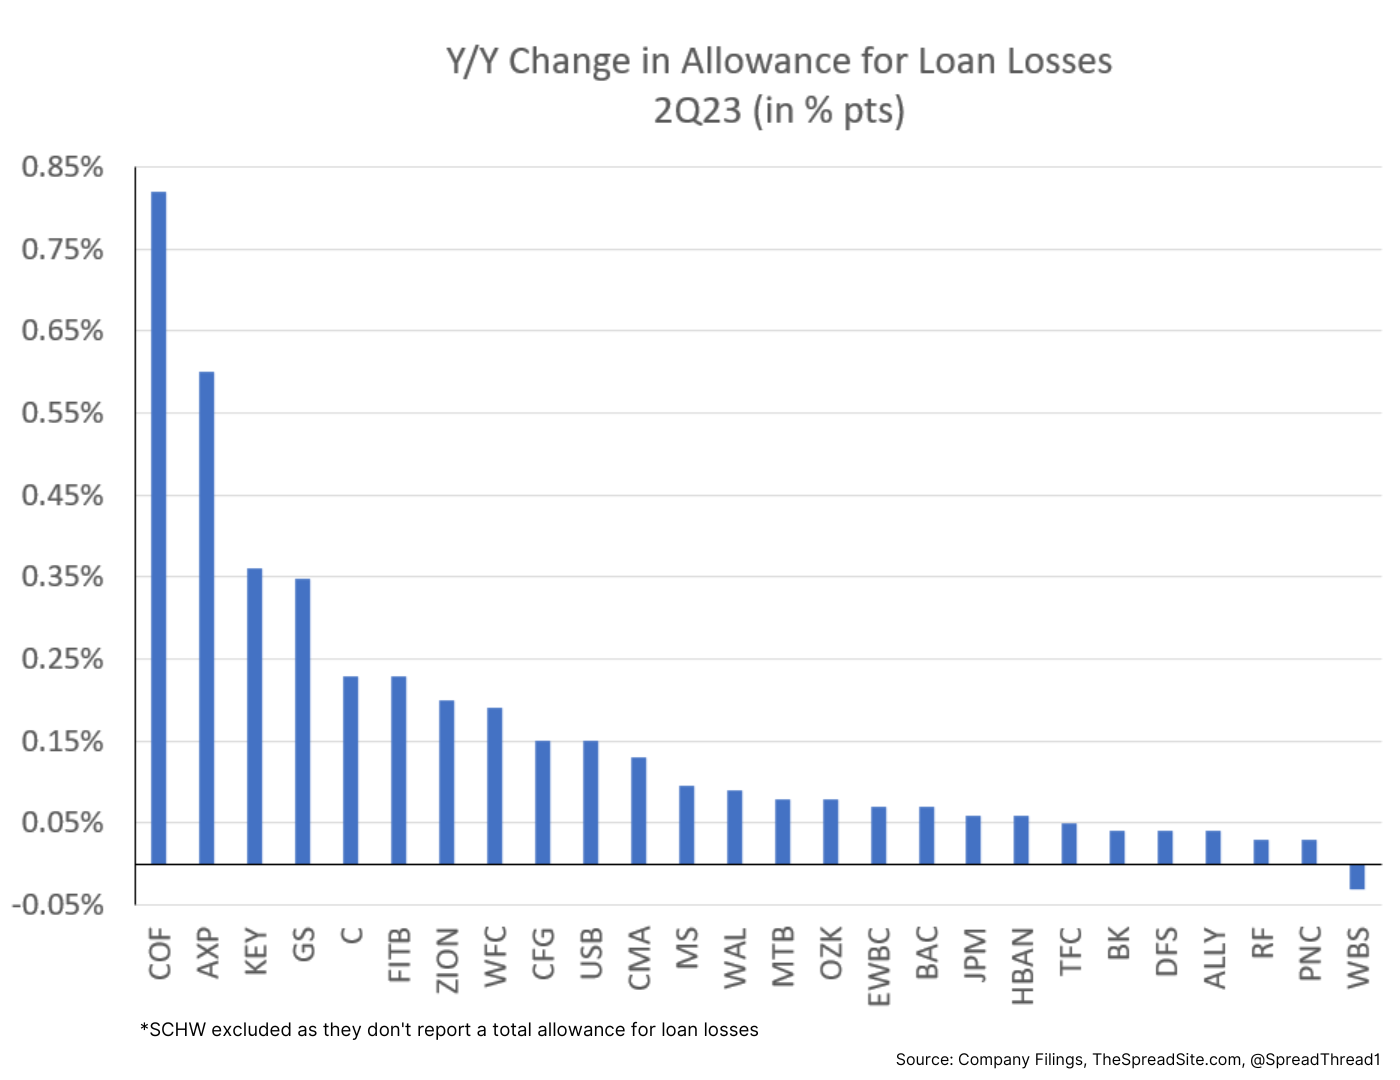
Loss Provisions & Allowances
We show a sum of all loss provisions taken by quarter, the total allowance taken by bank, and the Y/Y change in the total allowance for loan losses.
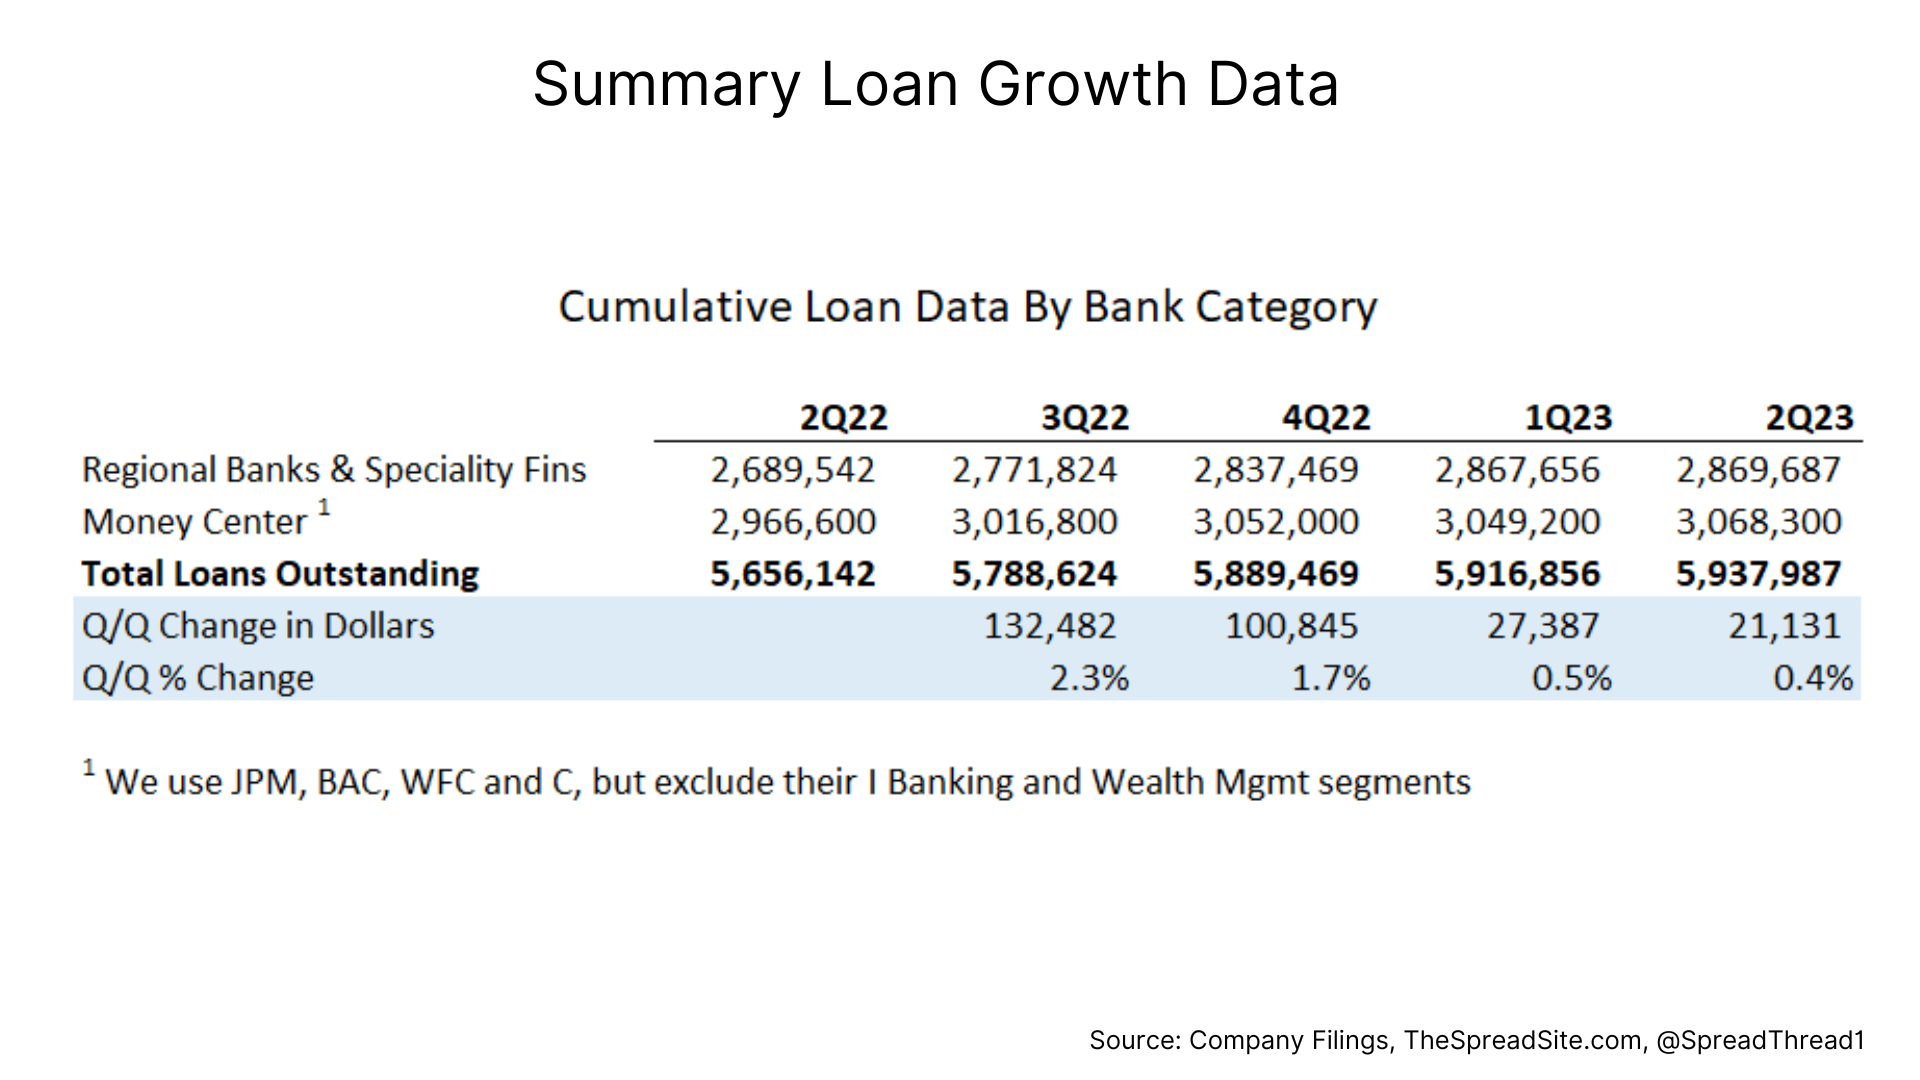
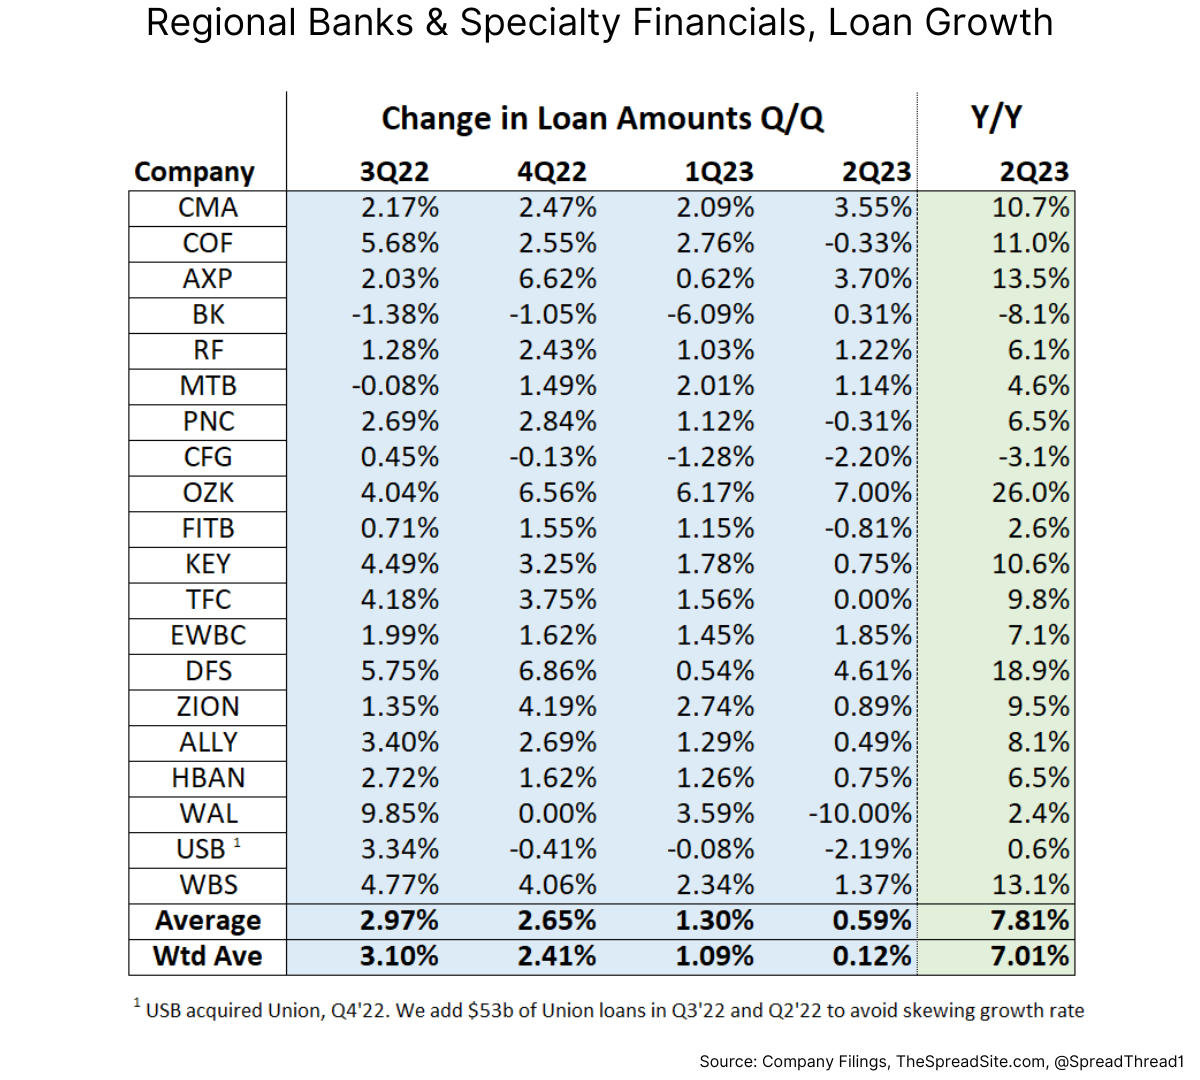
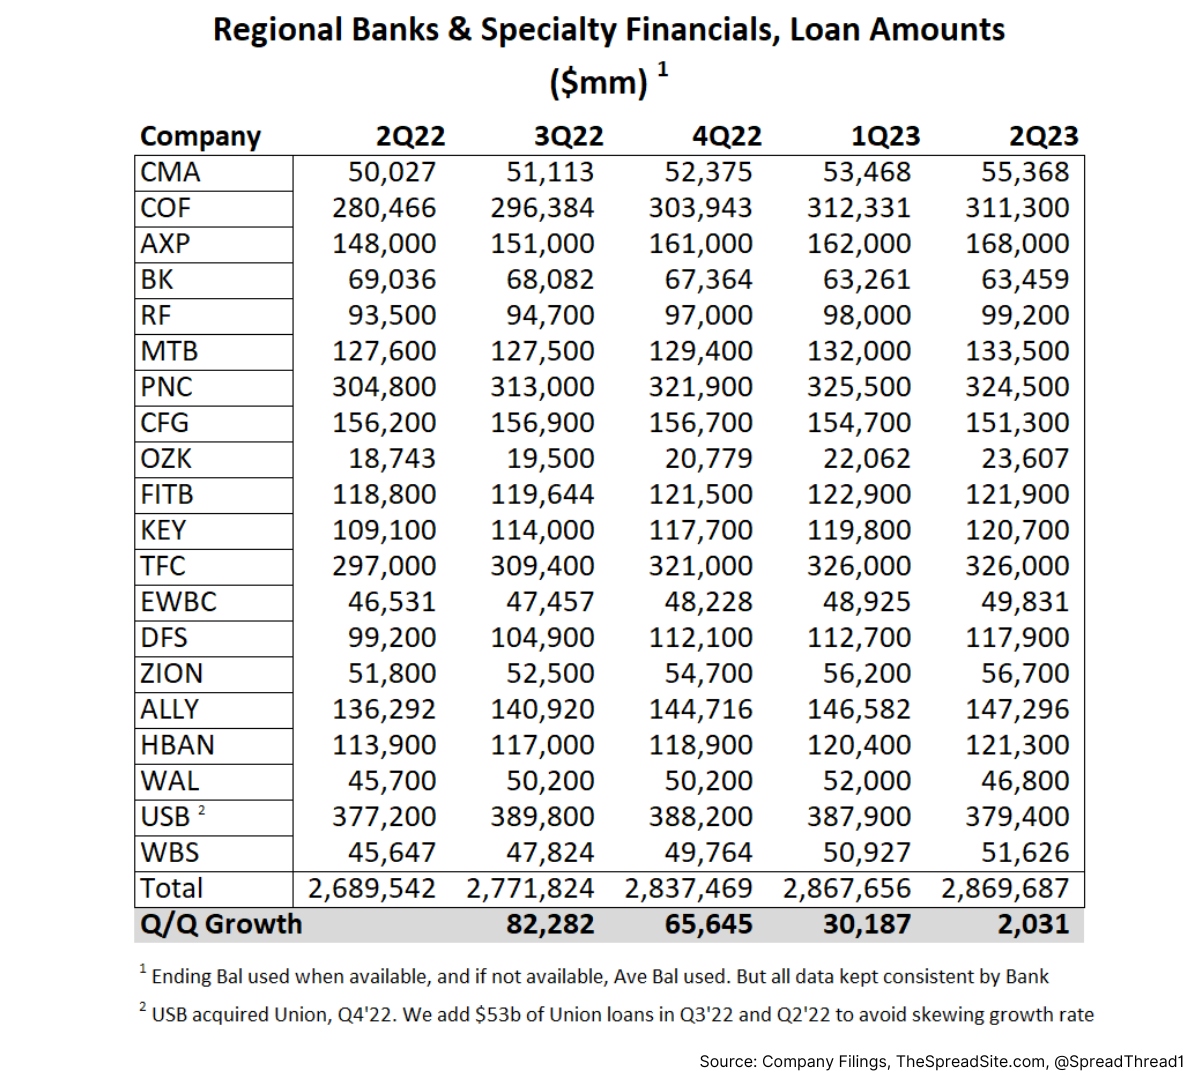
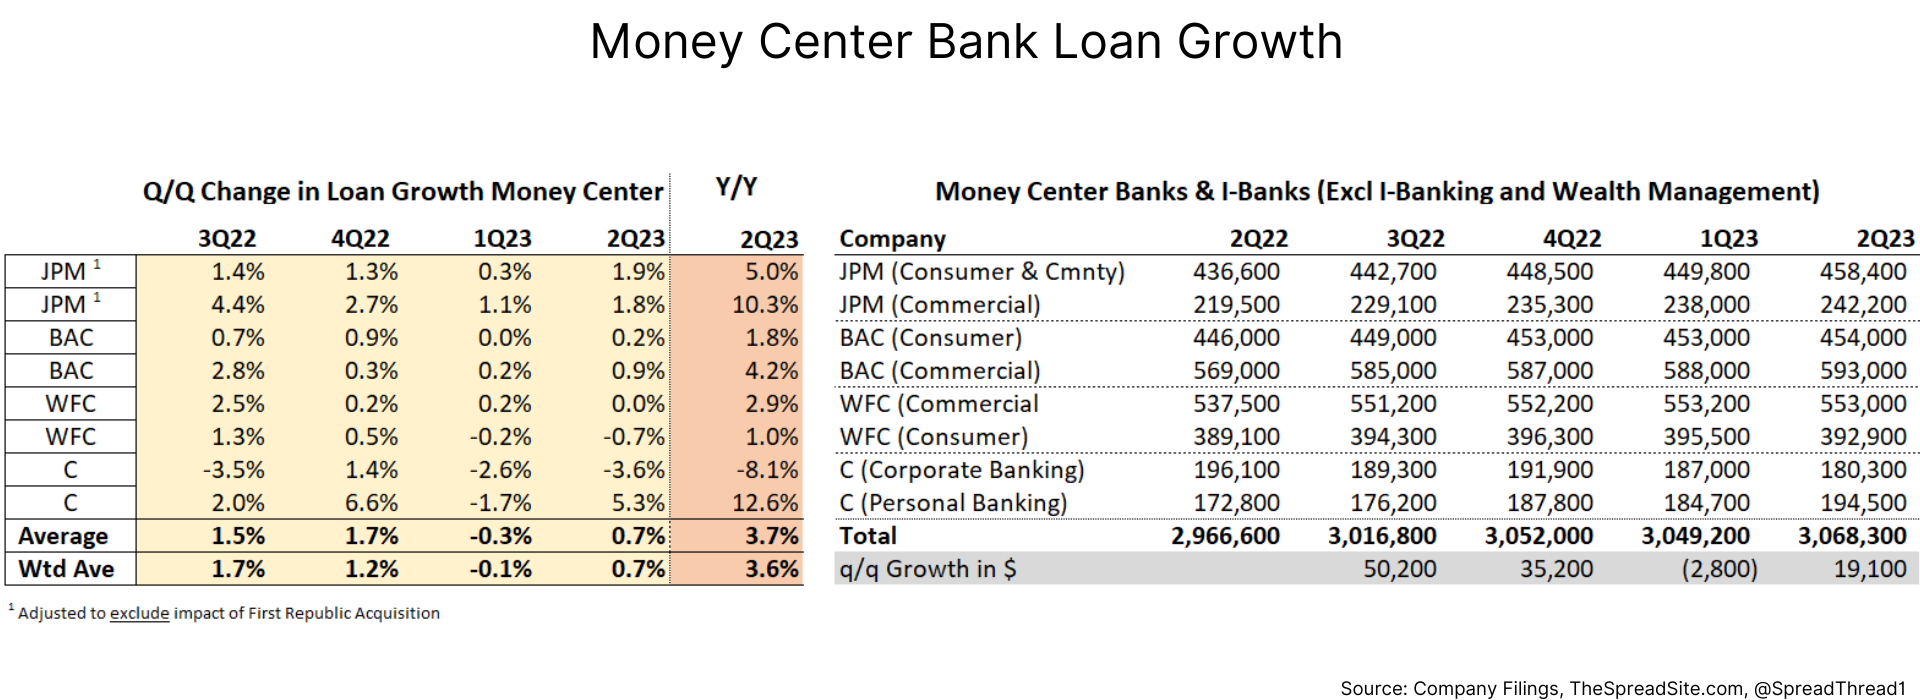
Loan Growth
And finally, a look at loan growth broken down by broad categories:
- regional banks + specialty lenders
- money center banks
Disclosures
Please click here to see our standard legal disclosures
The Spread Site Research
Receive our latest publications directly to your inbox. Its Free!.


