Bank Stocks, Charts & Data: 3Q23
The Banking Sector In Charts
We are through 3Q23 earnings and all companies have filed their 10Qs. We present fundamental data across the sector, in chart form.
Our method, generally speaking, is to include all banks in the "KRE" Regional Bank ETF greater than ~$5b of market cap and all banks in the "KBE" Bank ETF greater than ~$10b of market cap.
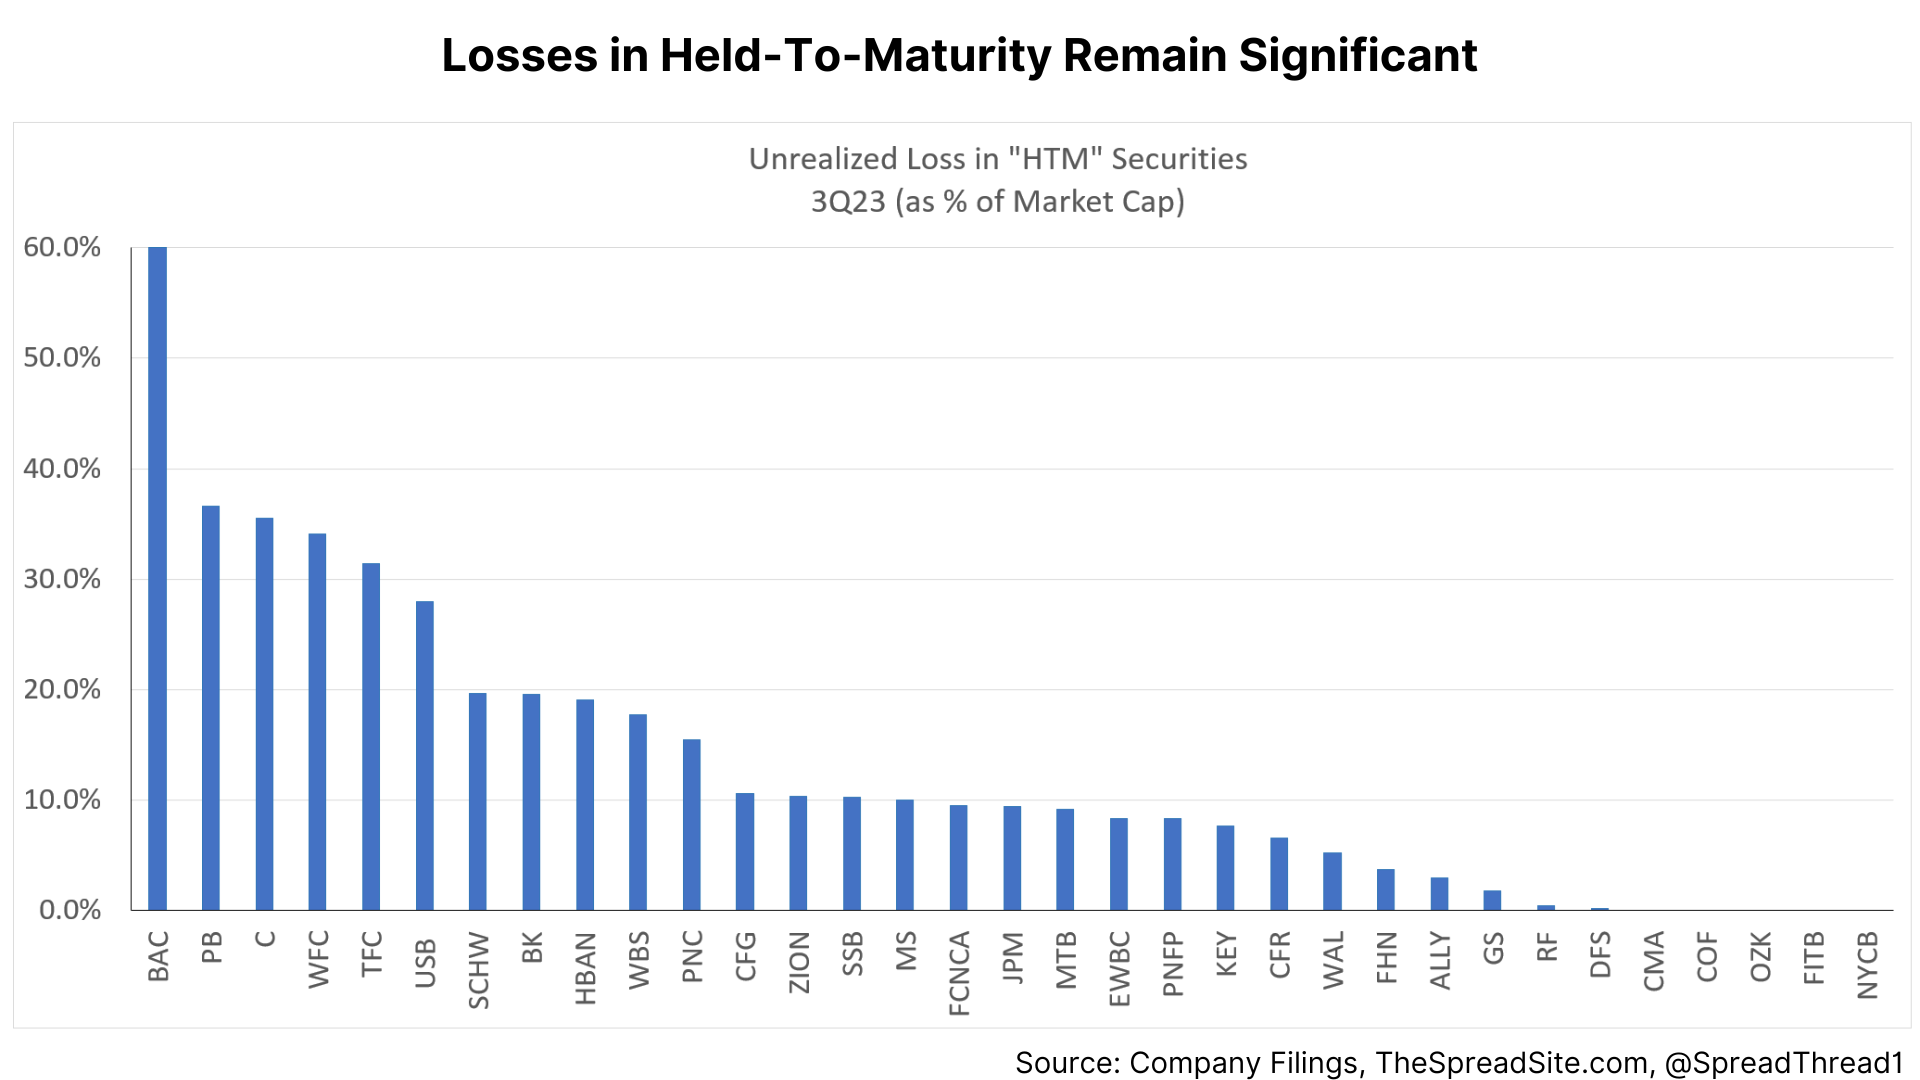
Held-To-Maturity ("HTM") Securities
At the end of 2Q23, 10Y Treasury yields were 3.84% and 30Y yields were 3.86%. At the end of 3Q23, 10Y Treasury yields were 4.57% and 30Y yields were 4.70%. The increase of 73bp and 84bp, respectively, further impacted HTM portfolios.
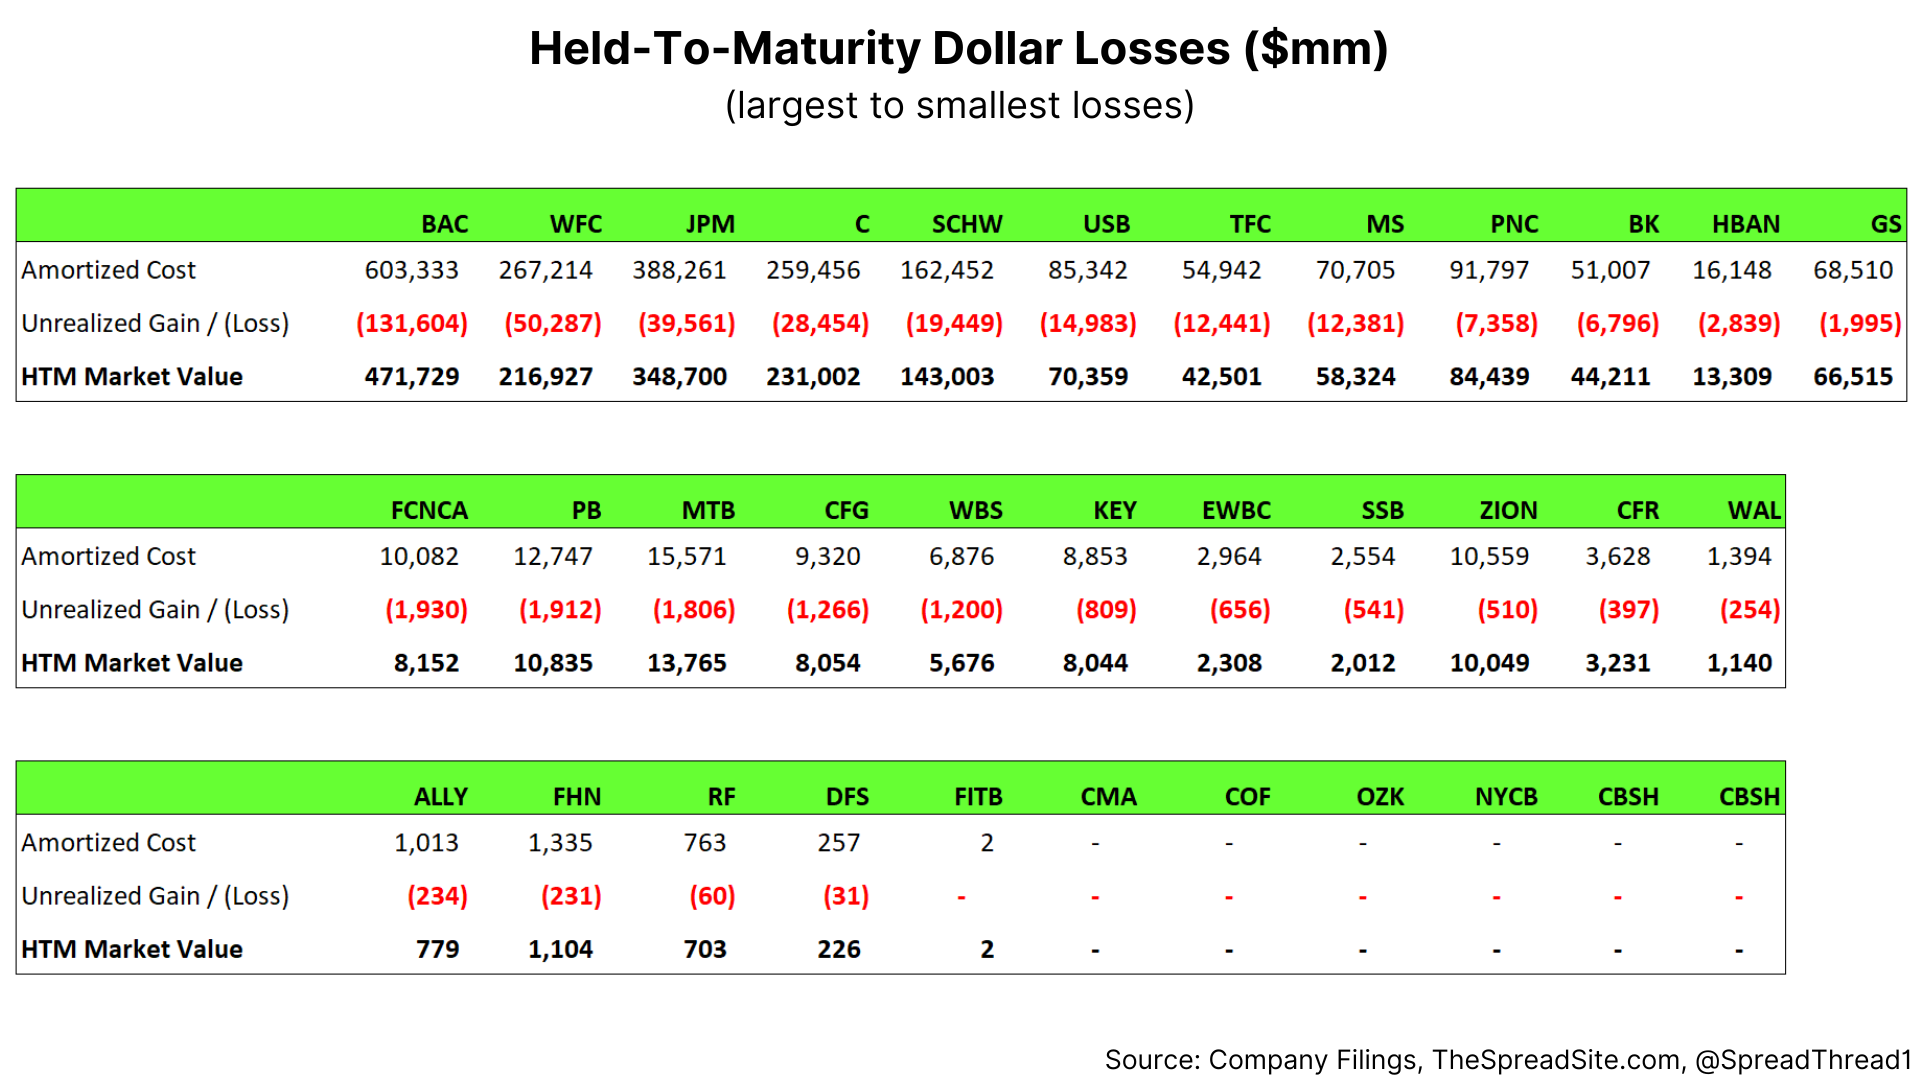
In terms of dollar figures, the unrealized HTM losses are as follows:
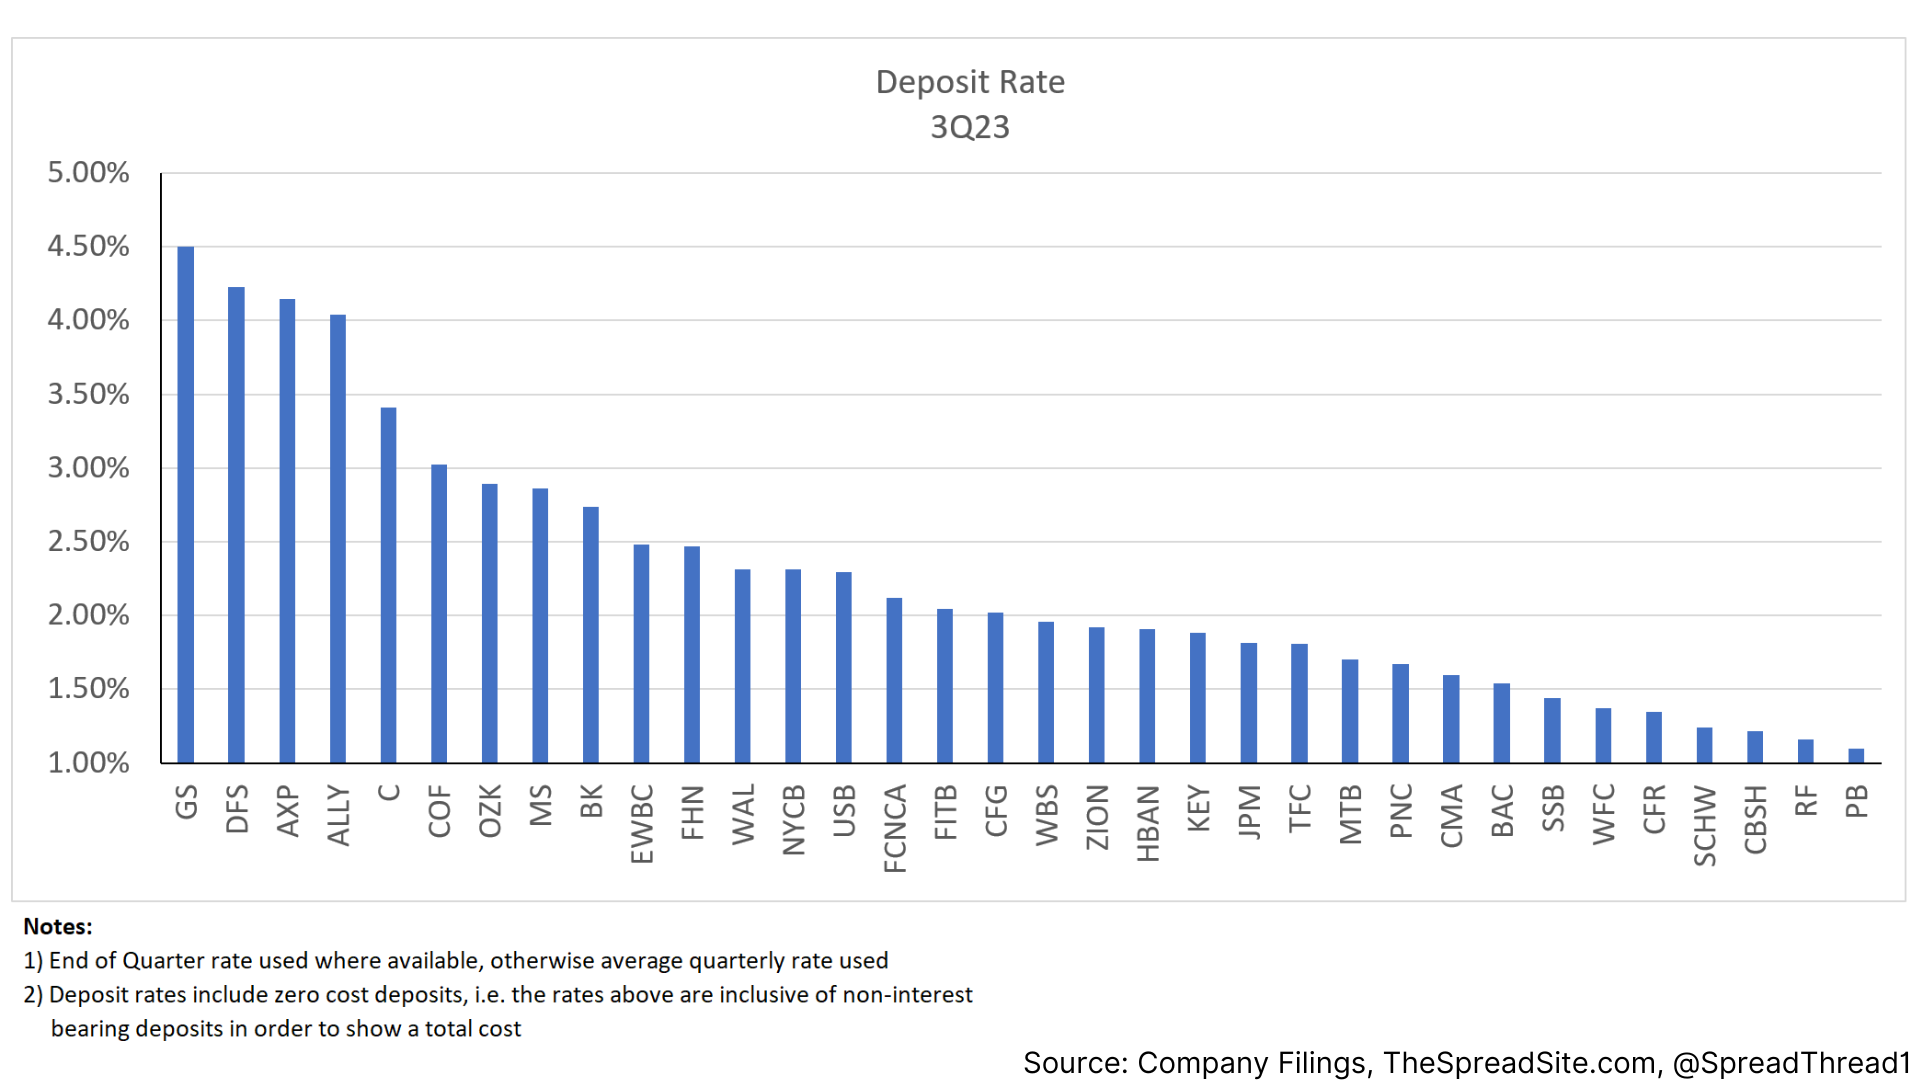
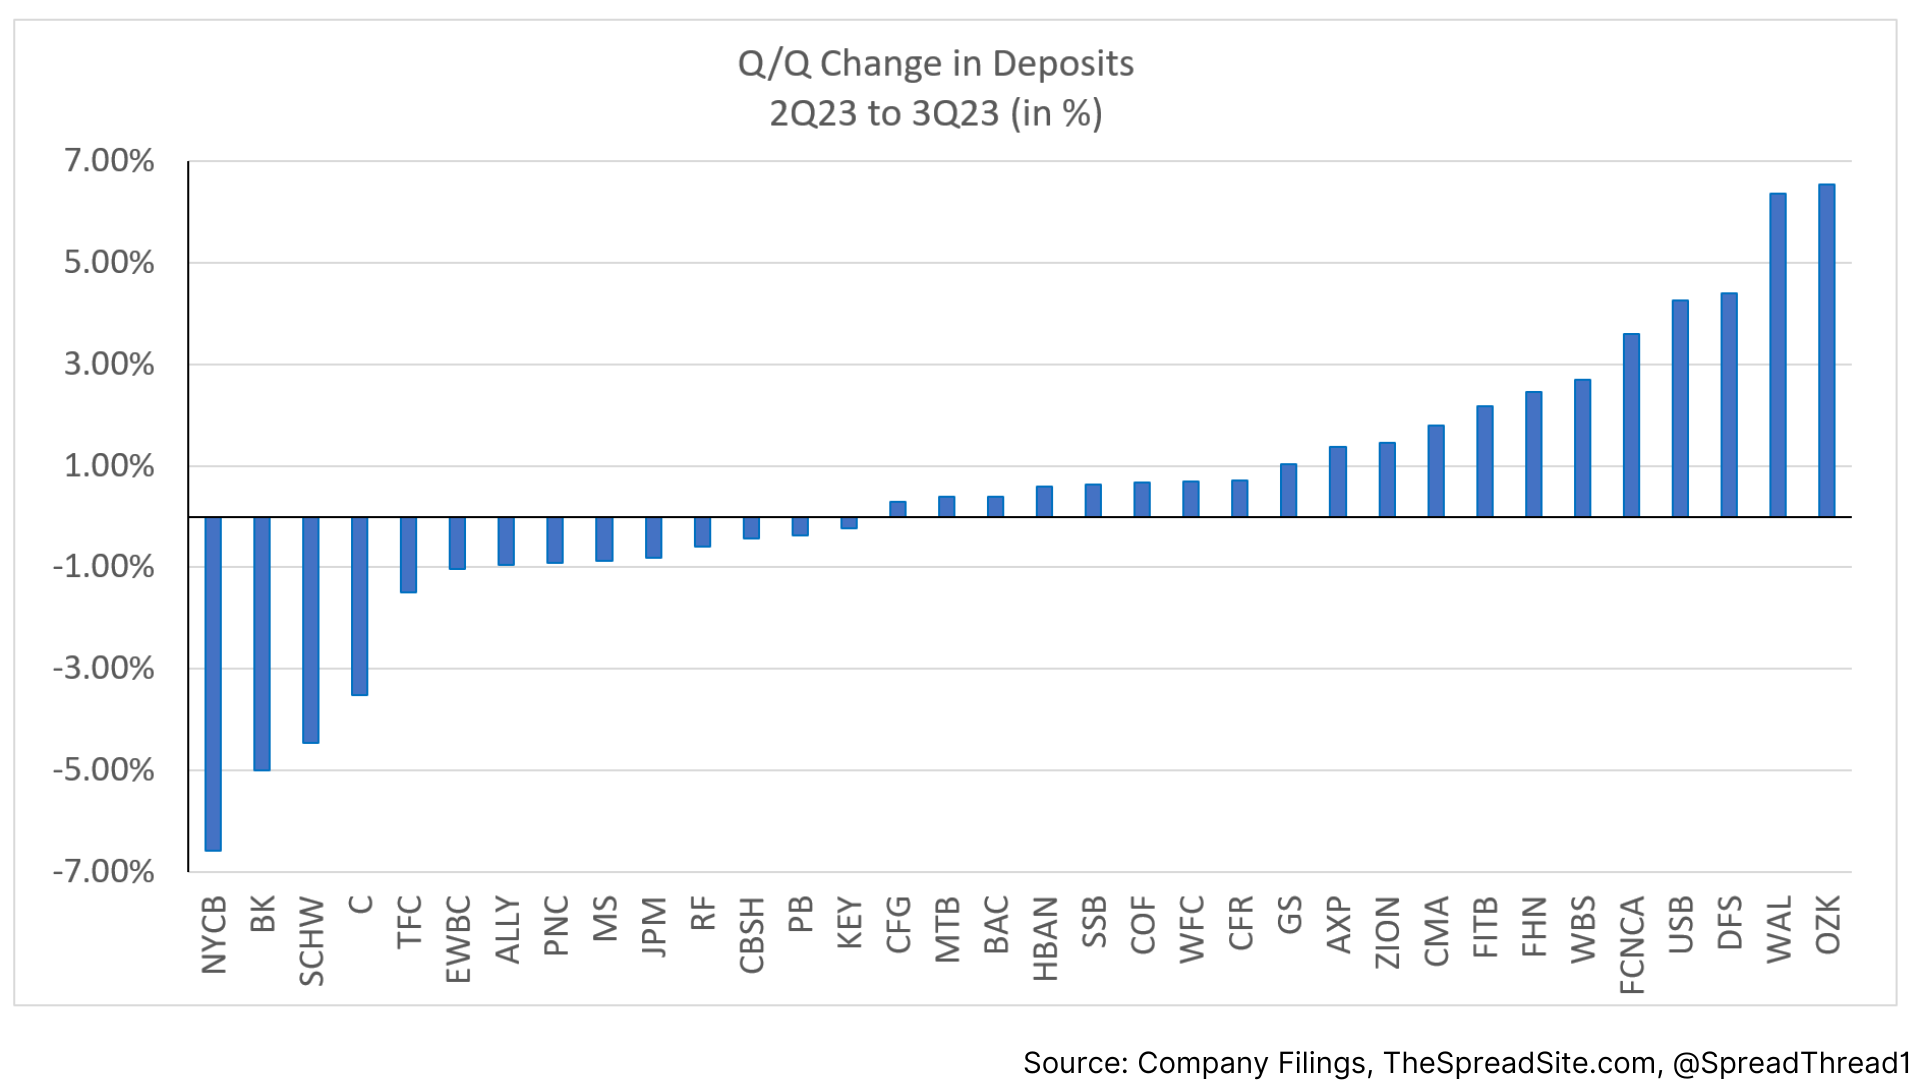
Deposit Data
We show deposit rates as of 3Q23 and the Q/Q change. We use end-of-period deposit rates where available and the average rate if the former isn't provided. We also note the deposit rate data includes zero cost deposits.
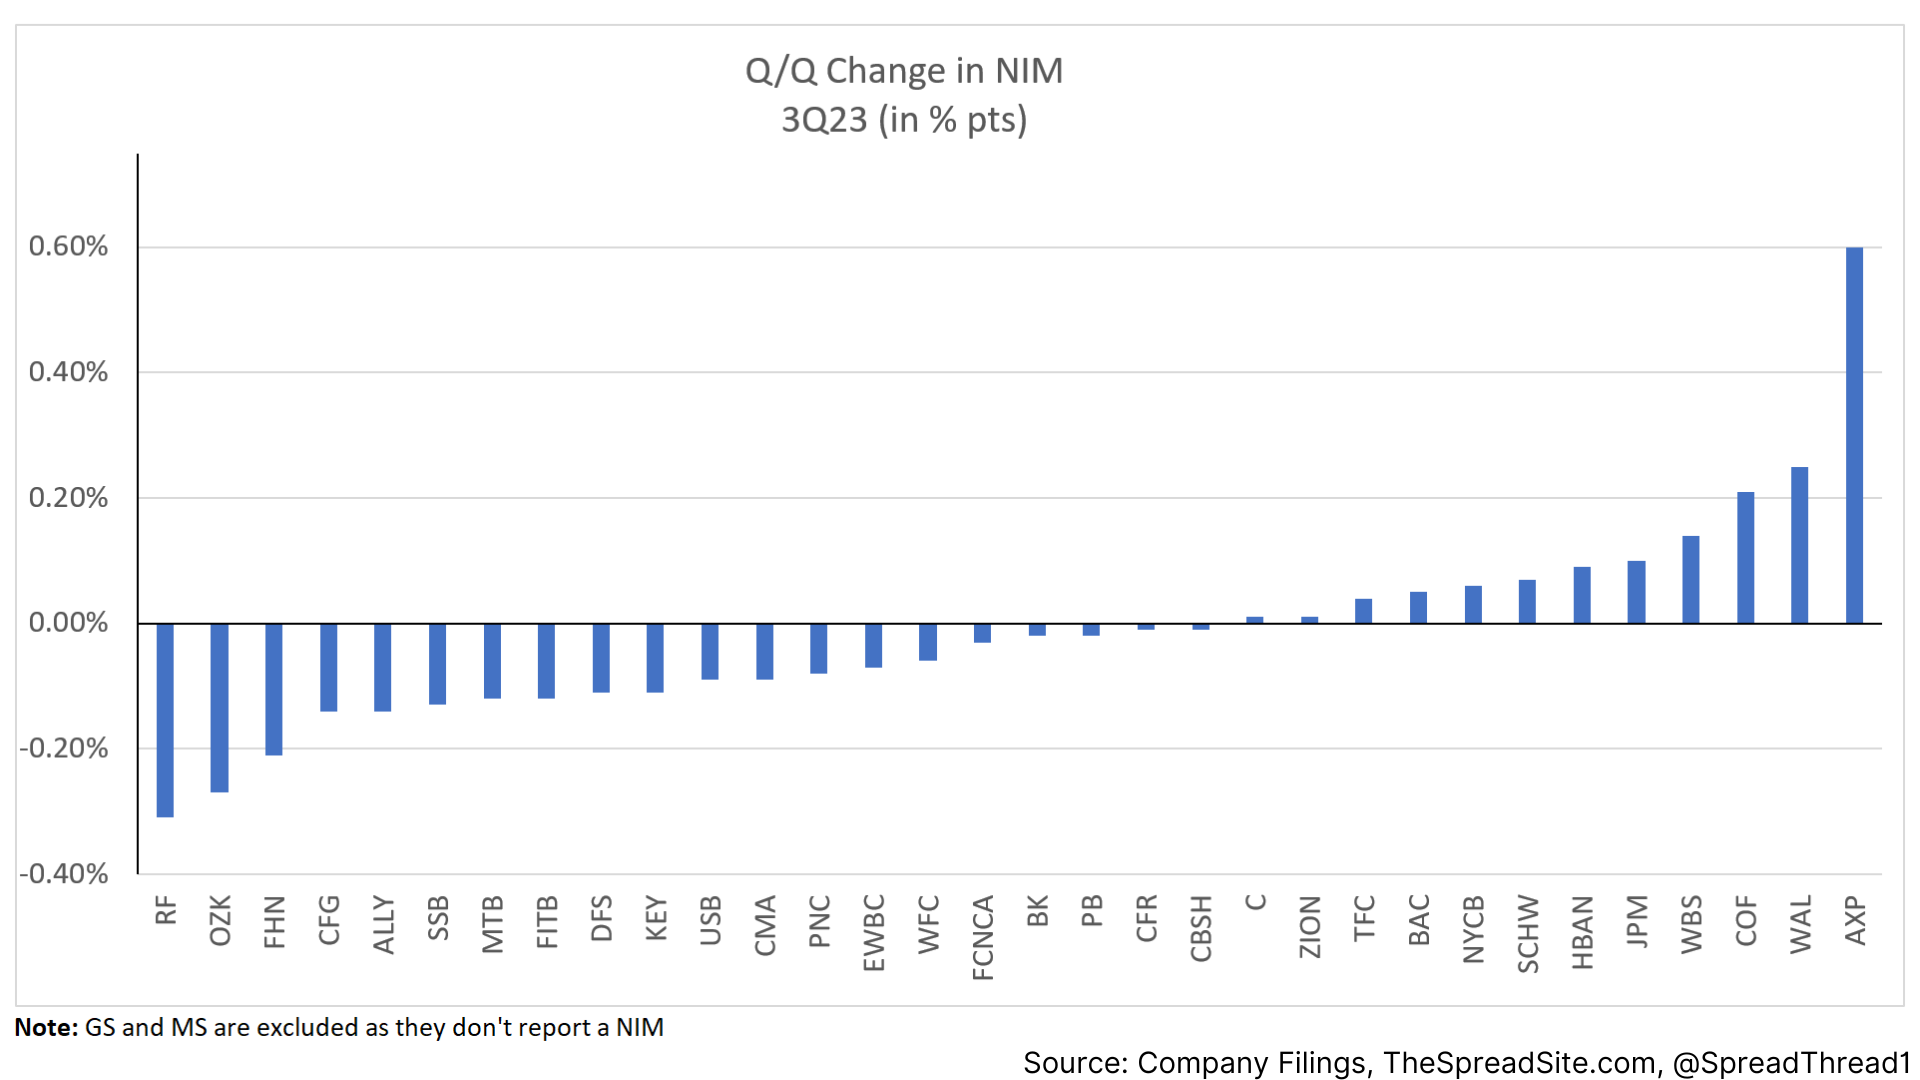
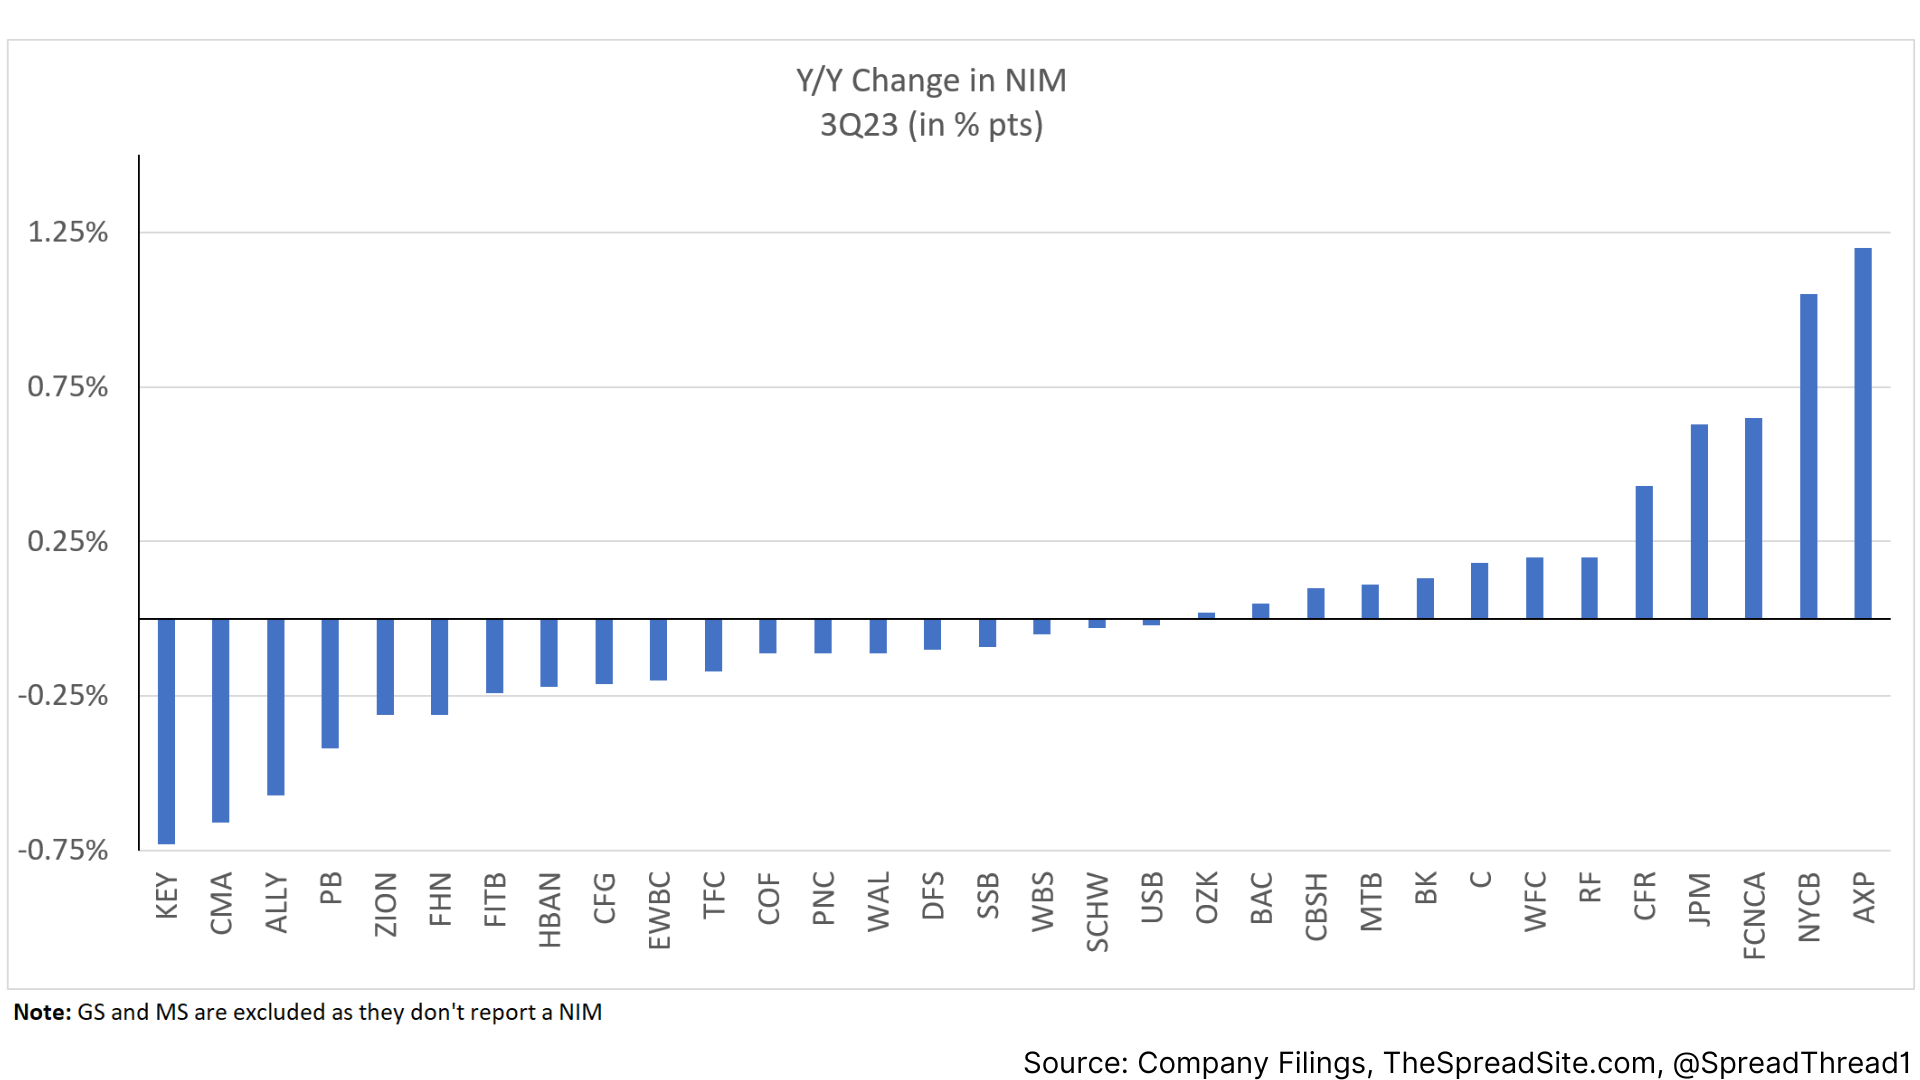
Net Interest Margin ("NIM")
On a Q/Q basis, NIMs are more balanced as compared to 2Q23 when they generally declined across the board. On a Y/Y basis, they remain mainly lower.
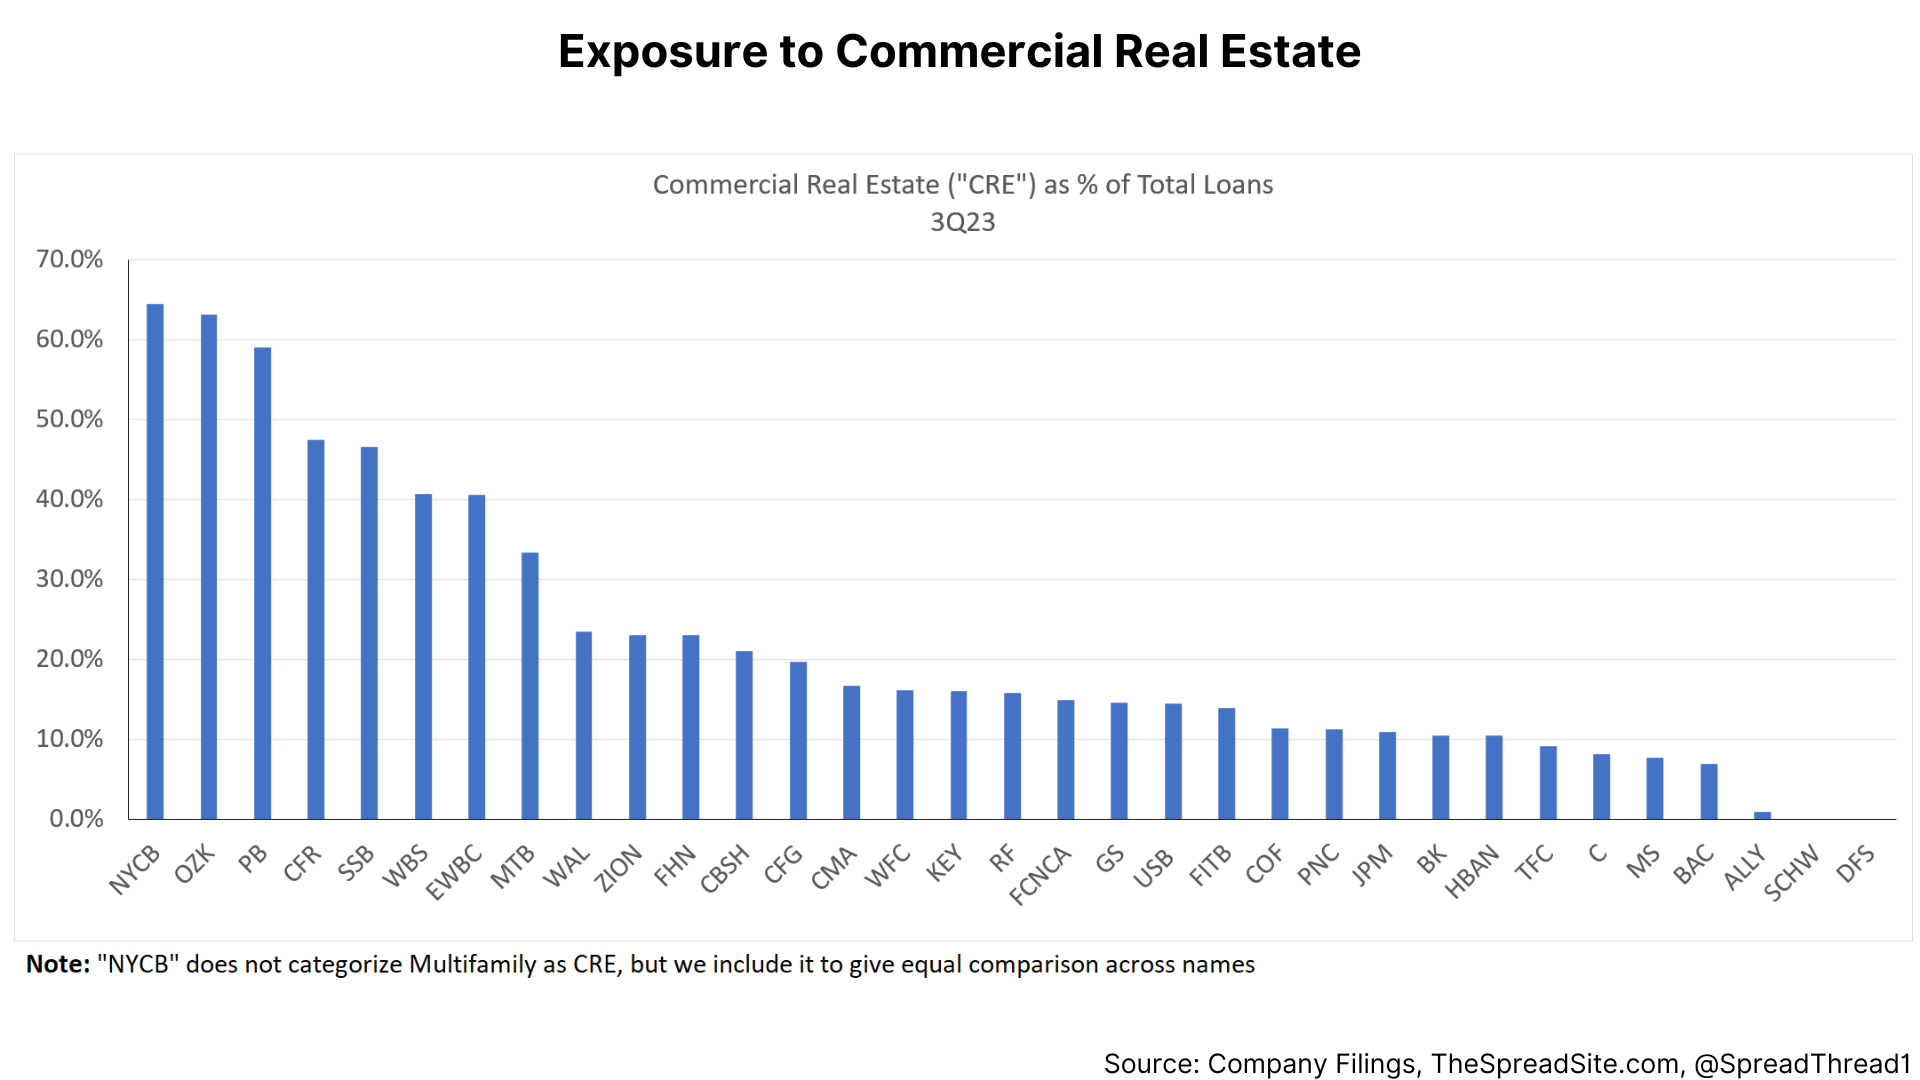
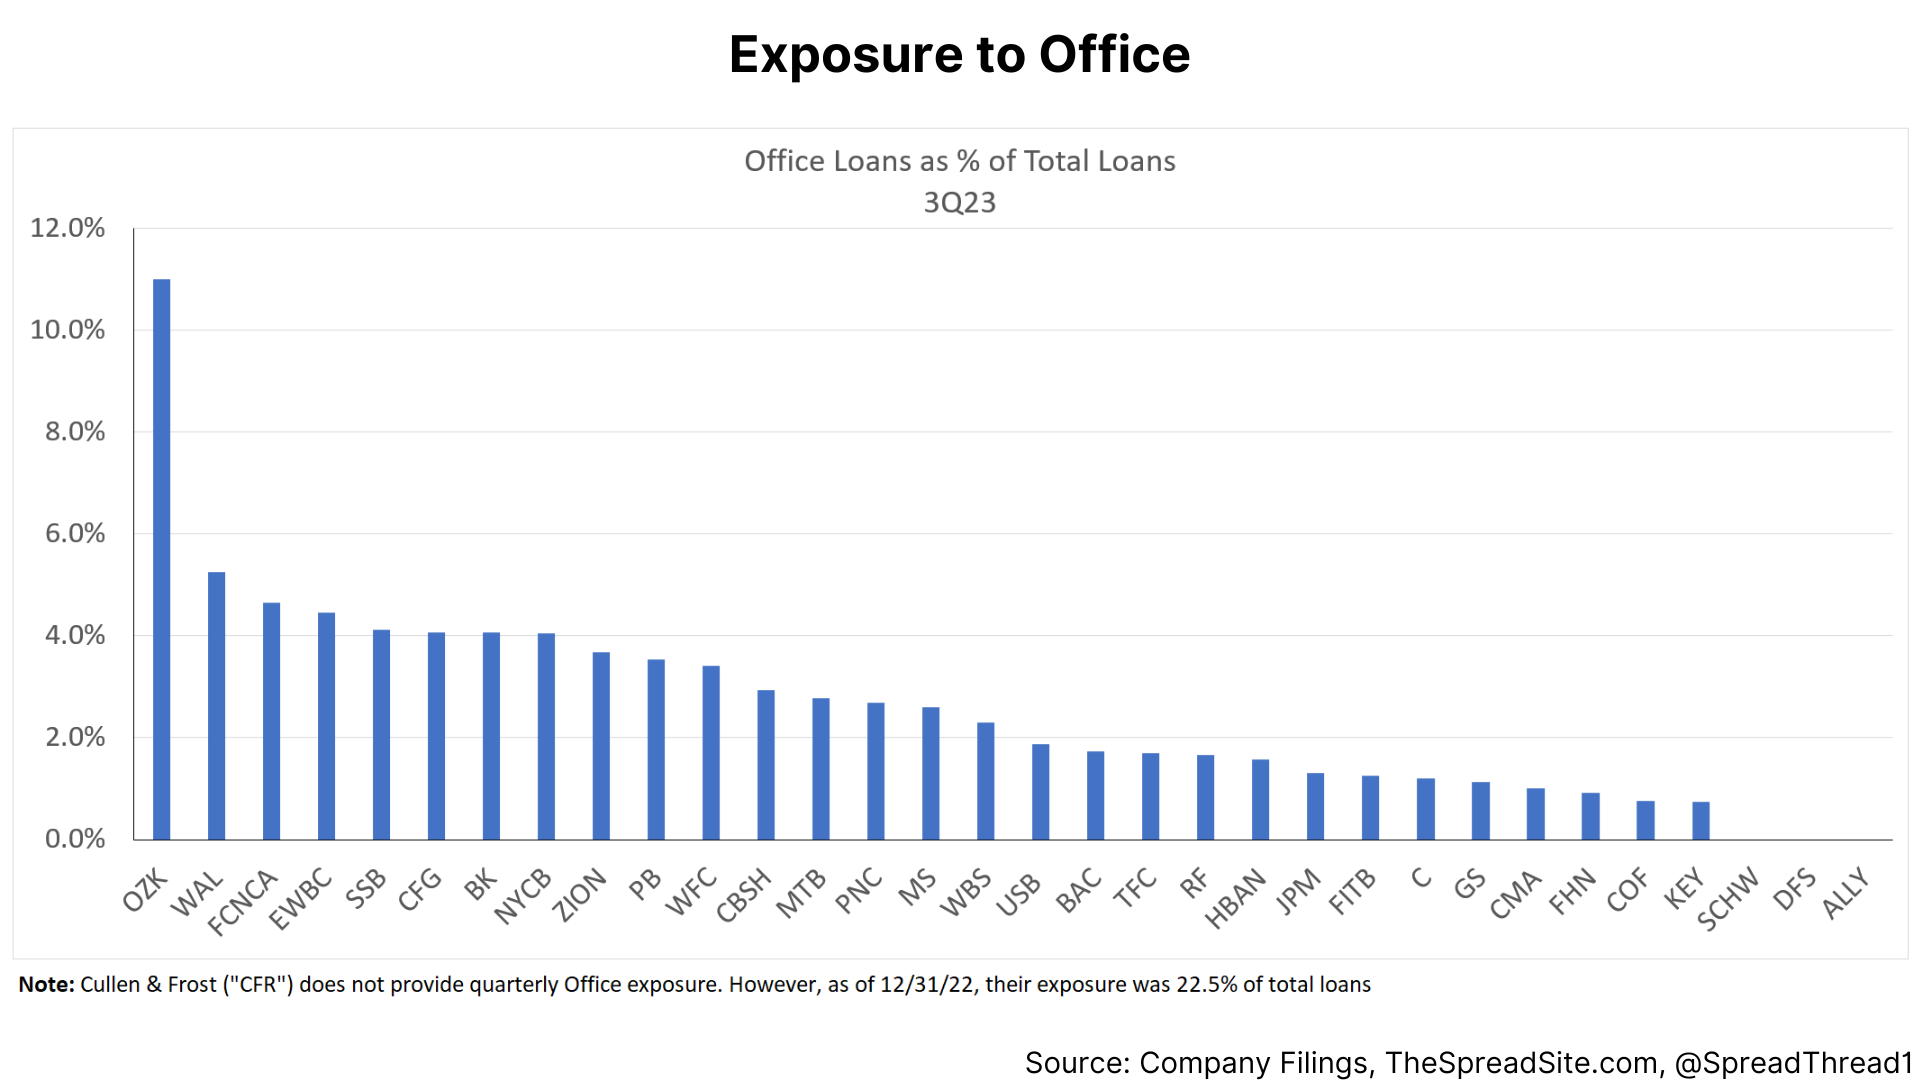
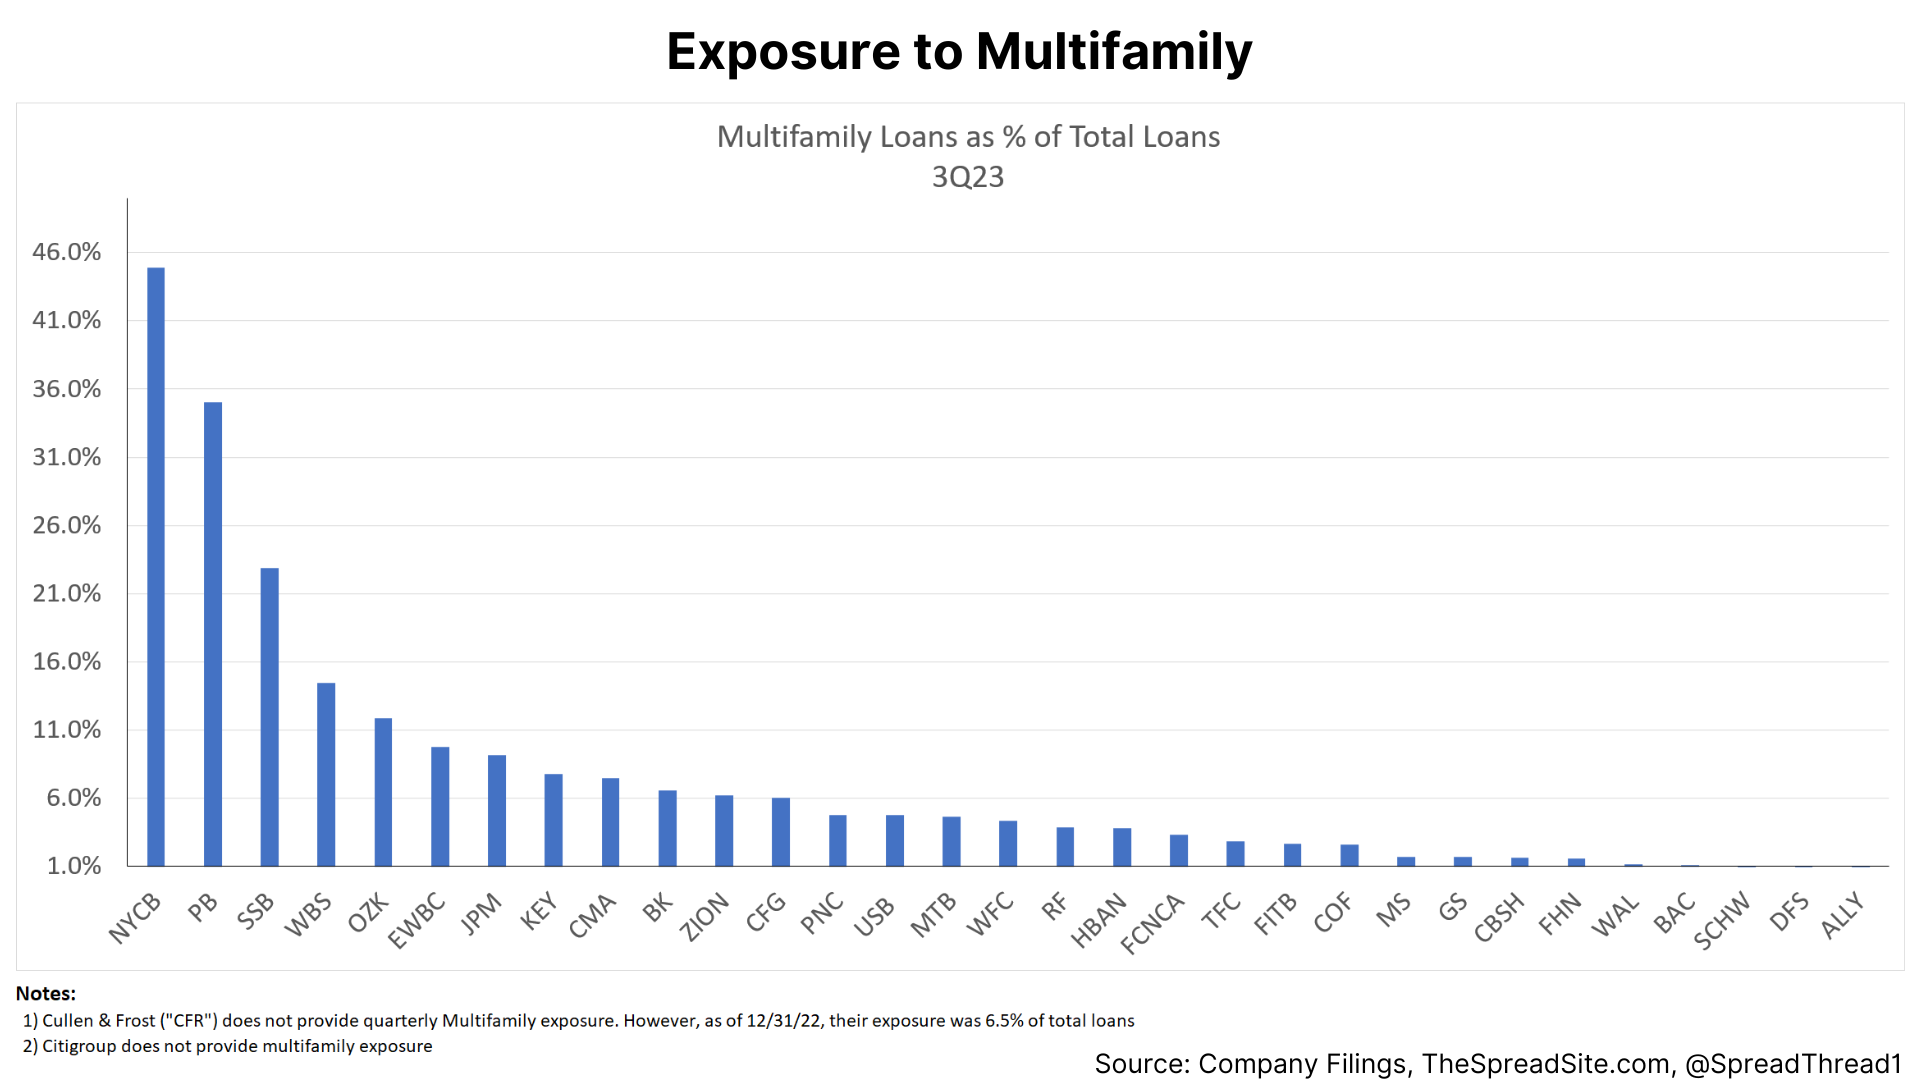
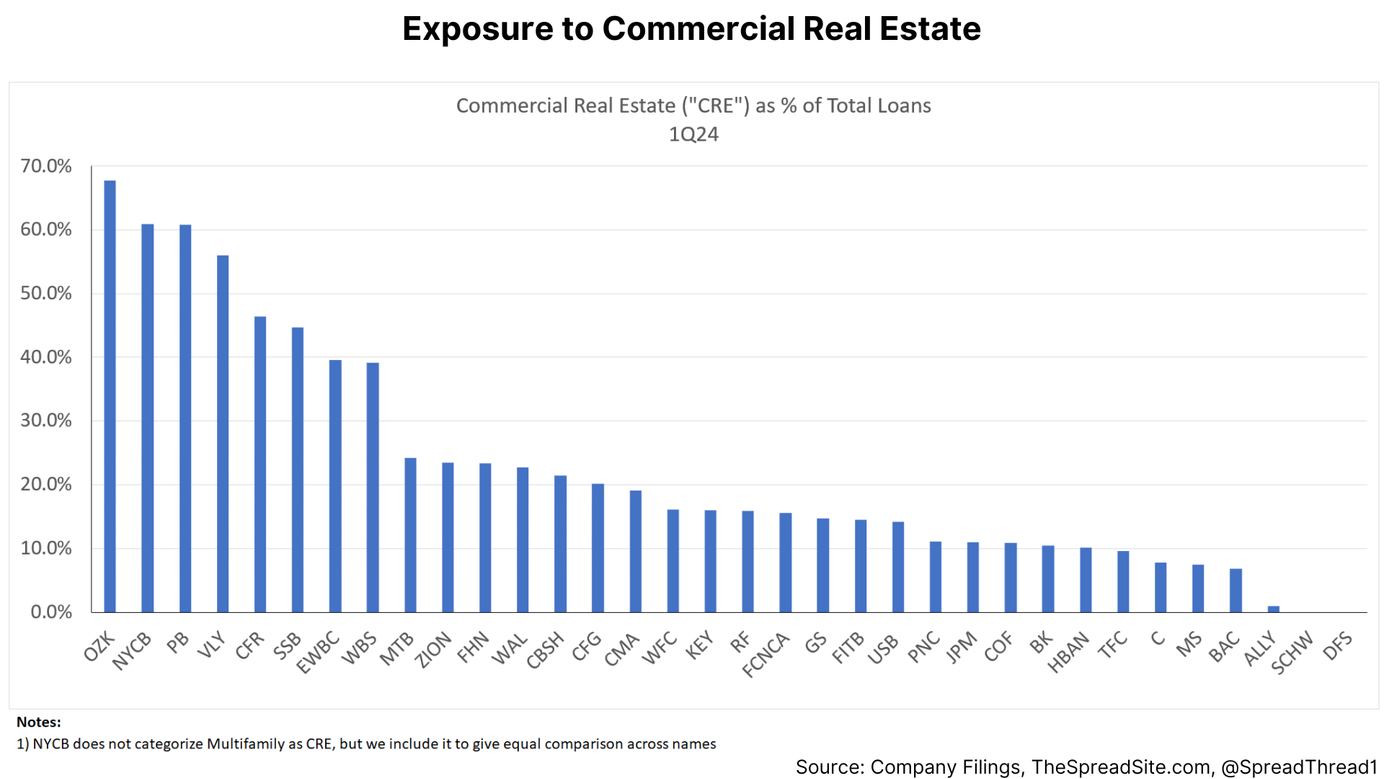
Loan Exposure by Category
In terms of commercial real estate ("CRE"), we show exposure to this category as a percent of total loans. We then show "Office" and "Multifamily" as CRE subsectors.
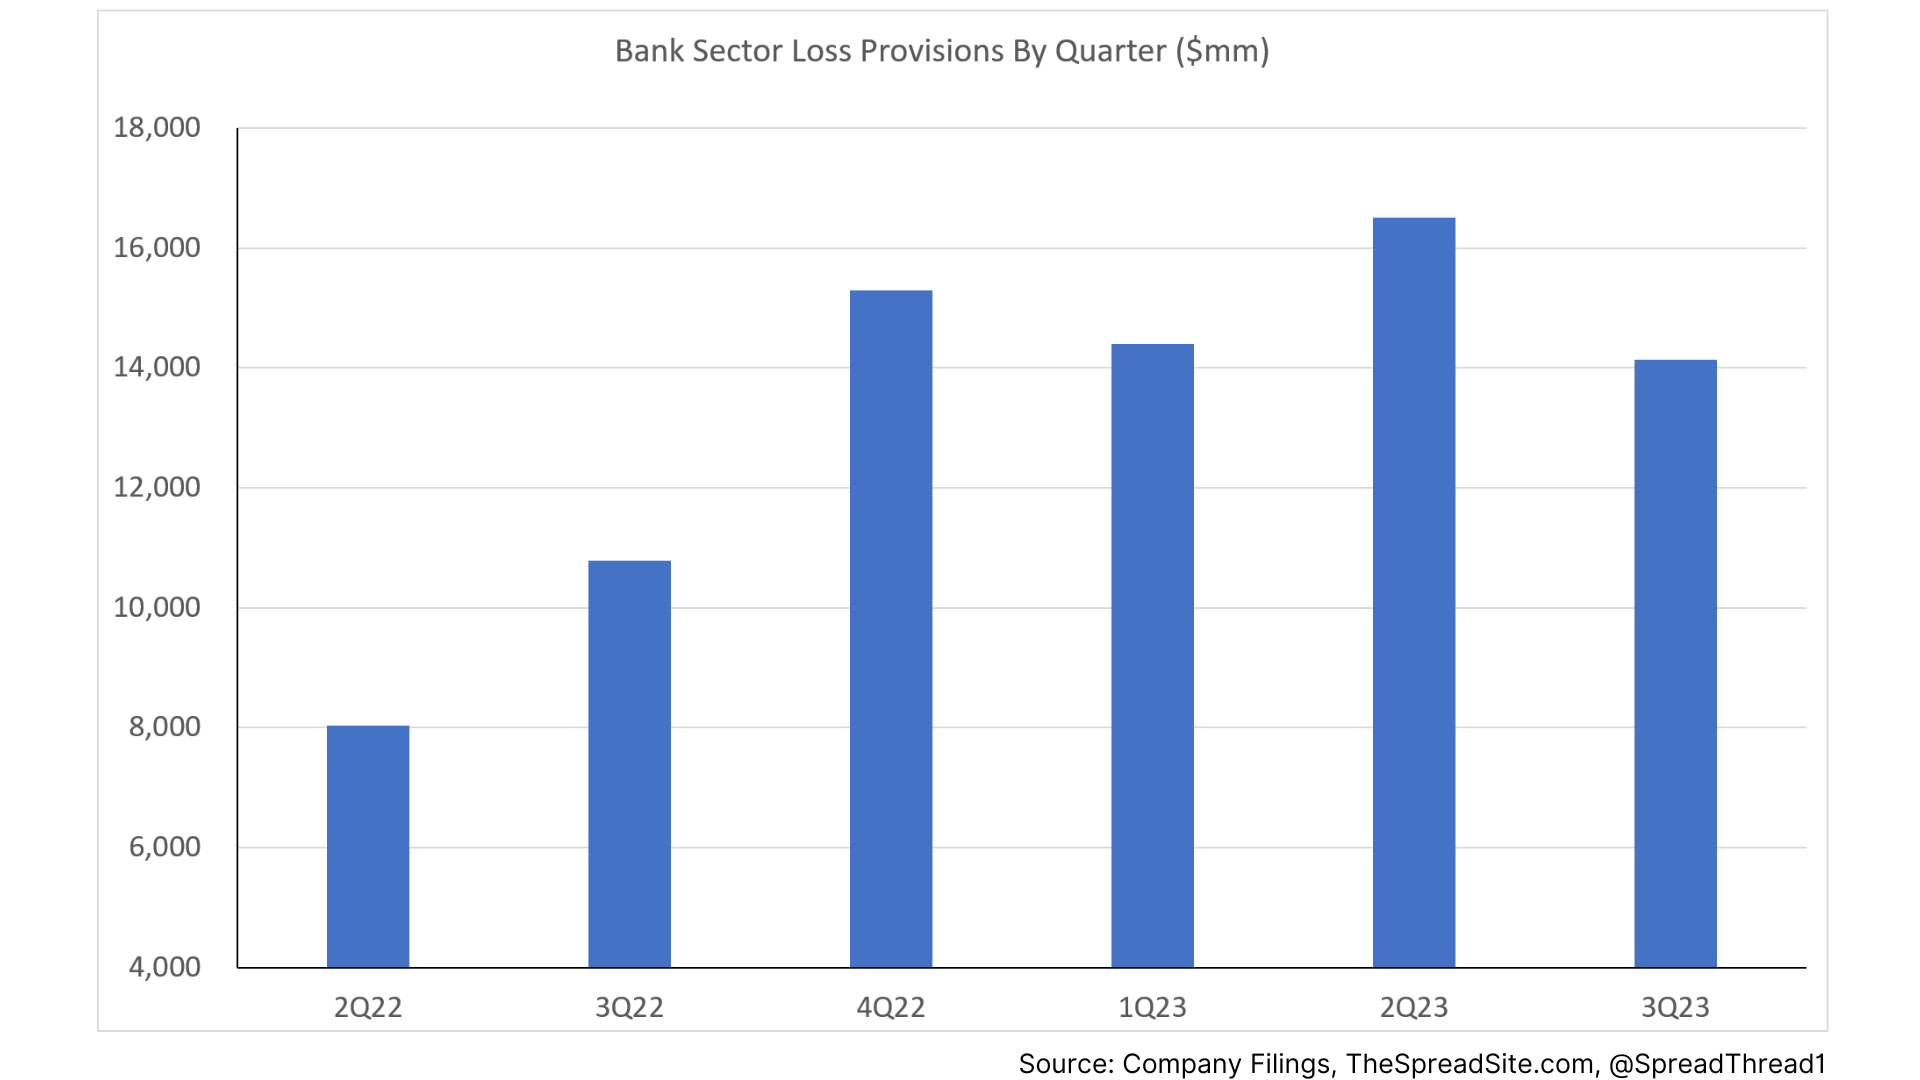
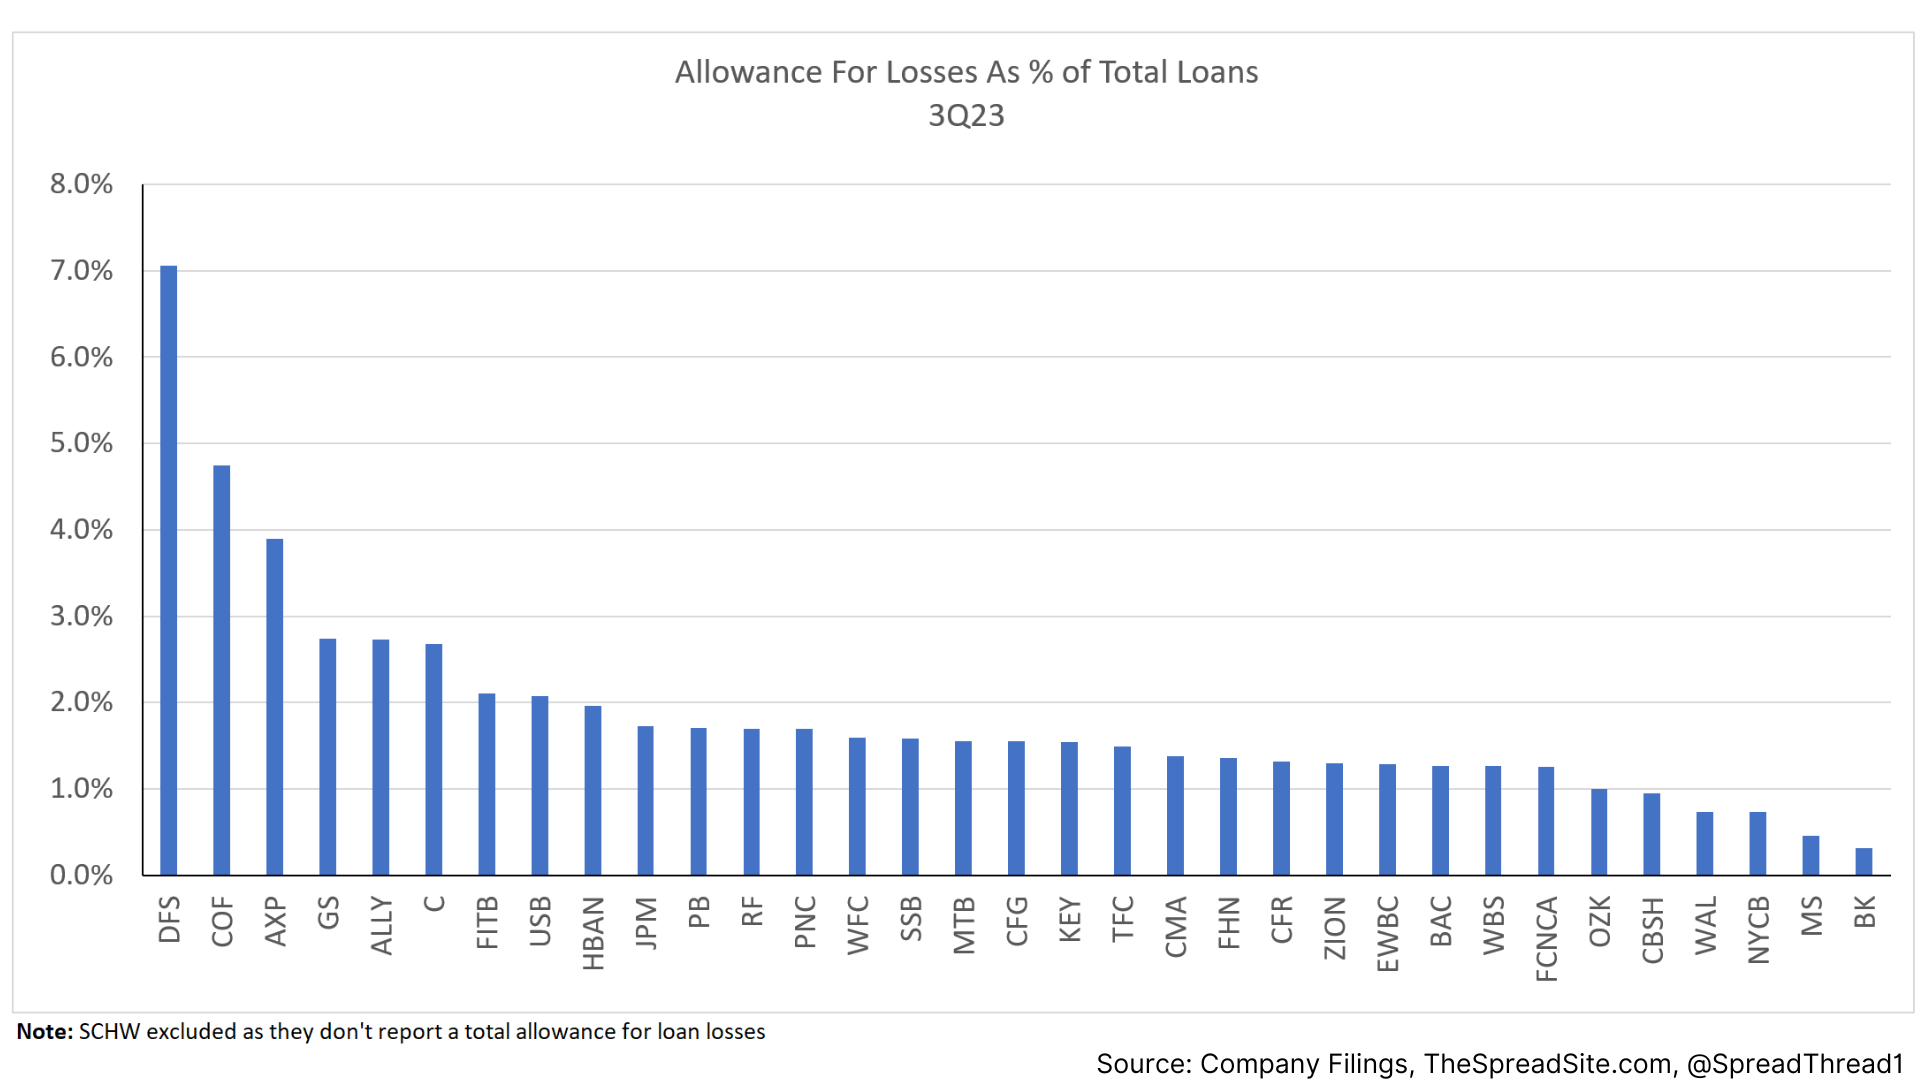
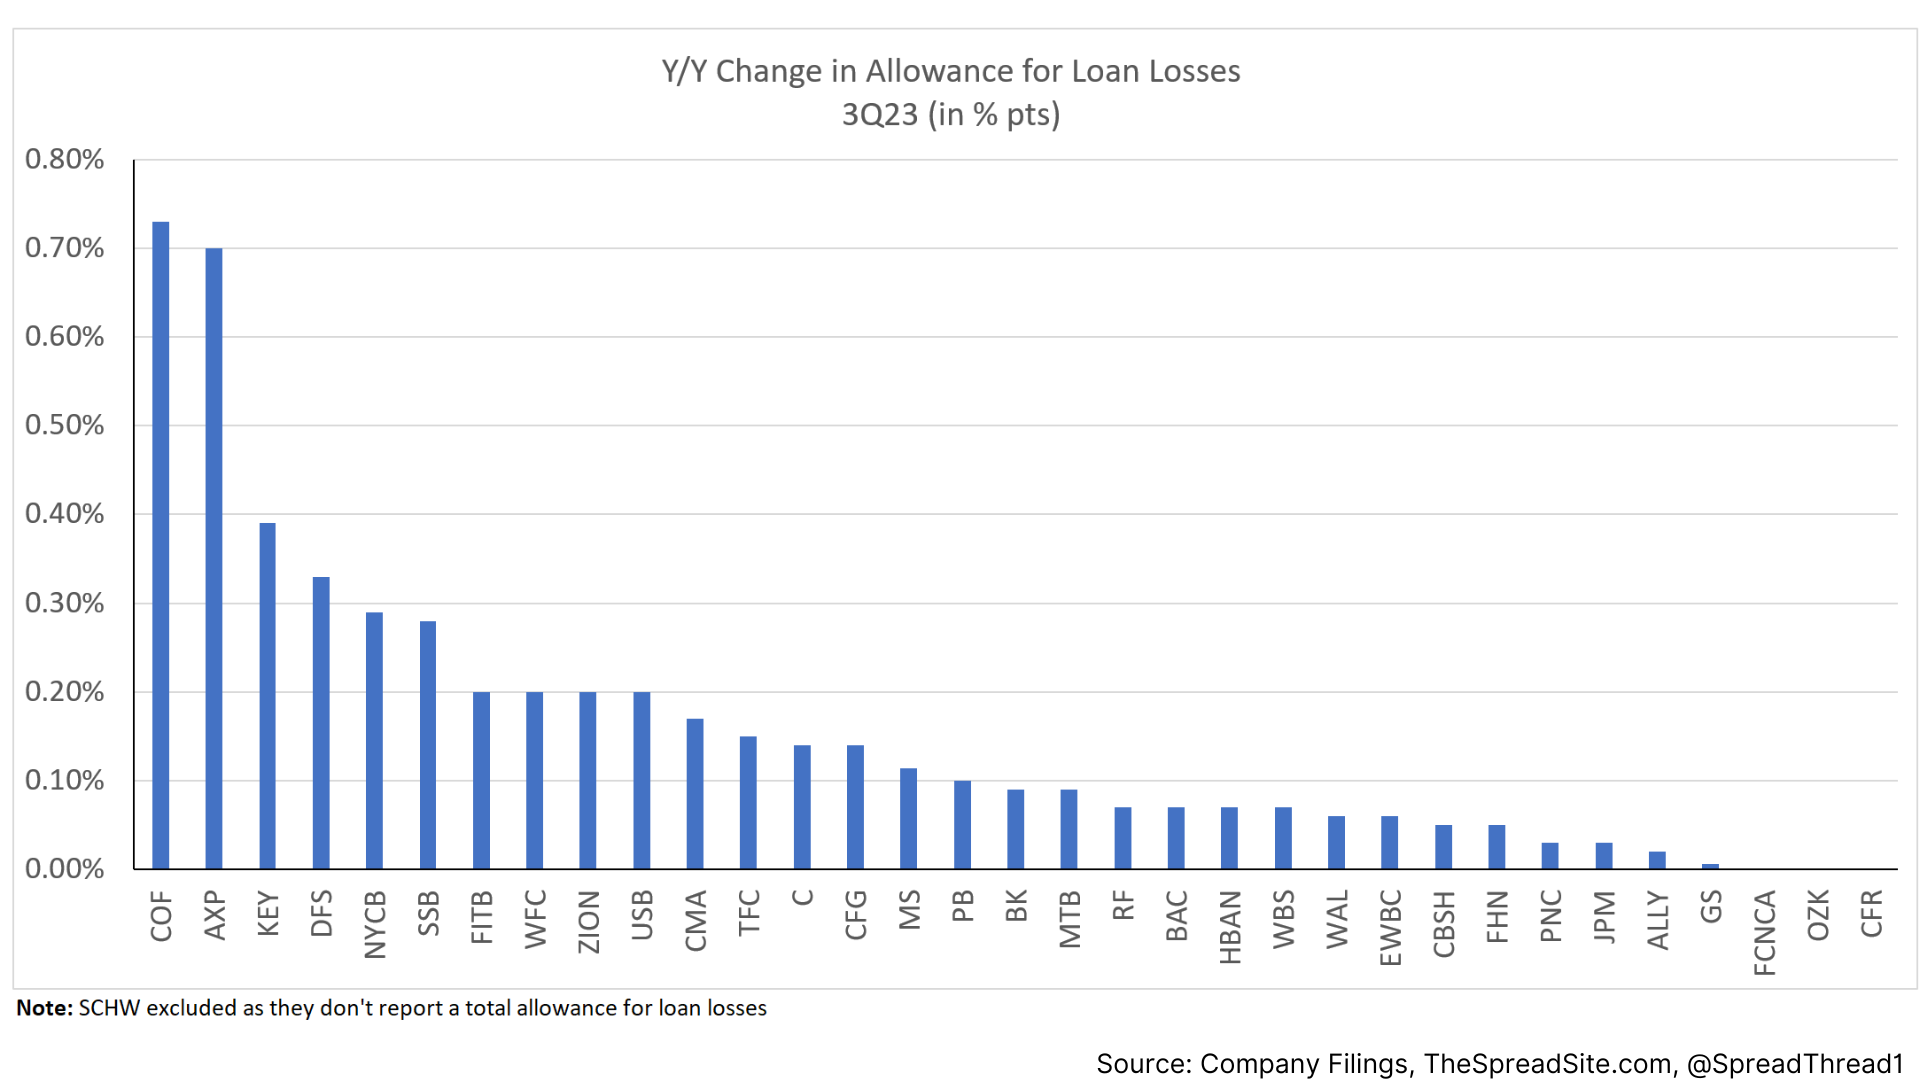
Loss Provisions & Allowances
On a sector basis, credit provisions were lower as compared to 2Q23, but substantially higher than 3Q22. Companies with large consumer credit exposure (credit cards) have the largest Y/Y change in loan loss allowances.
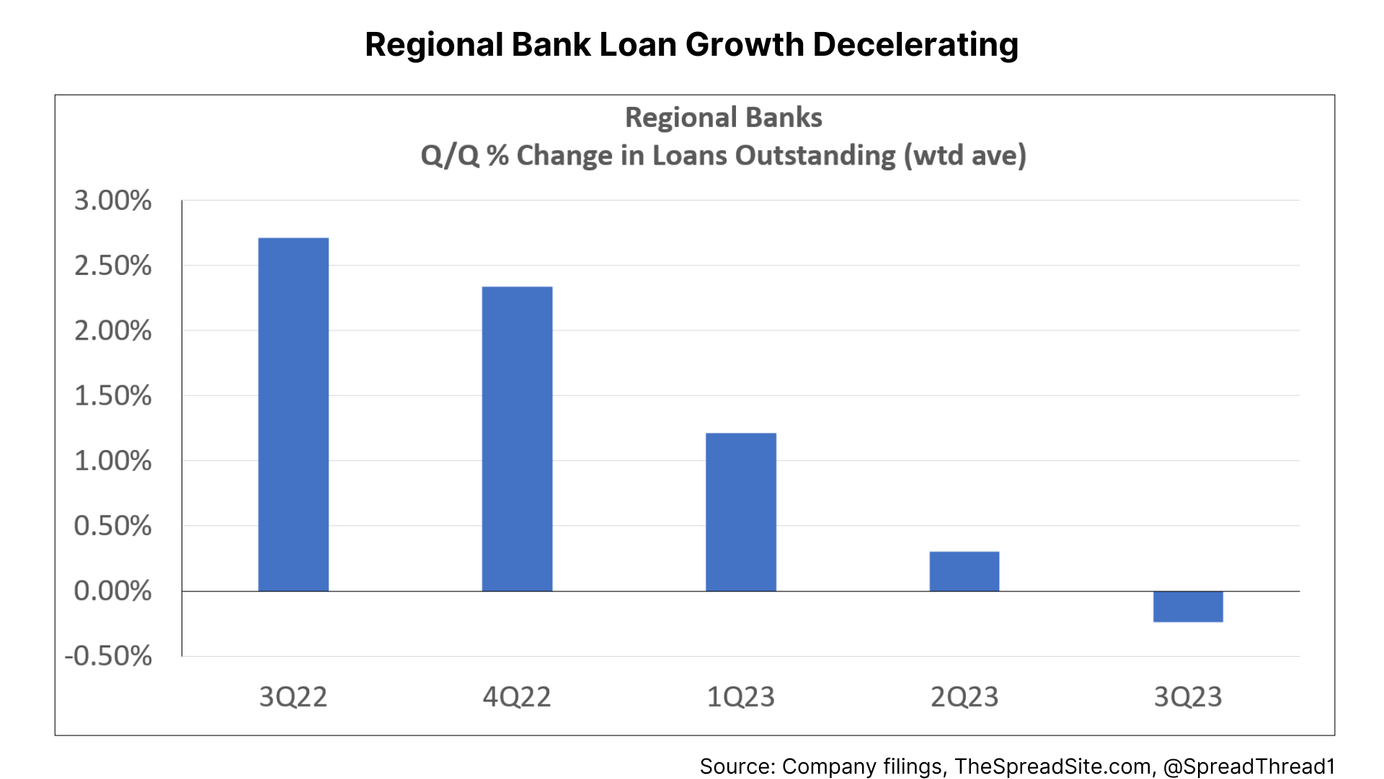
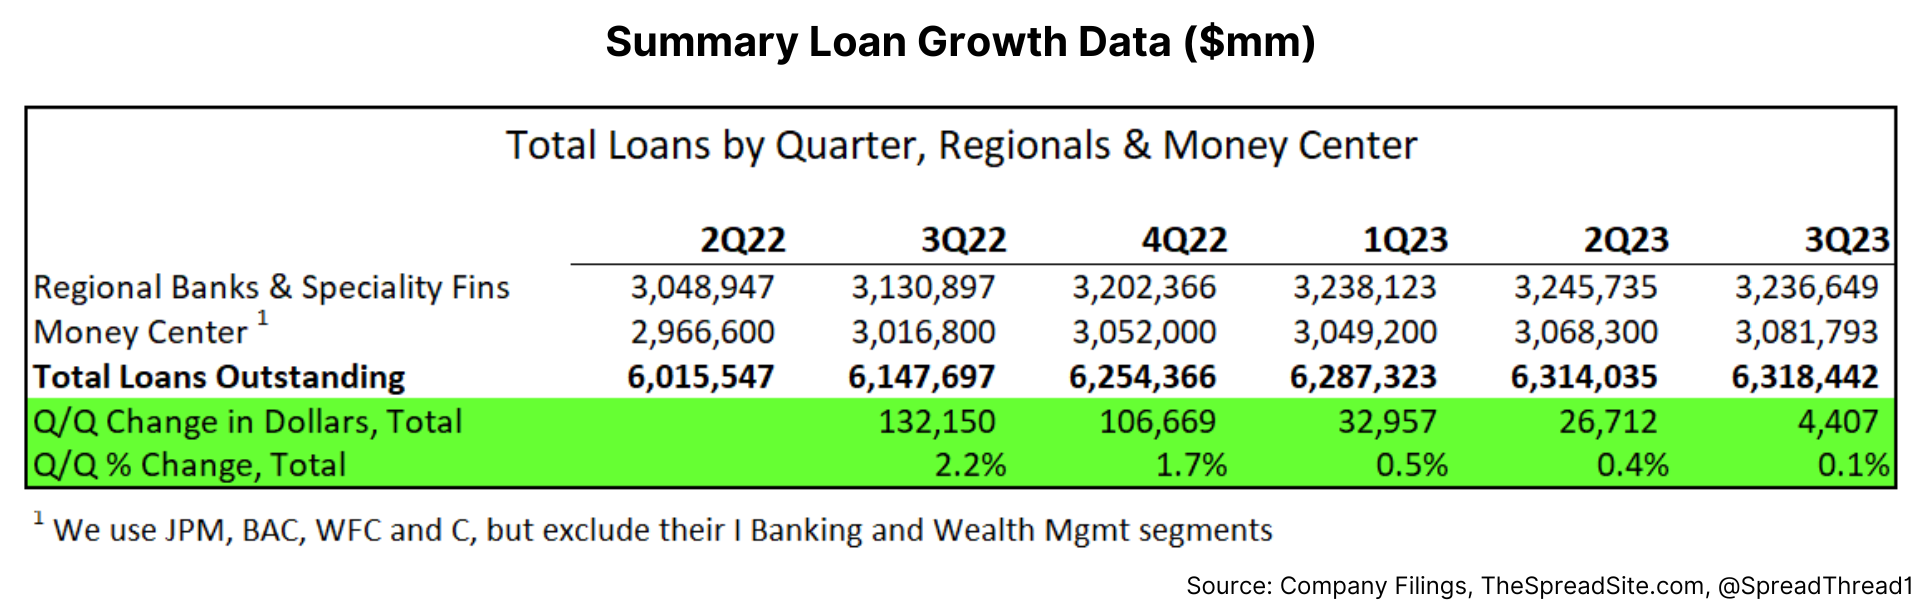
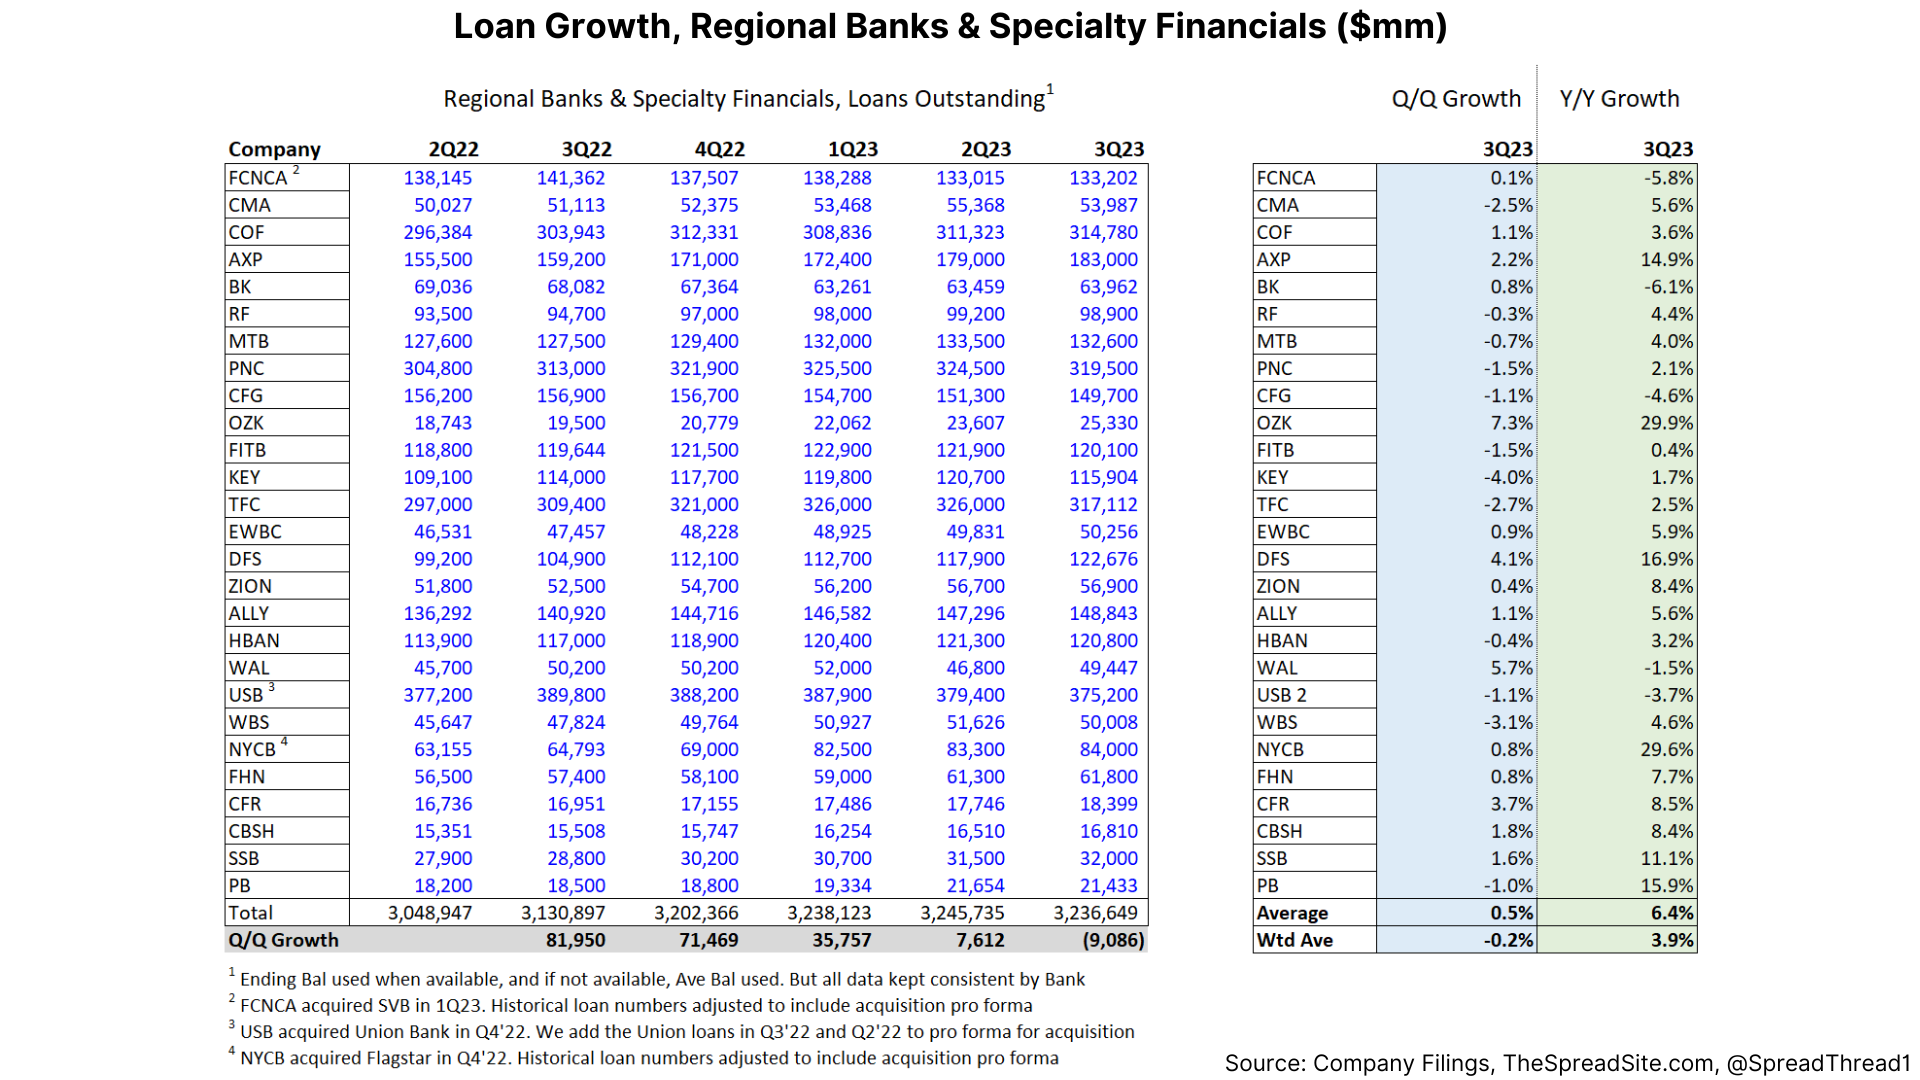
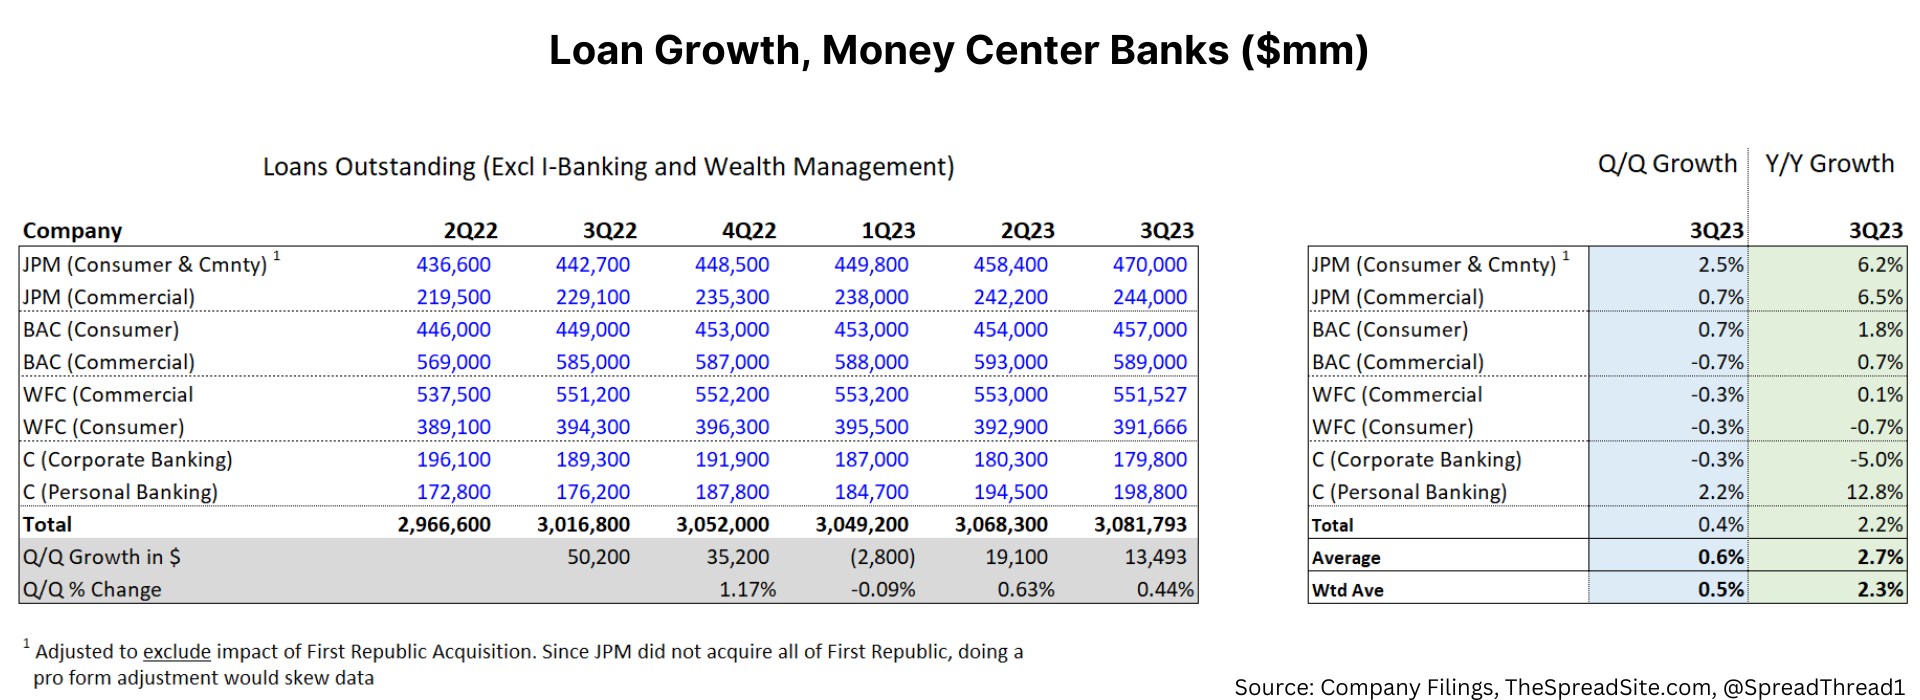
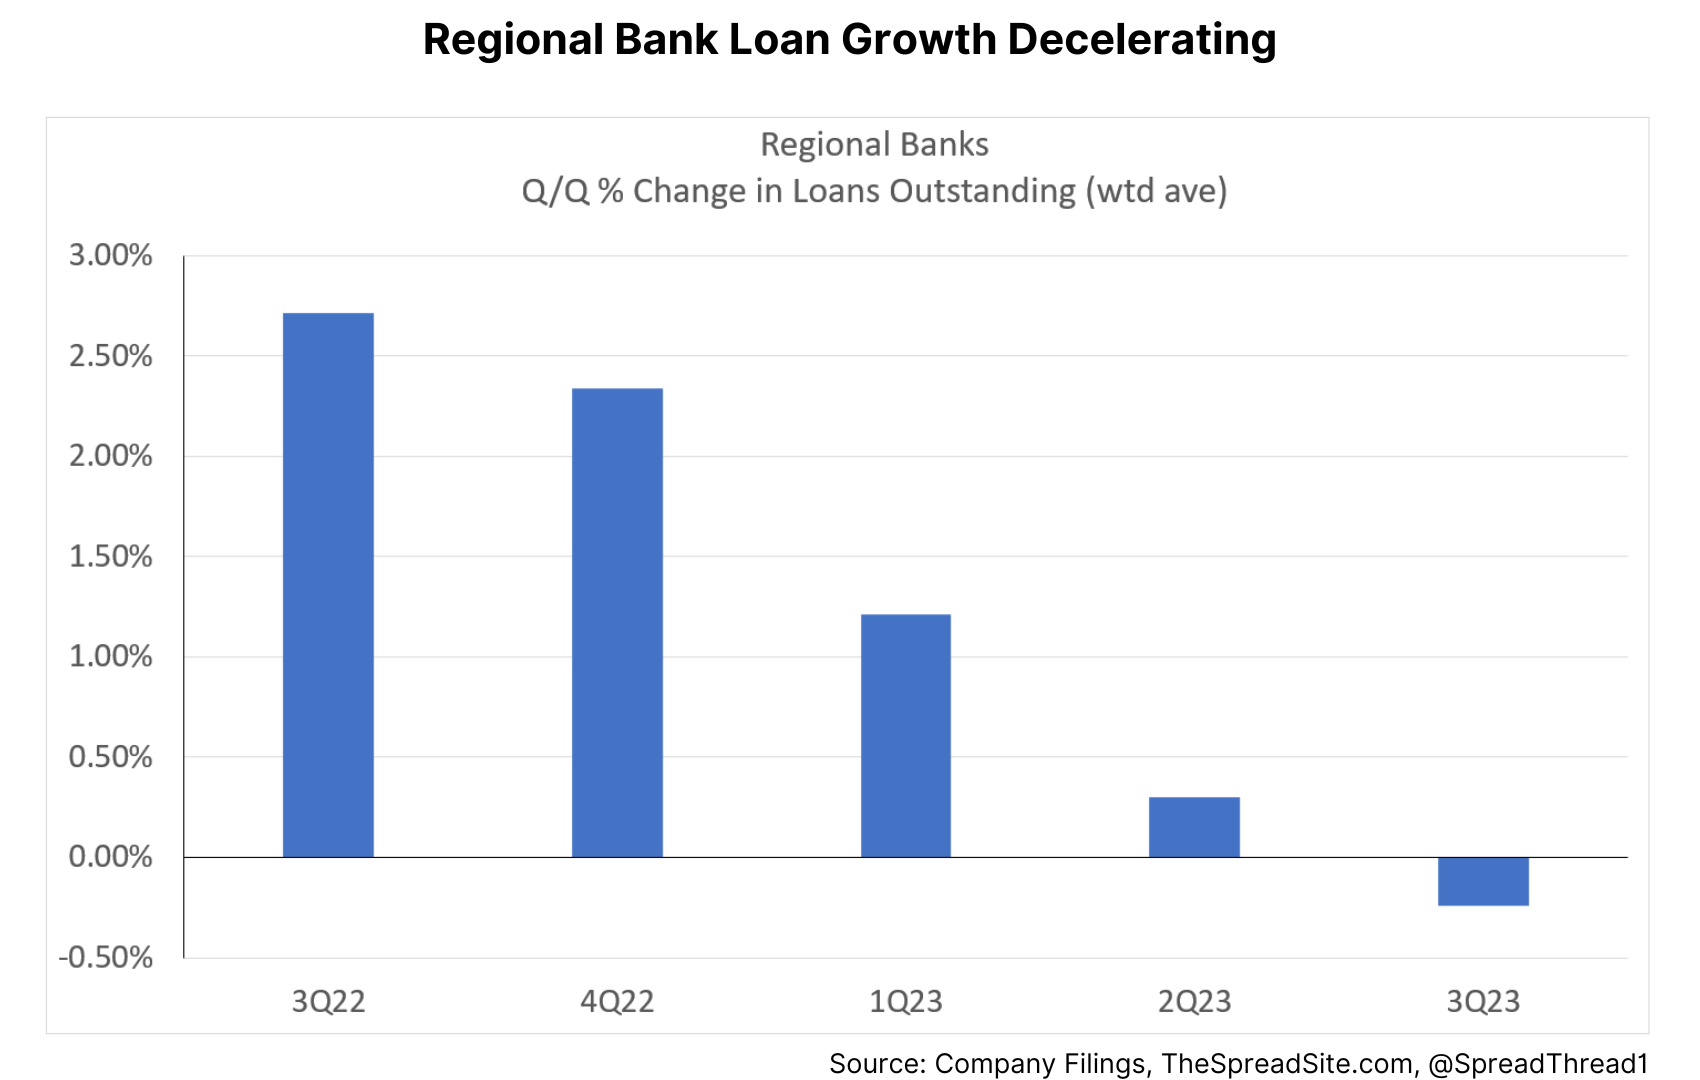
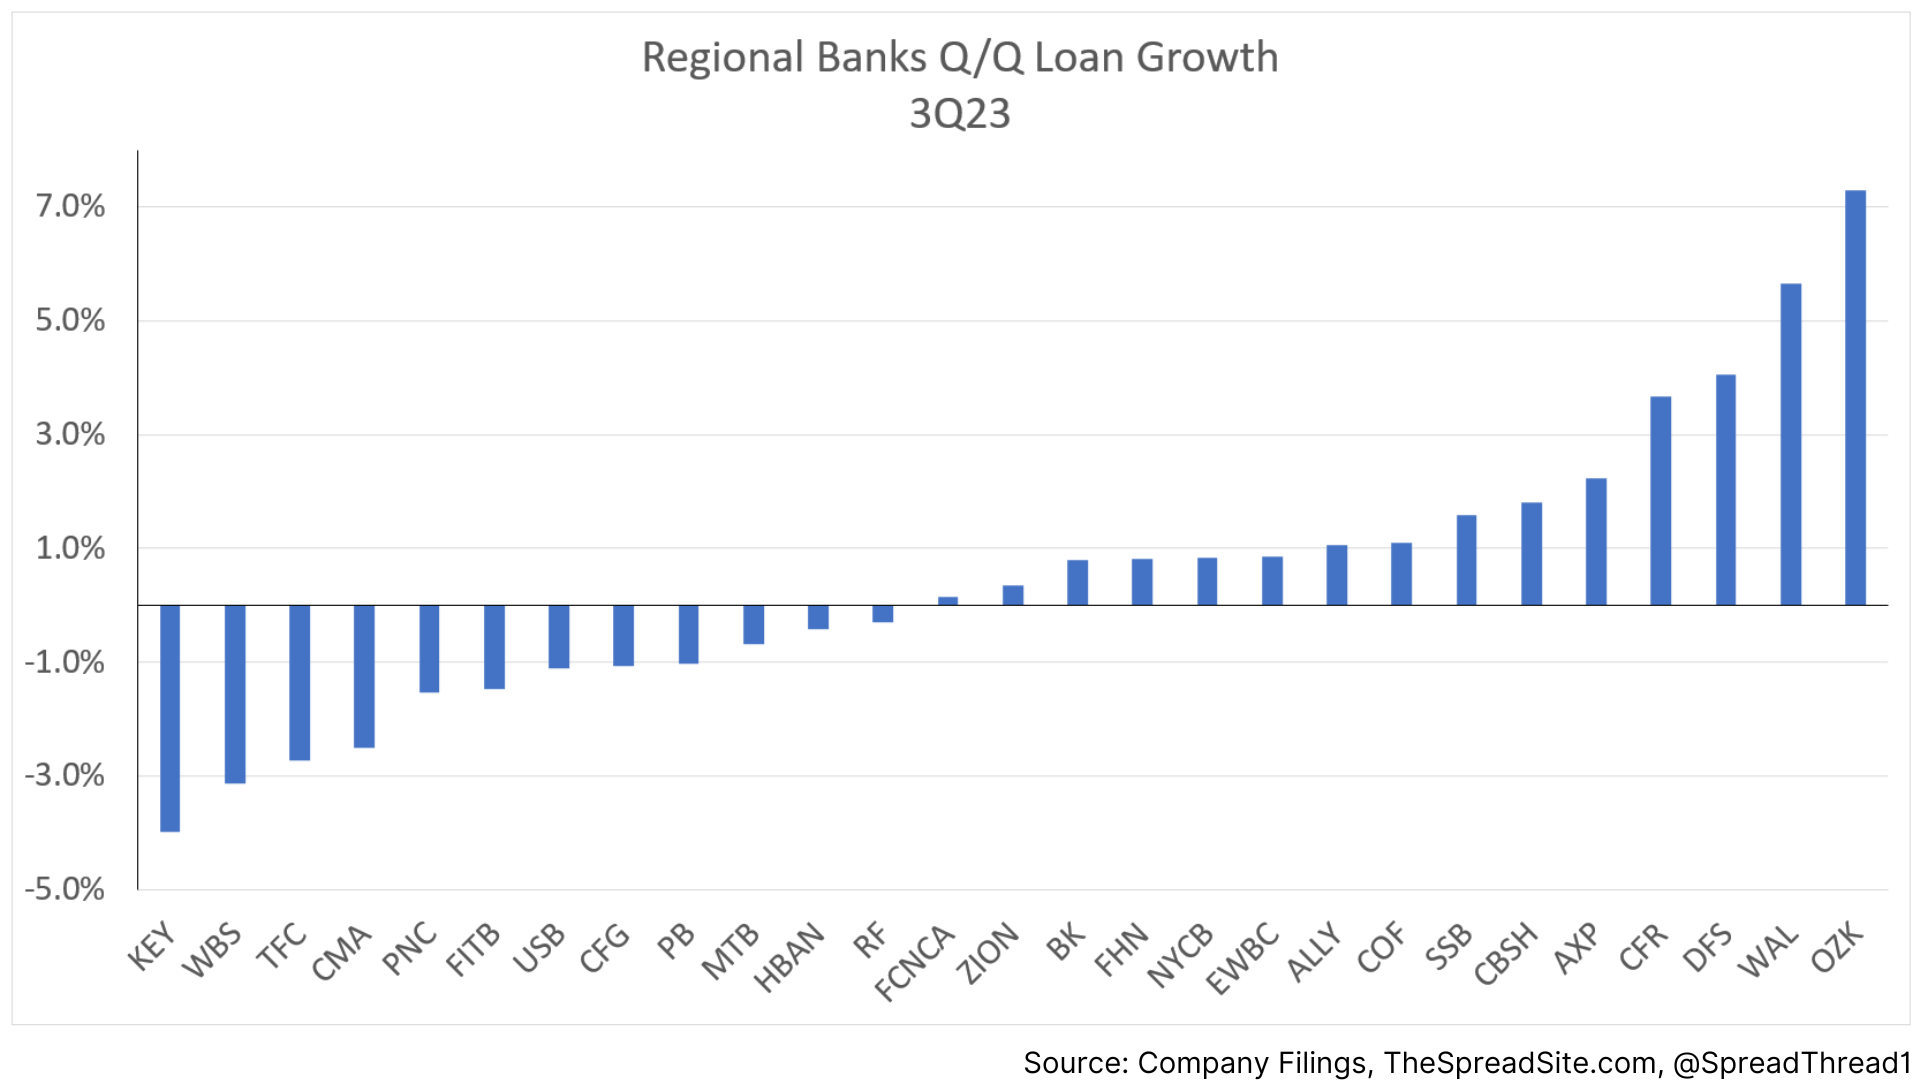
Loan Growth
Lastly, we look at loan growth, which is slowing among the regional banks Q/Q and slightly higher among the money center banks Q/Q.
Disclosures
Please click here to see our standard legal disclosures.
The Spread Site Research
Receive our latest publications directly to your inbox. Its Free!.


