Bank Stocks, Charts & Data: 4Q23
The Banking Sector In Charts
We are through 4Q23 bank earnings and have a few weeks until all companies file their 10Ks. Aside from a few data points, most information compiled is available through the Call Reports available on the FDIC's website or supplemental data issued with earnings releases.
Our method, generally speaking, is to include all banks in the "KRE" Regional Bank ETF greater than ~$5b of market cap and all banks in the "KBE" Bank ETF greater than ~$10b of market cap (VLY was added to the data this quarter).
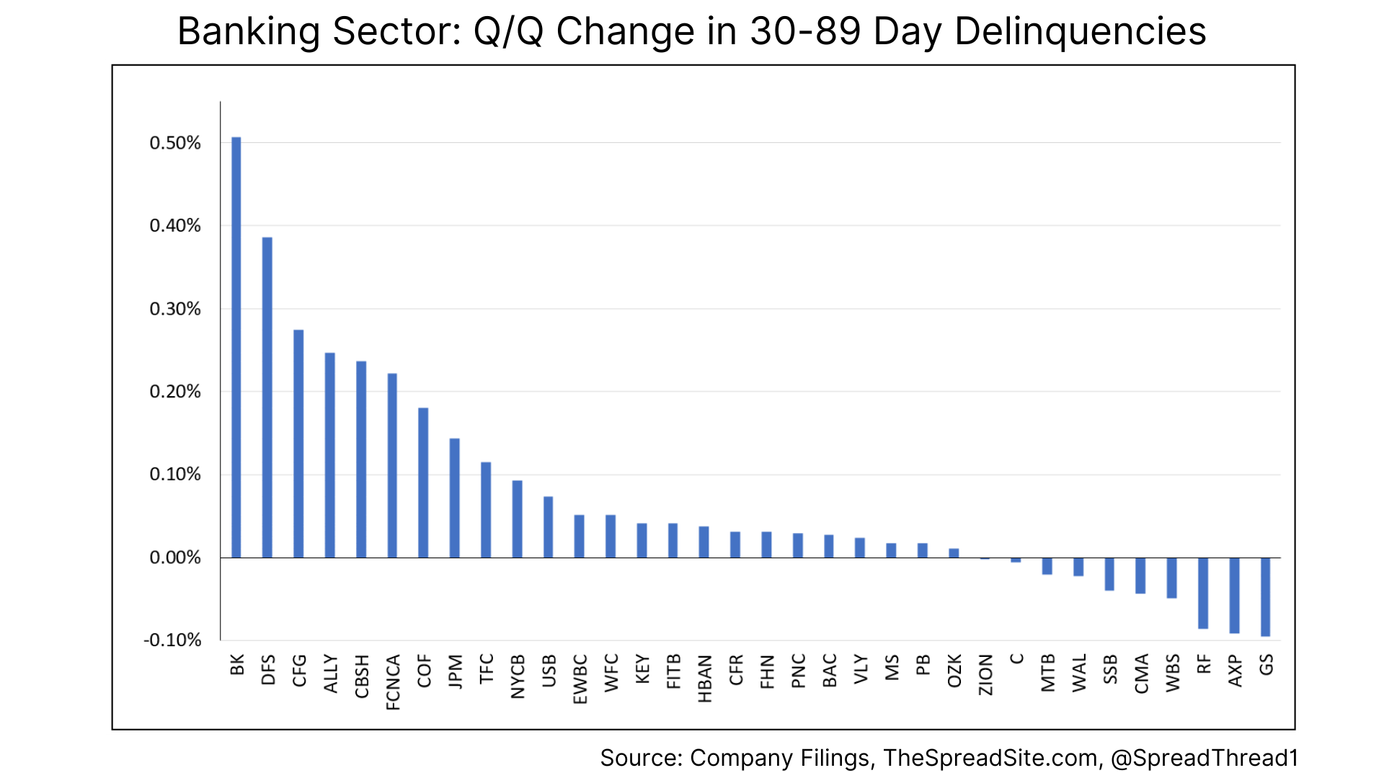
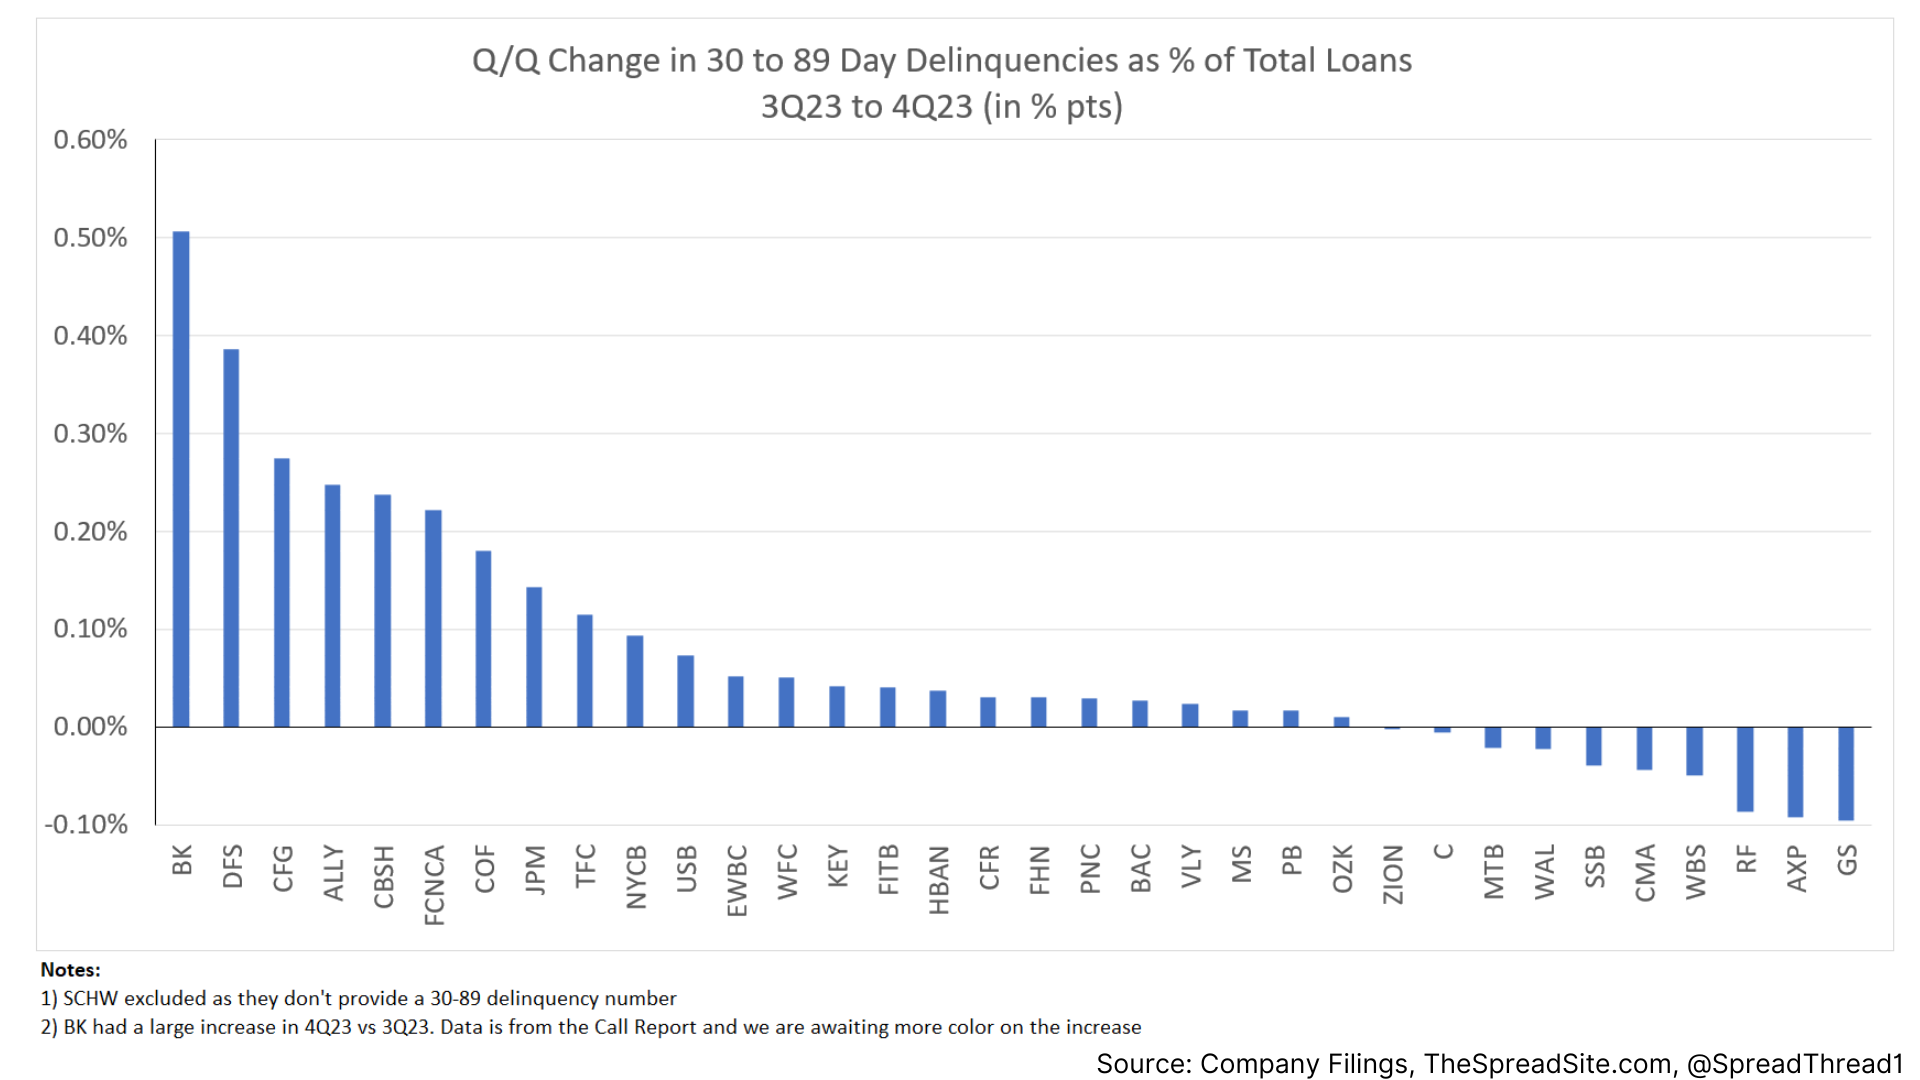
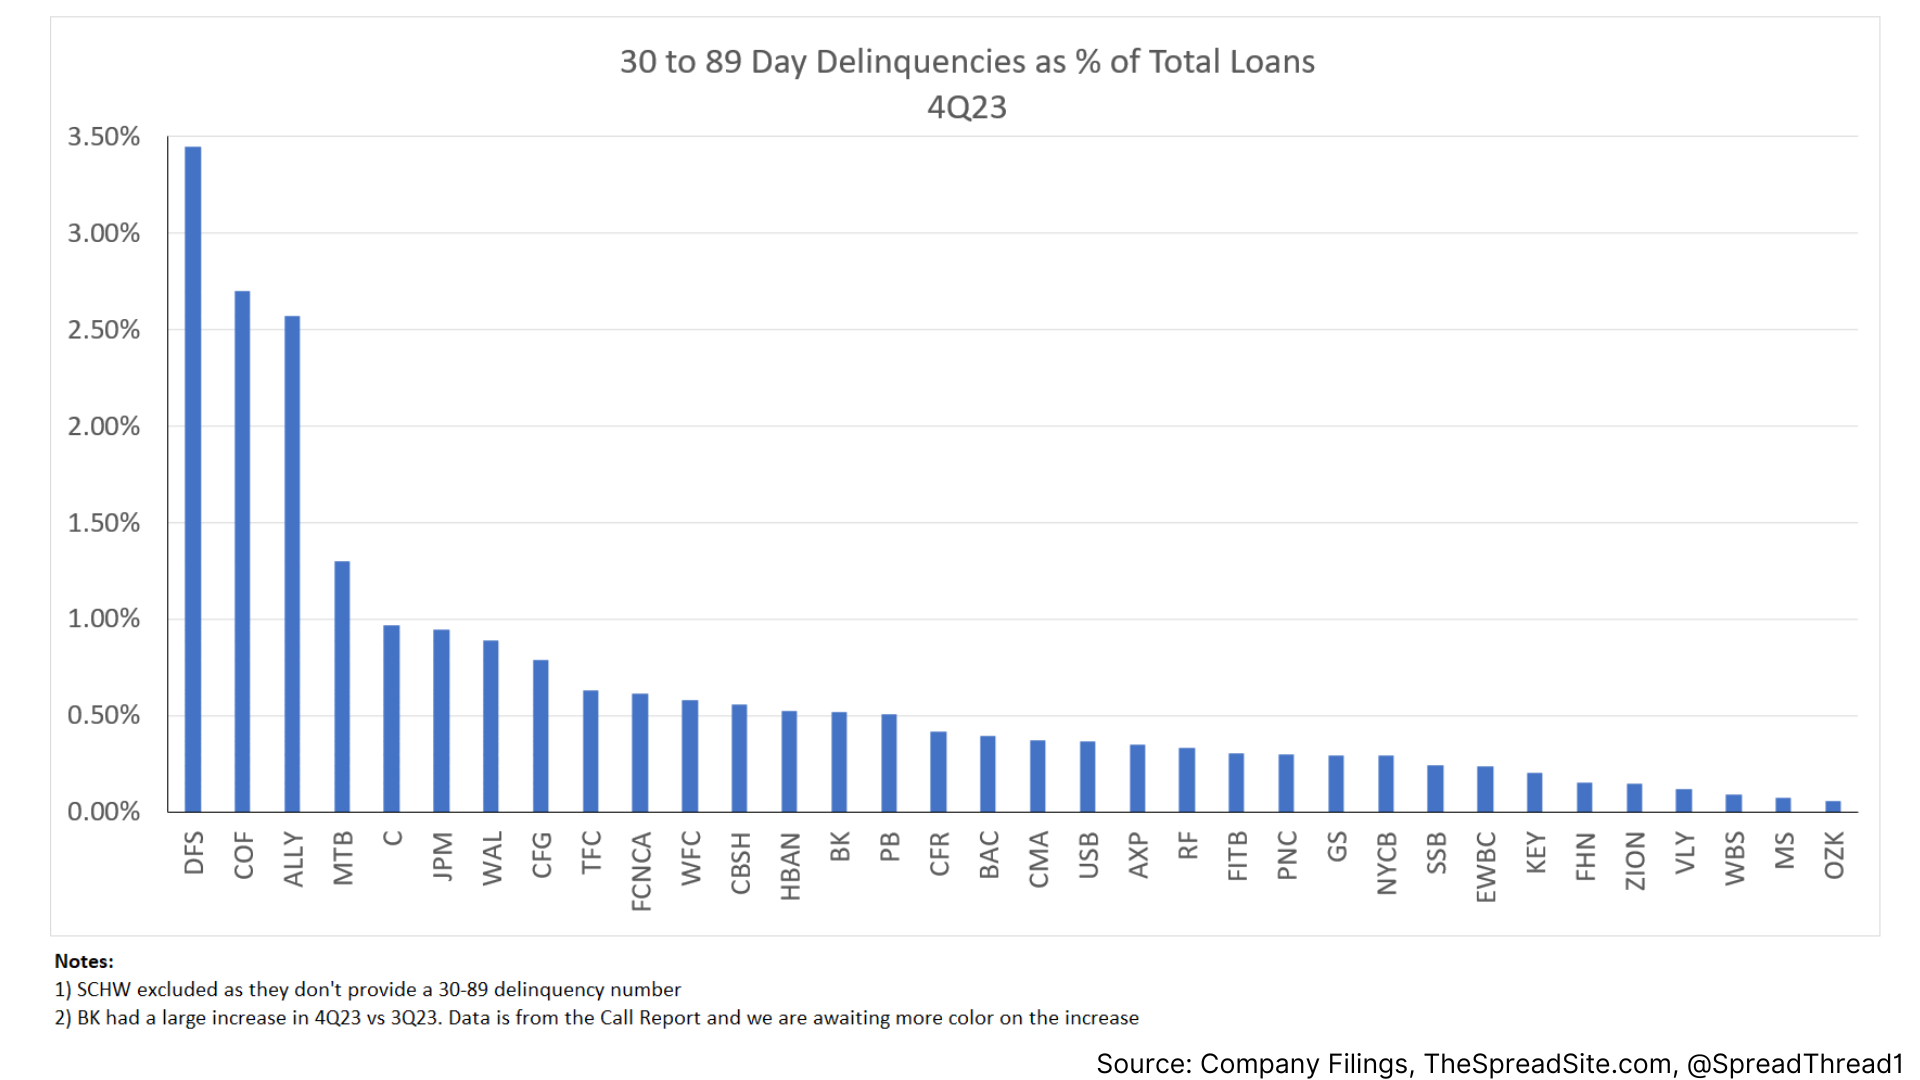
30 to 89 Day Delinquencies
These charts are new for 4Q23 as we think it will be important to watch trends on new delinquencies. This category indicates loans where the borrower is 30 to 89 days behind on payment.
Most of this data is from Call Reports, and generally, these loans are not yet classified as non-performing. However, they could signal future provisions and charge-offs depending on the outcome (i.e. does the lender start paying or does the lender default and if so, what is the recovery on the loan).
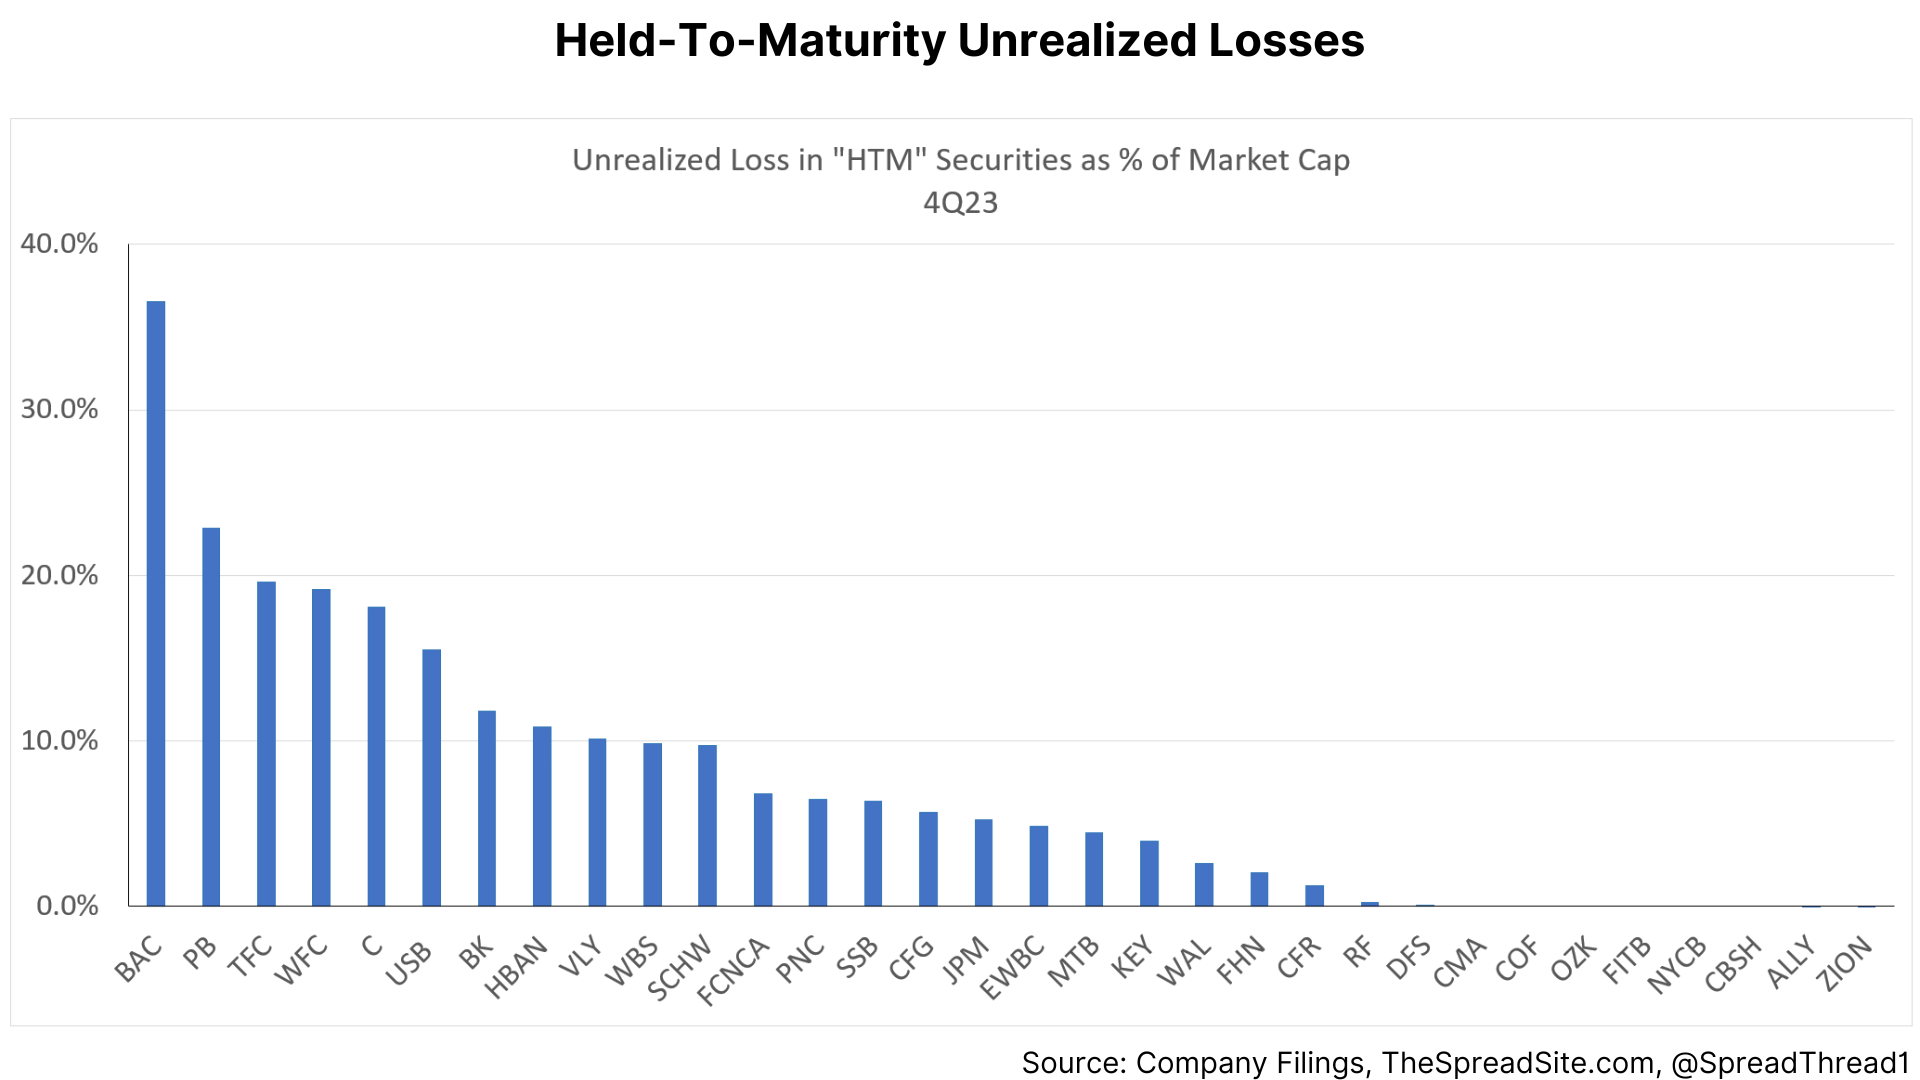
Held-To-Maturity ("HTM") Securities
At the end of 3Q23, 10Y Treasury yields were 4.57% and 30Y yields were 4.69%. At the end of 4Q23, 10Y Treasury yields were 3.87% and 30Y yields were 4.02%. The decrease of 70bp and 67bp, respectively, helped HTM portfolios.
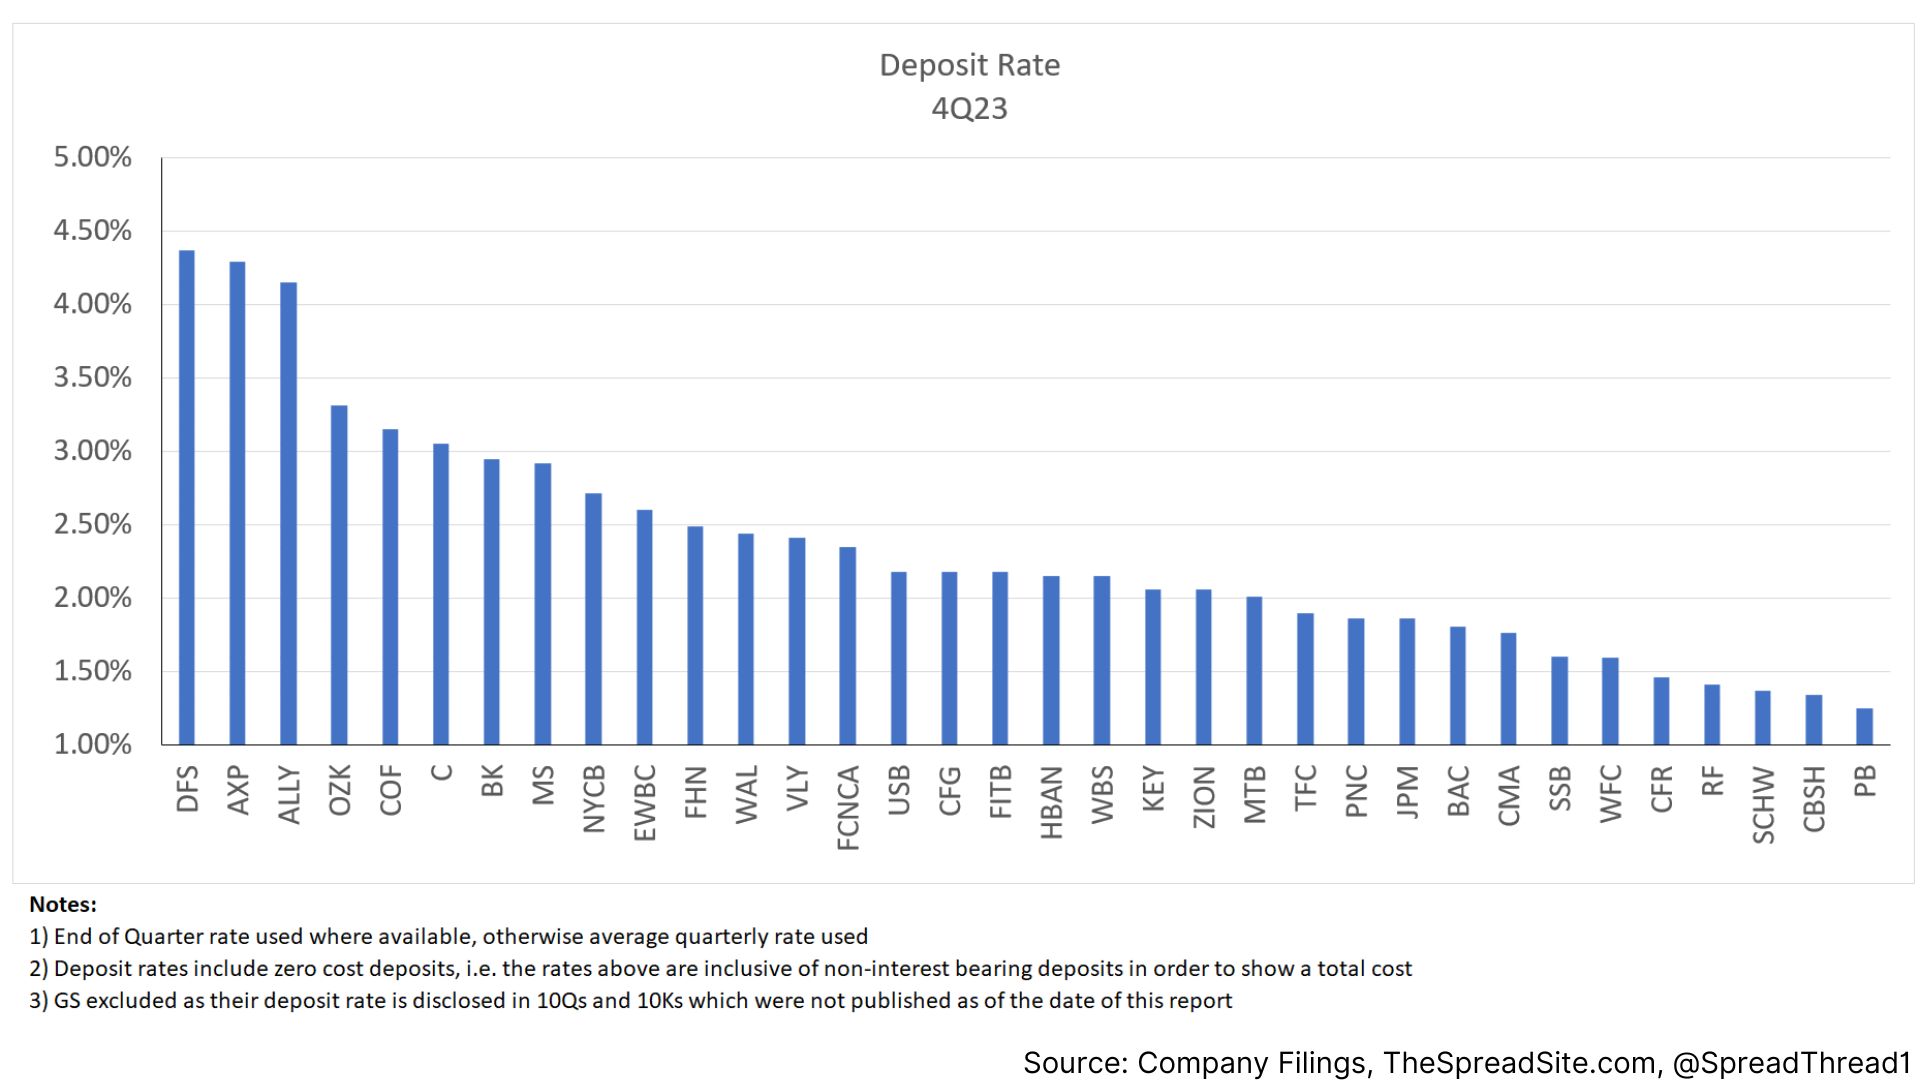
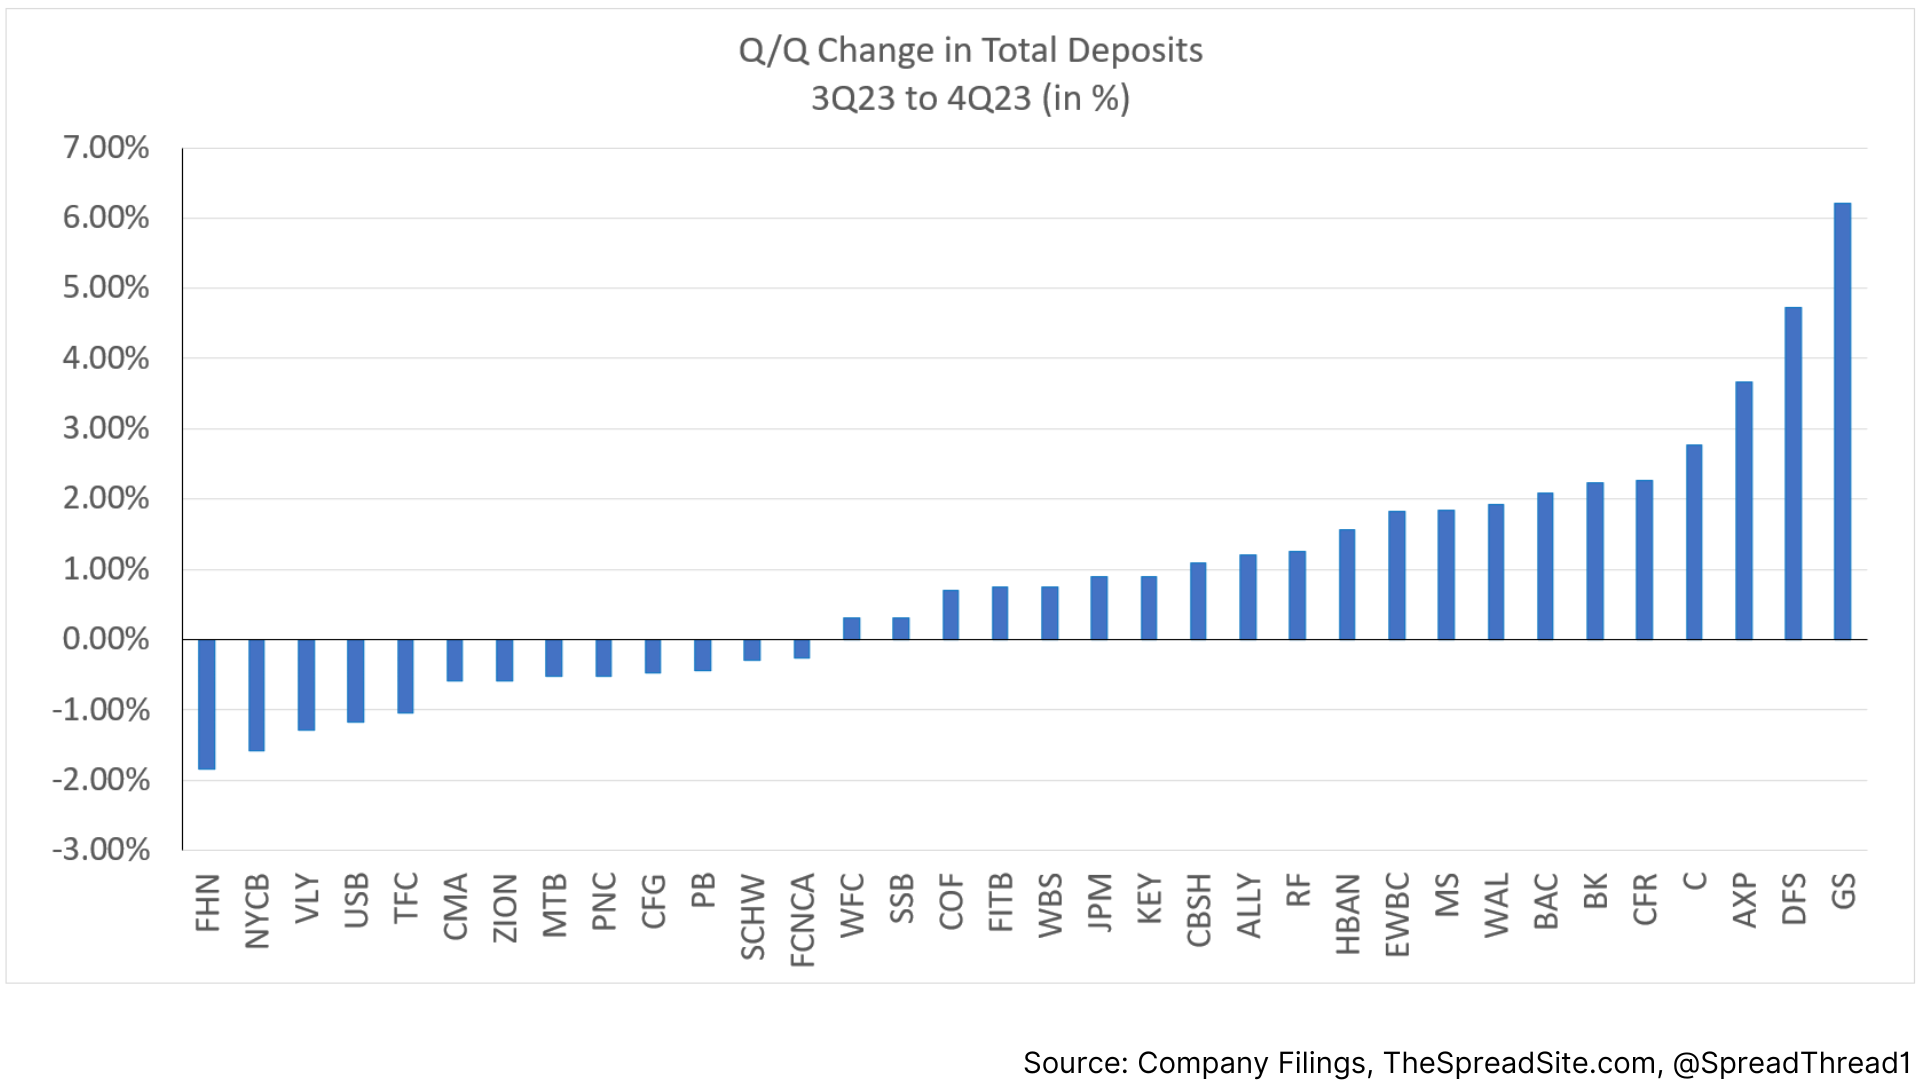
Deposit Data
We show deposit rates as of 4Q23 and the Q/Q change. We use end-of-period deposit rates where available and the average rate if the former isn't provided. We also note this data includes zero cost deposits.
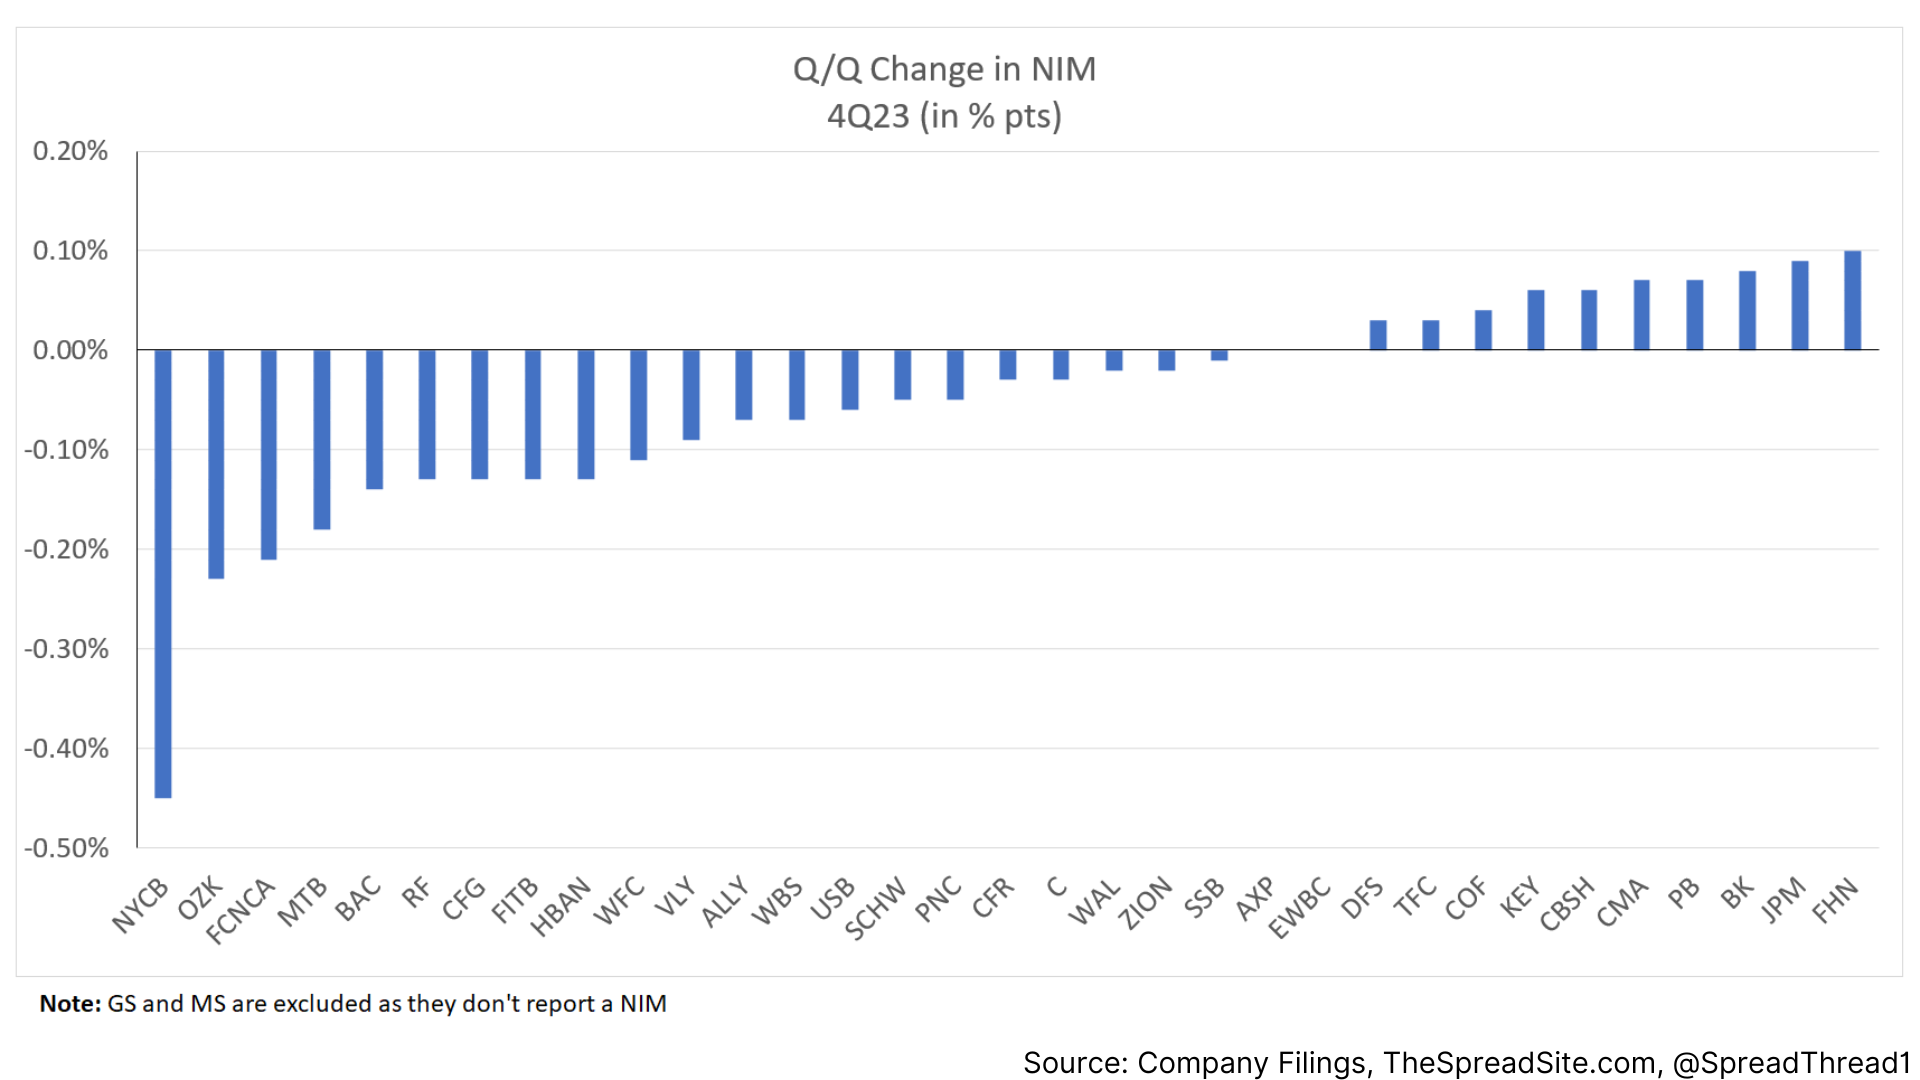
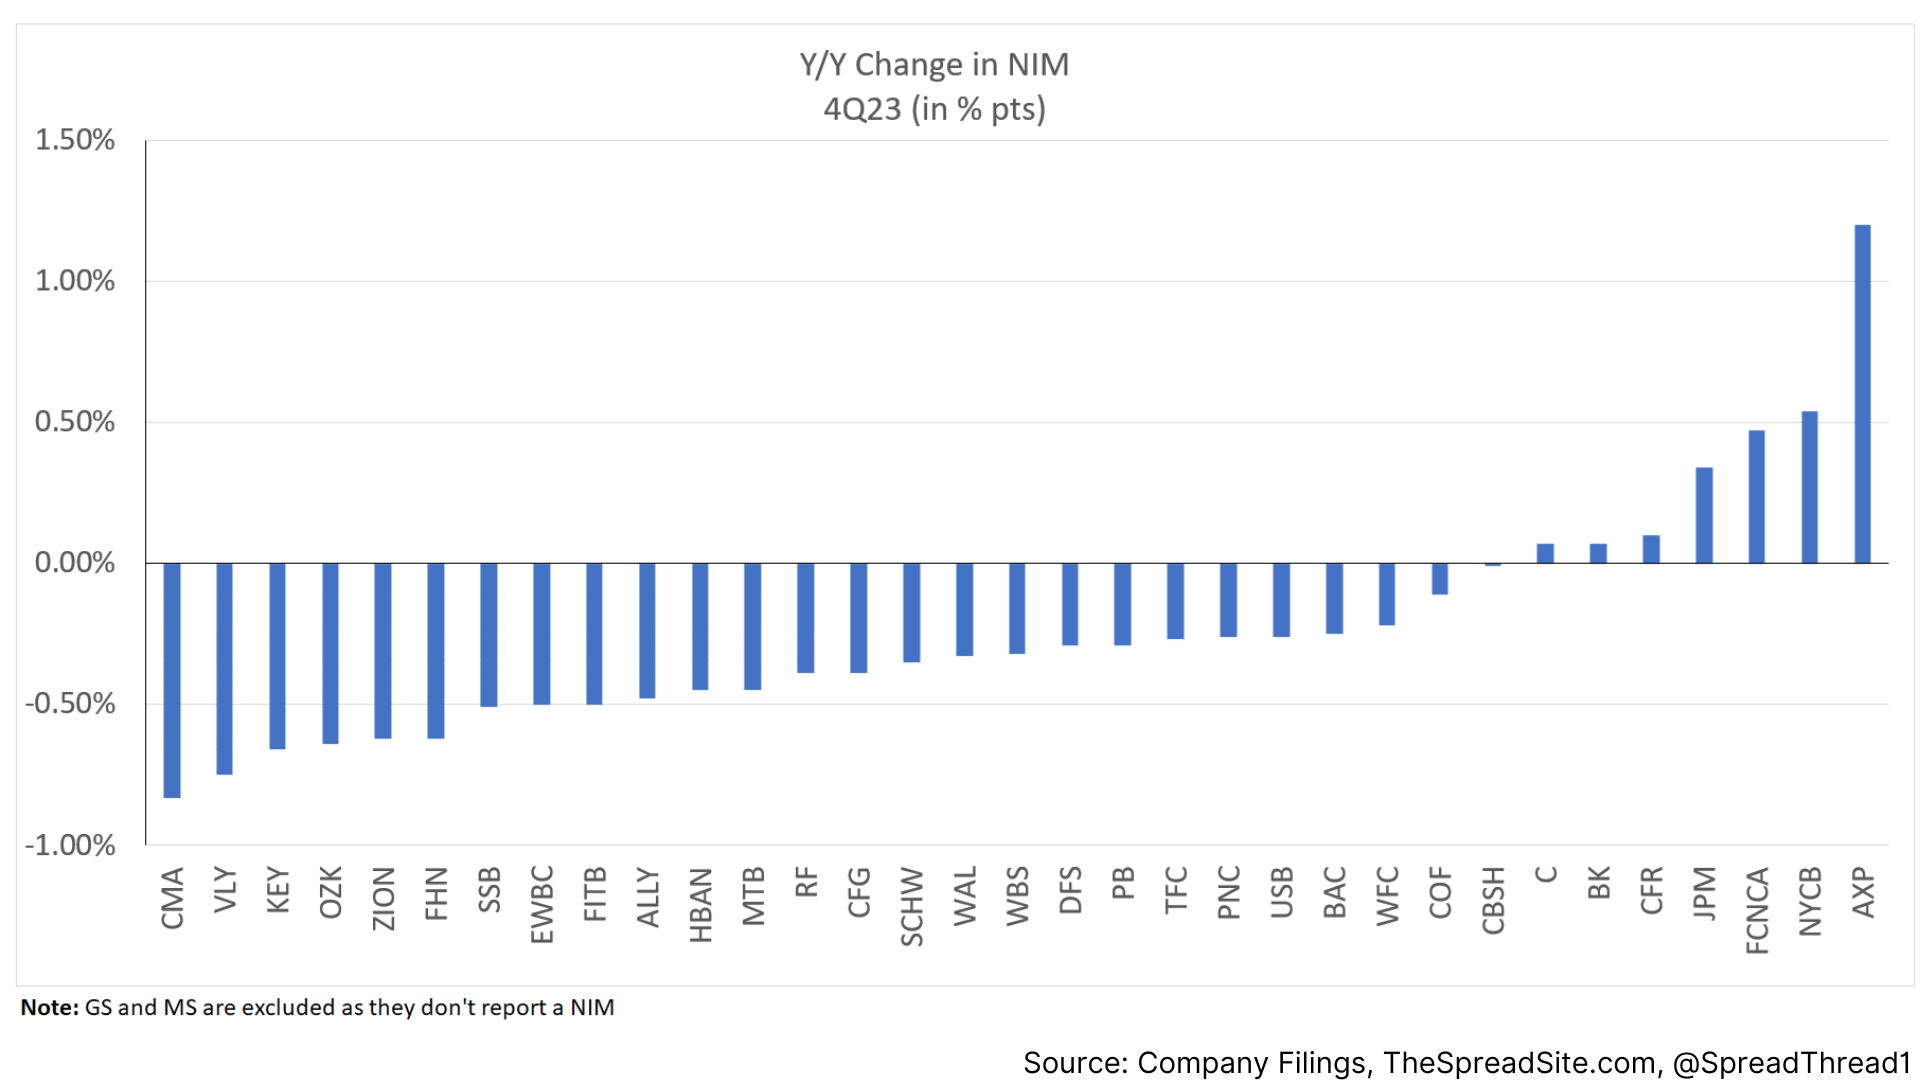
Net Interest Margin ("NIM")
Aside from a few outliers Q/Q (NYCB and OZK), NIMs remain balanced. On a Y/Y basis, they remain generally lower.
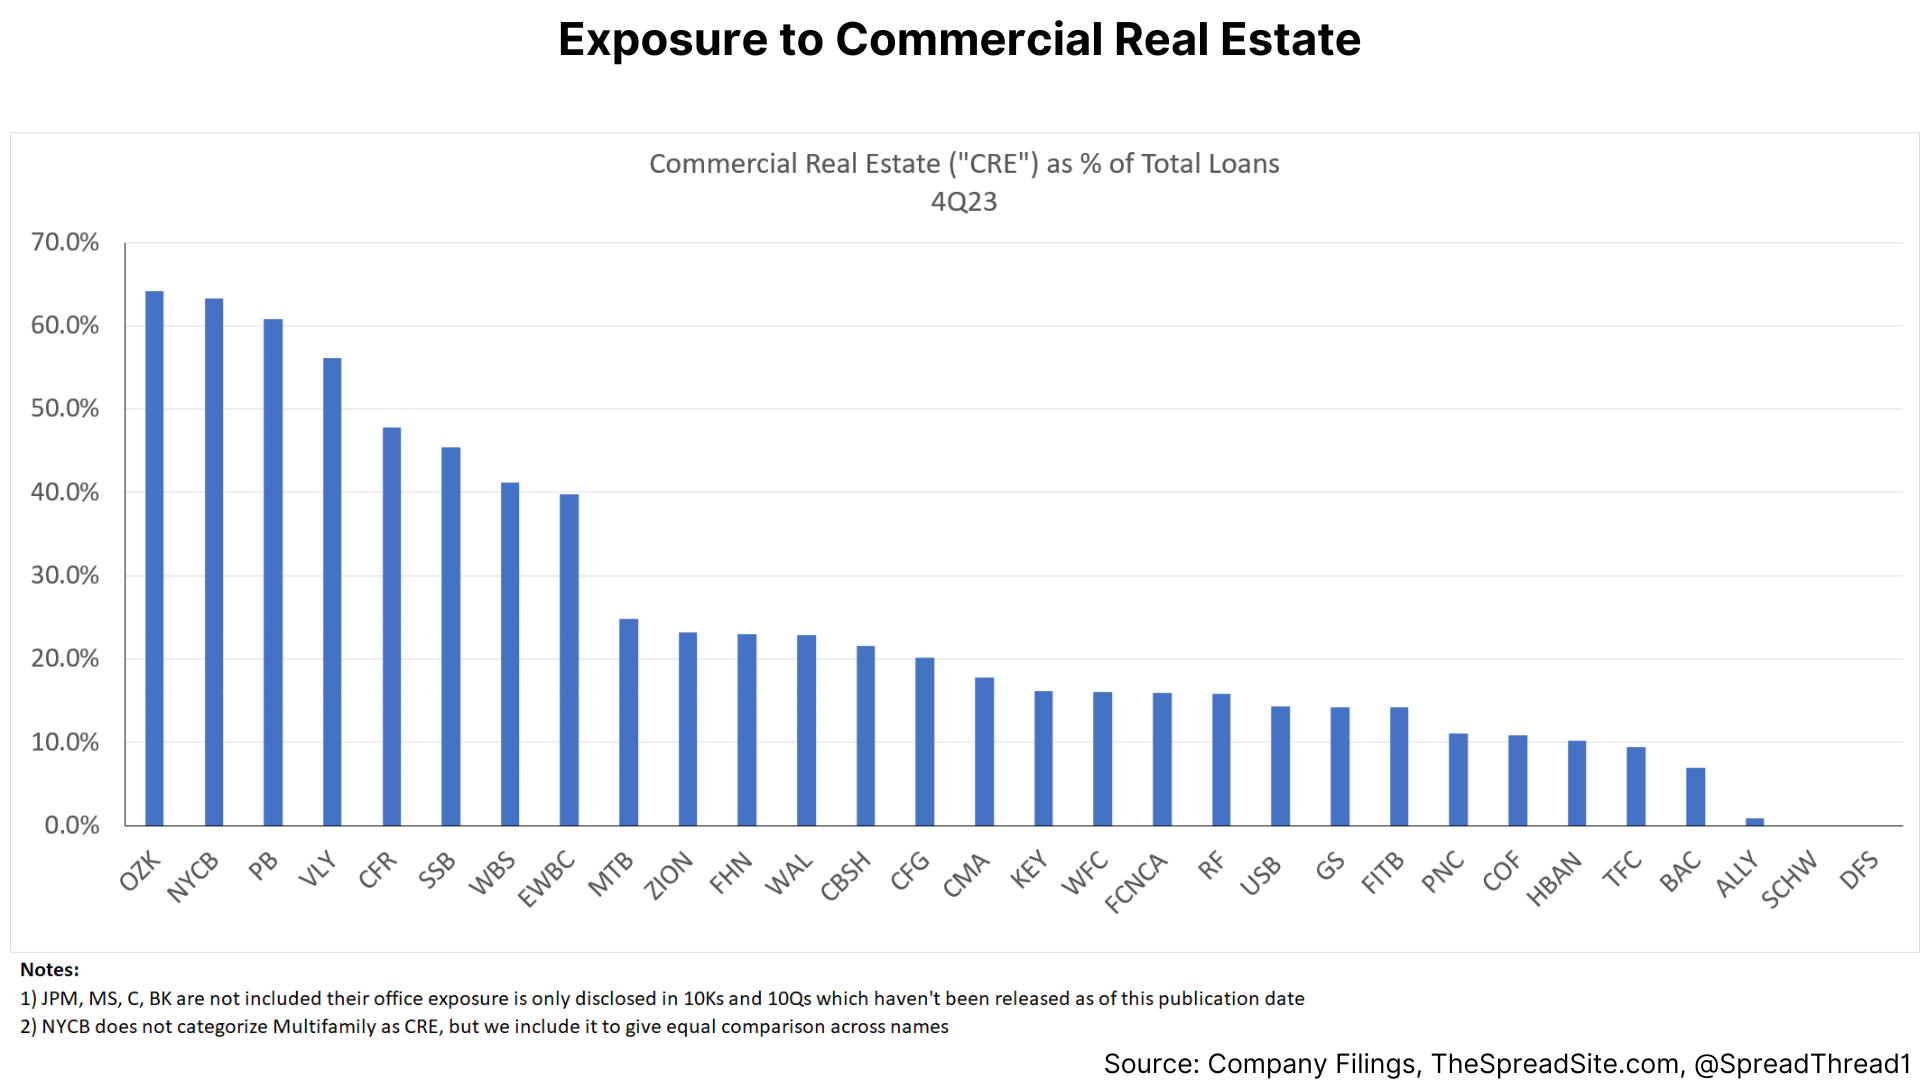
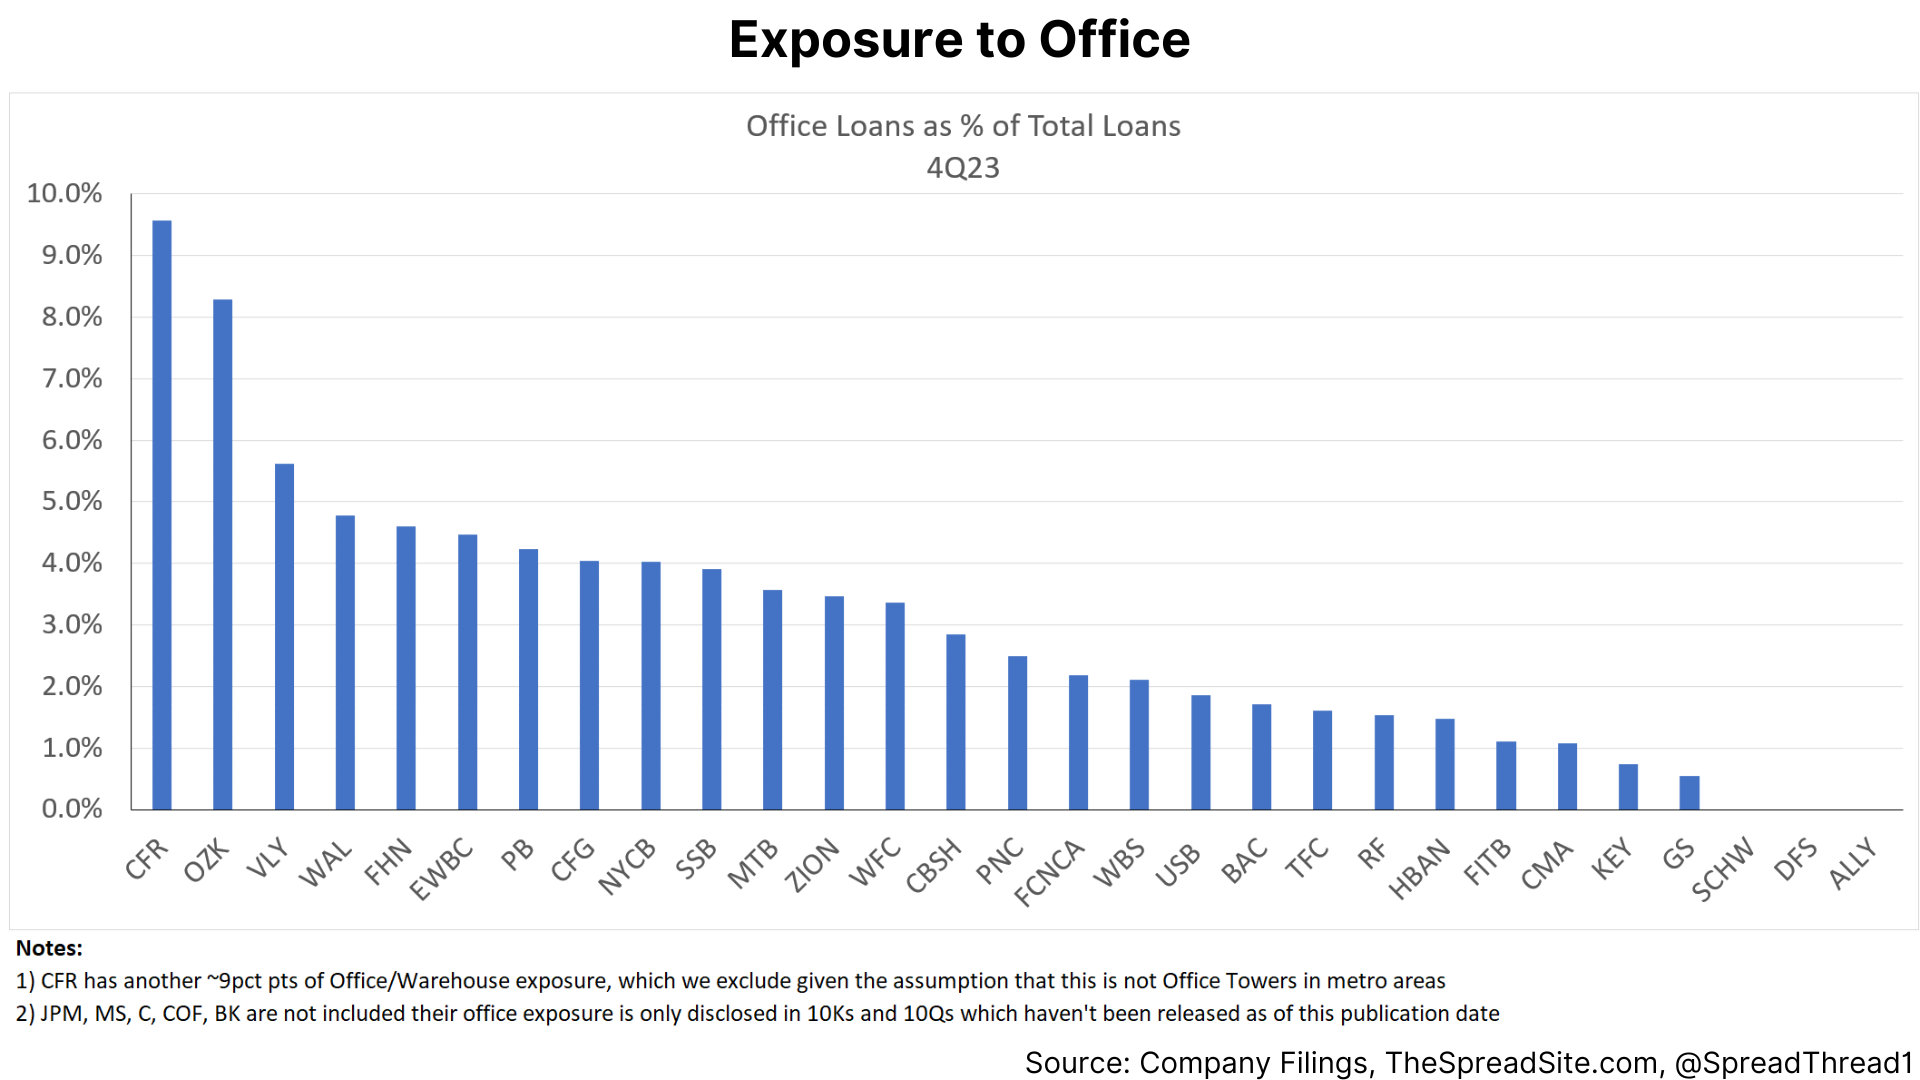
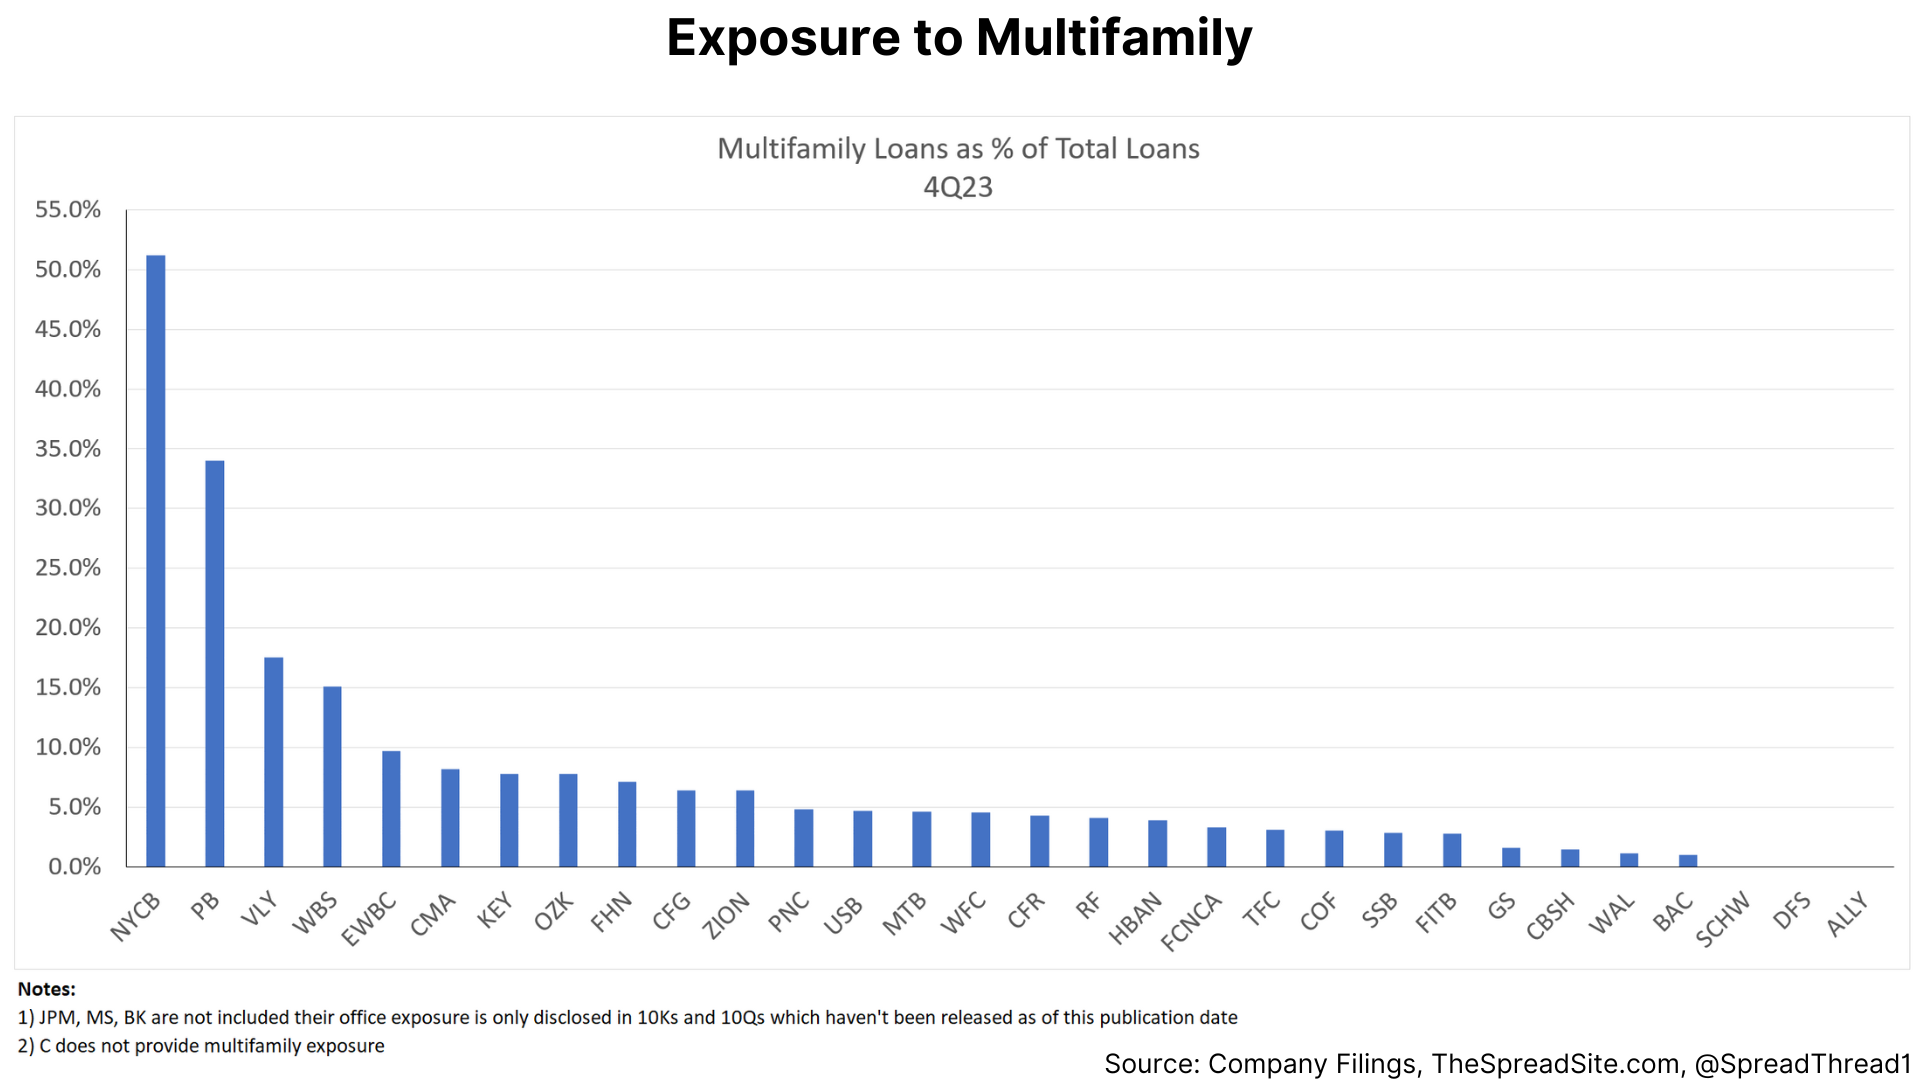
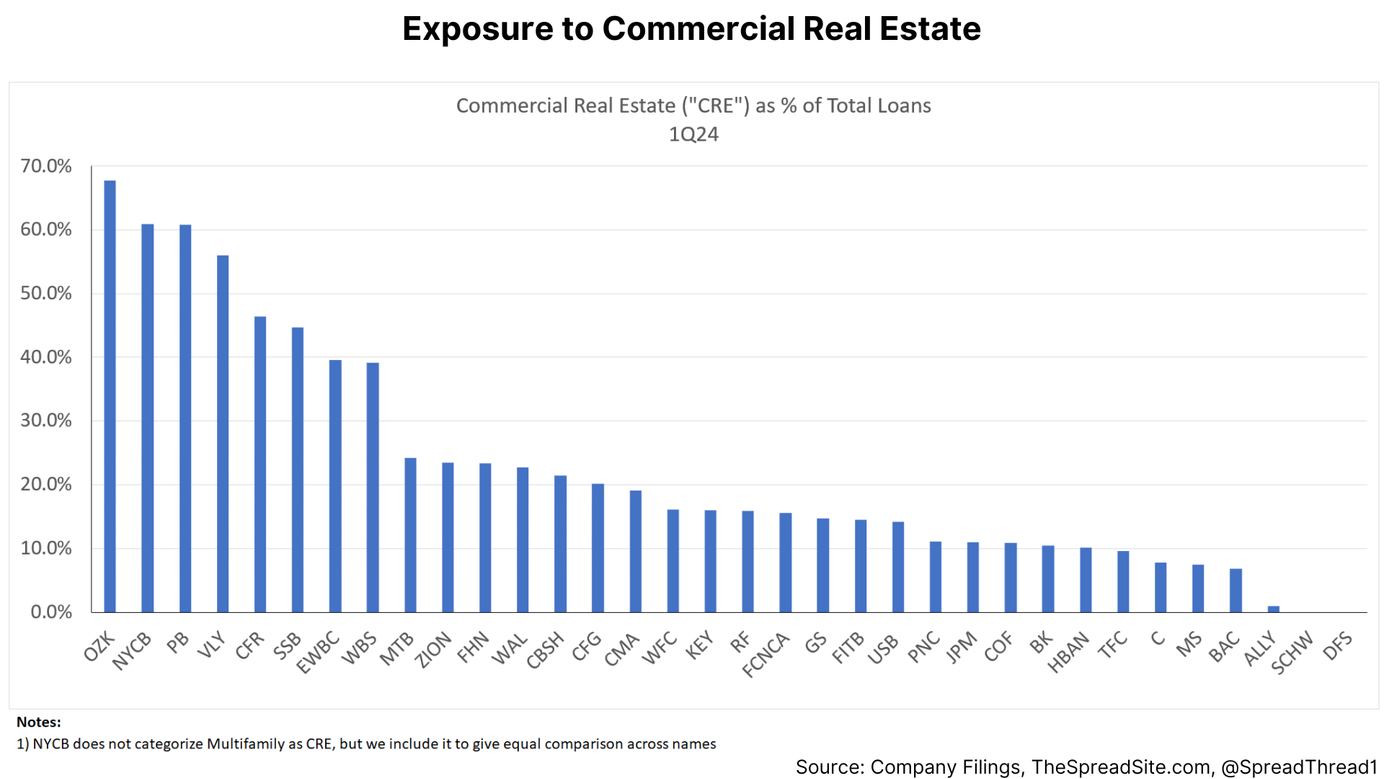
Loan Exposure by Category
In terms of commercial real estate ("CRE"), we show exposure to this category as a percent of total loans. We then show "Office" and "Multifamily" as CRE subsectors. We note that JPM, MS, C, and BK are left out as they only provide this data in 10Ks/ 10Qs, and as of 2/15/24, the 10Ks have not been filed.
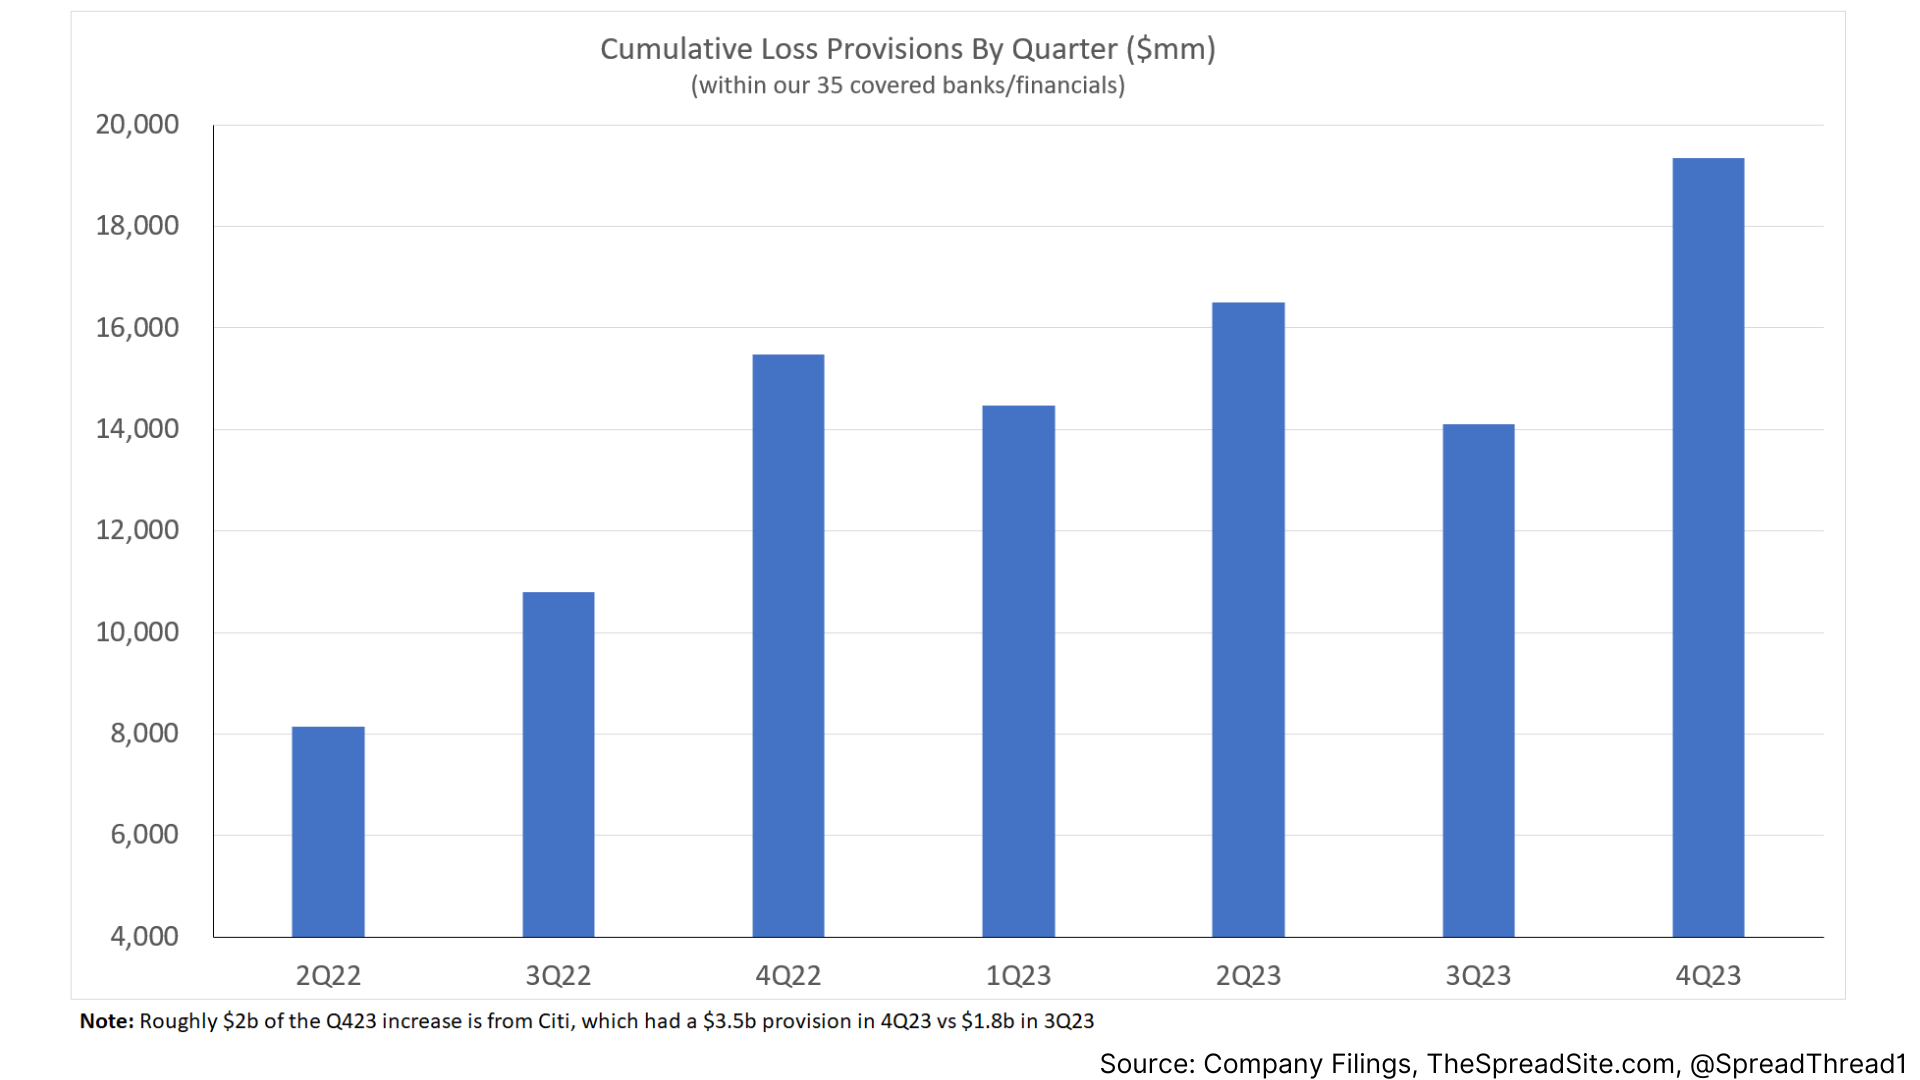
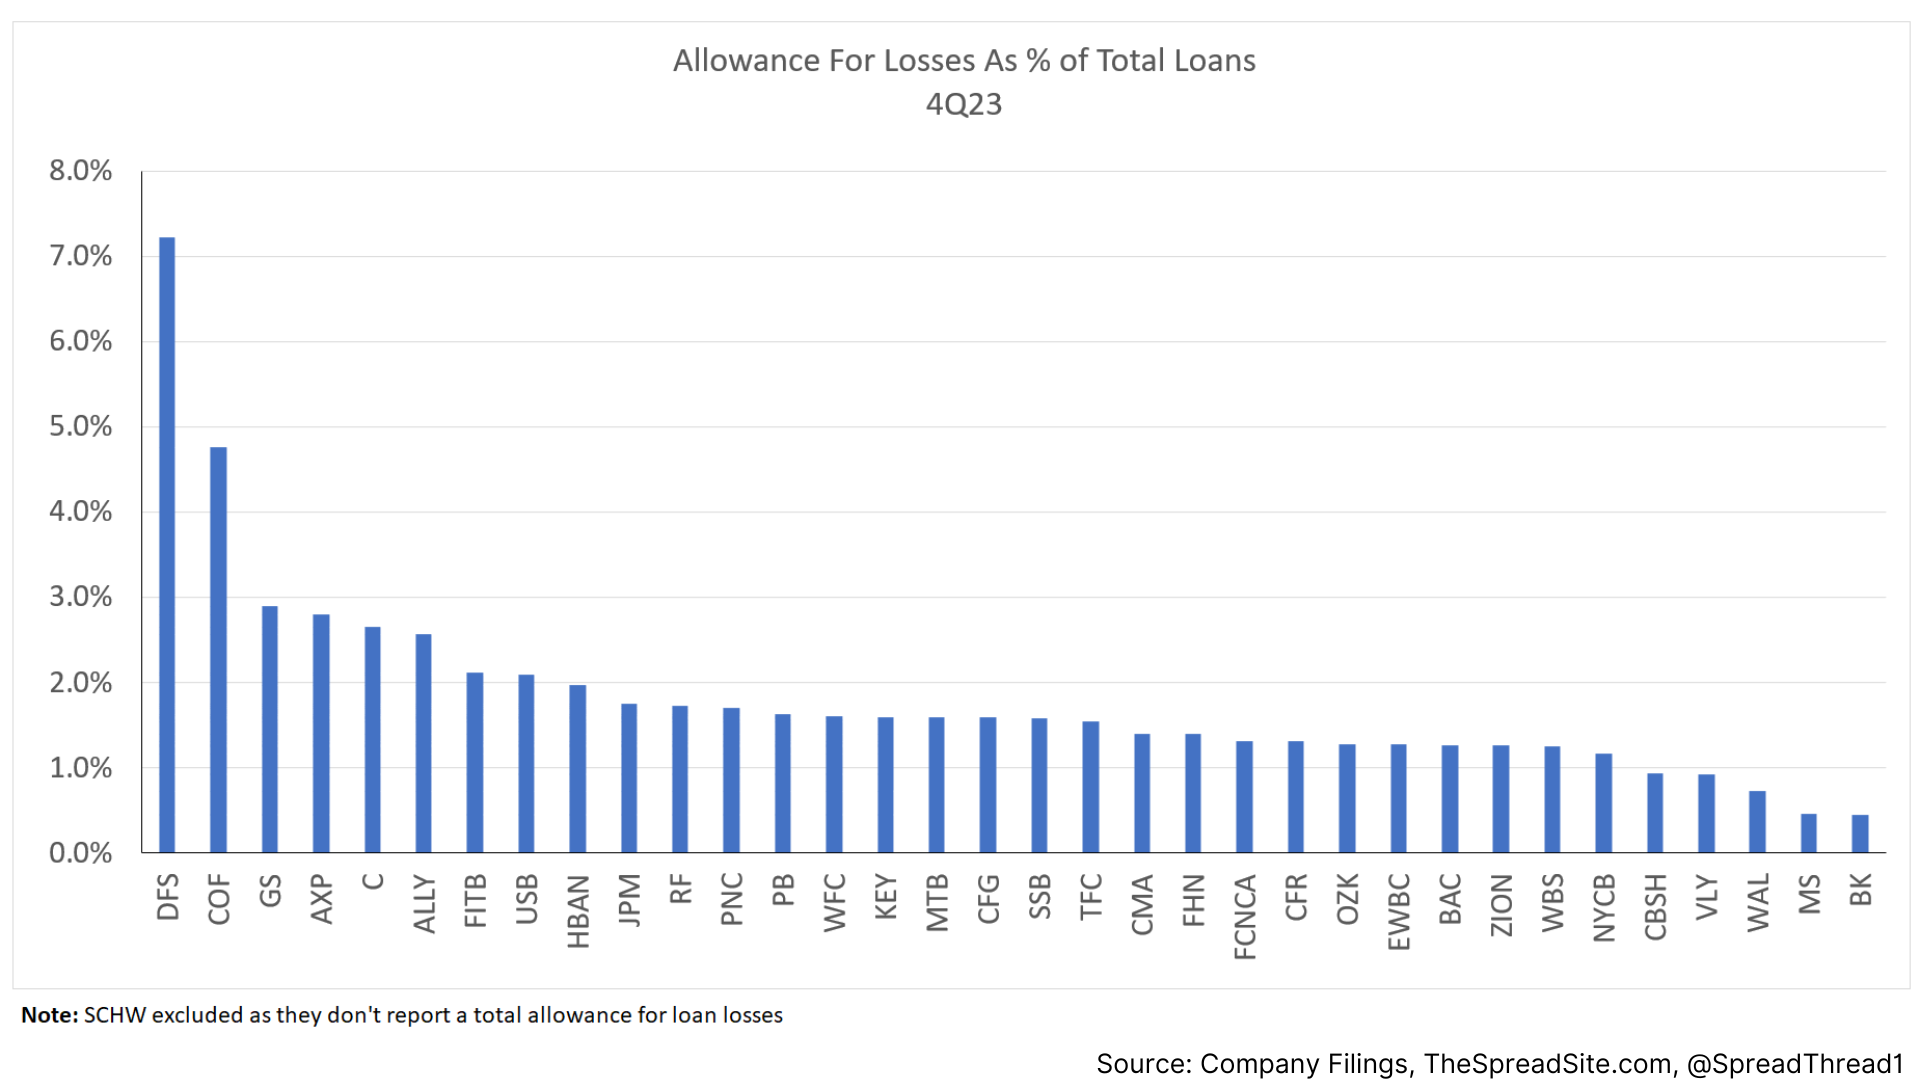
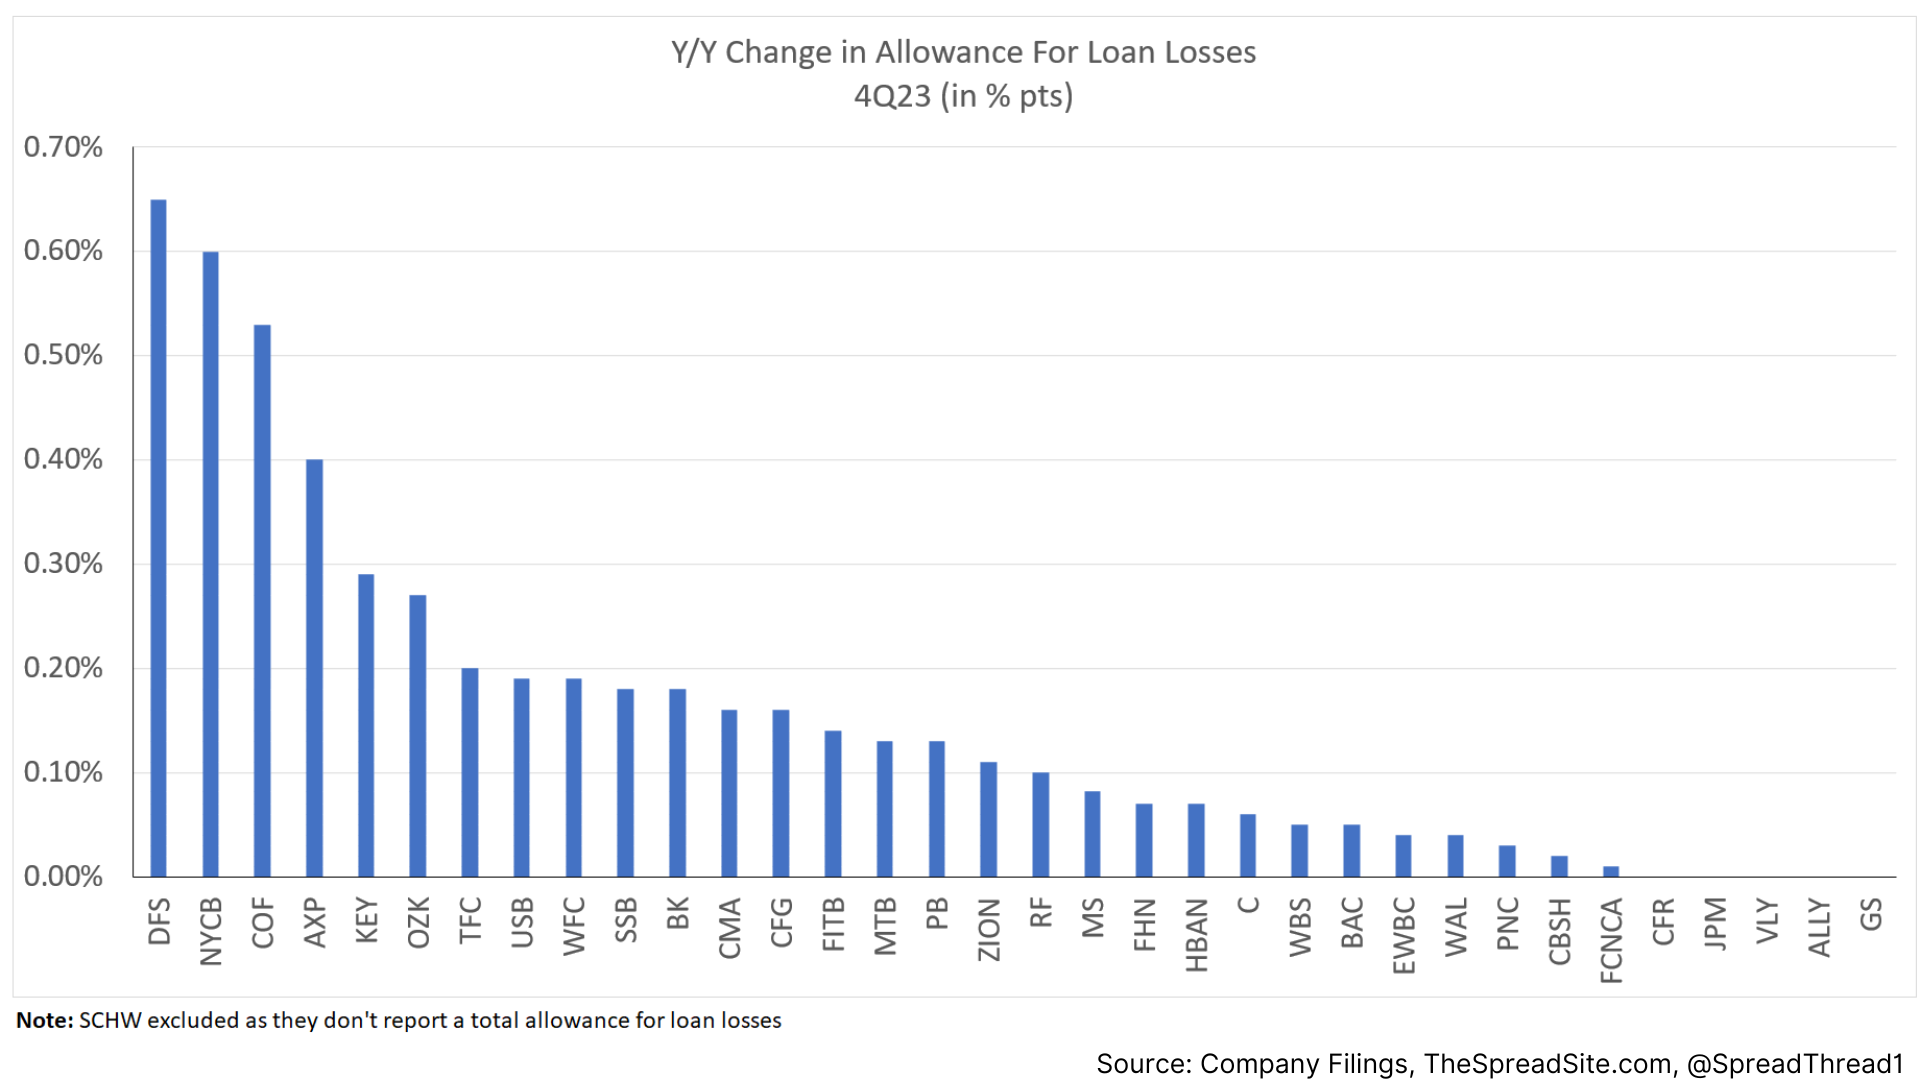
Loss Provisions & Allowances
Credit provisions were higher Q/Q, but we note ~$2b of the increase was from Citigroup.
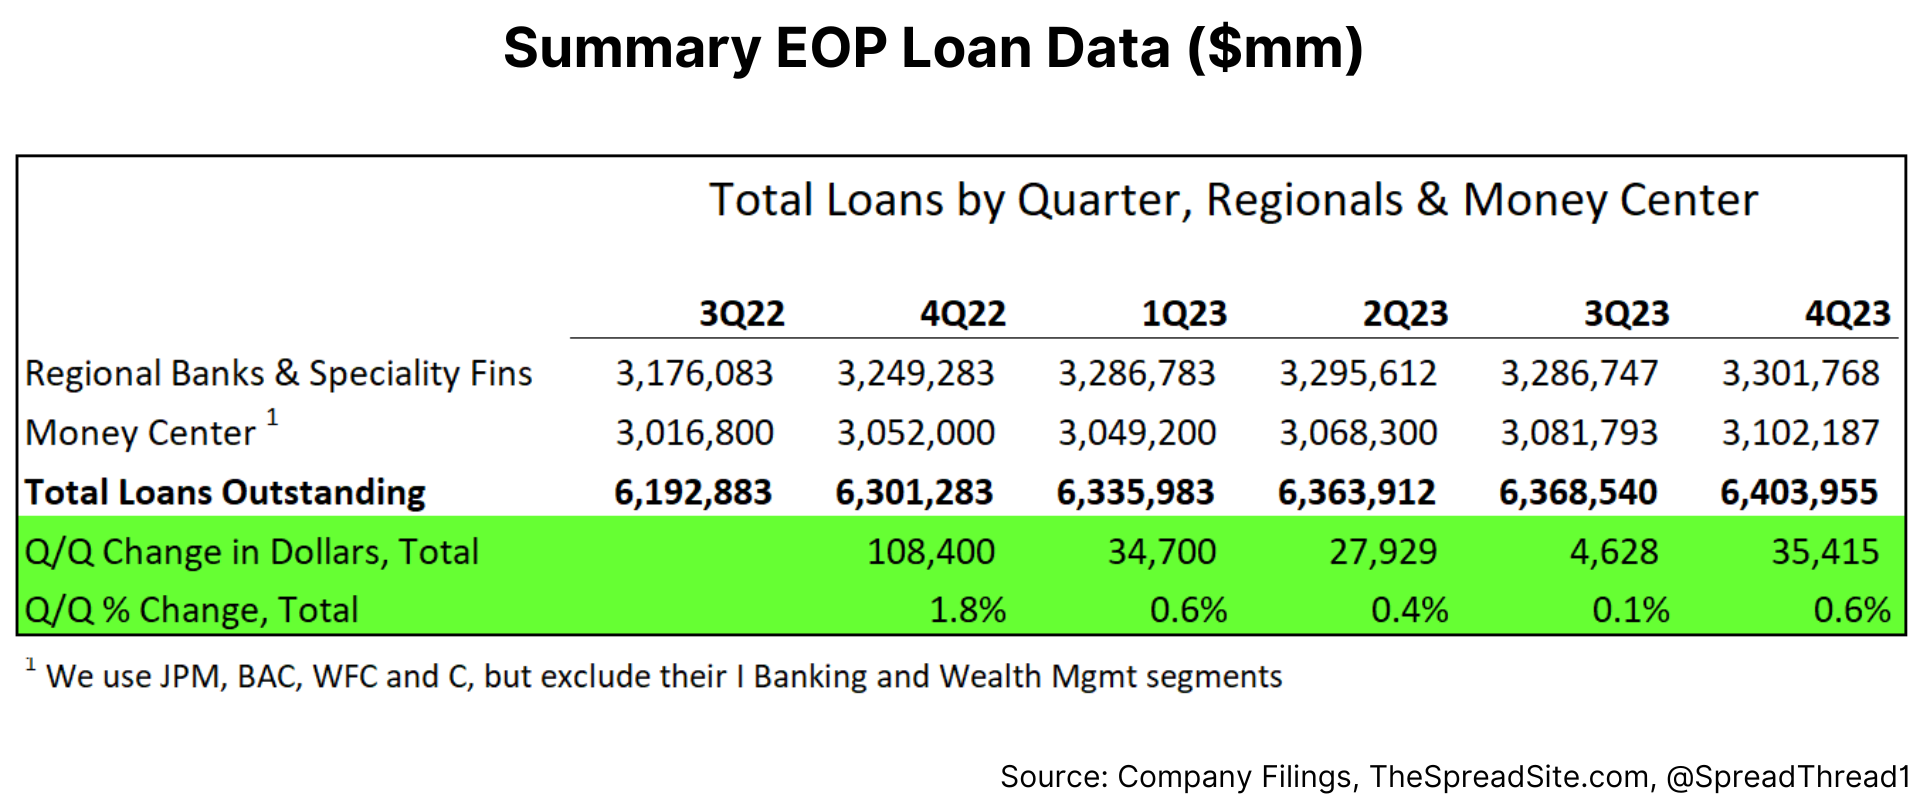
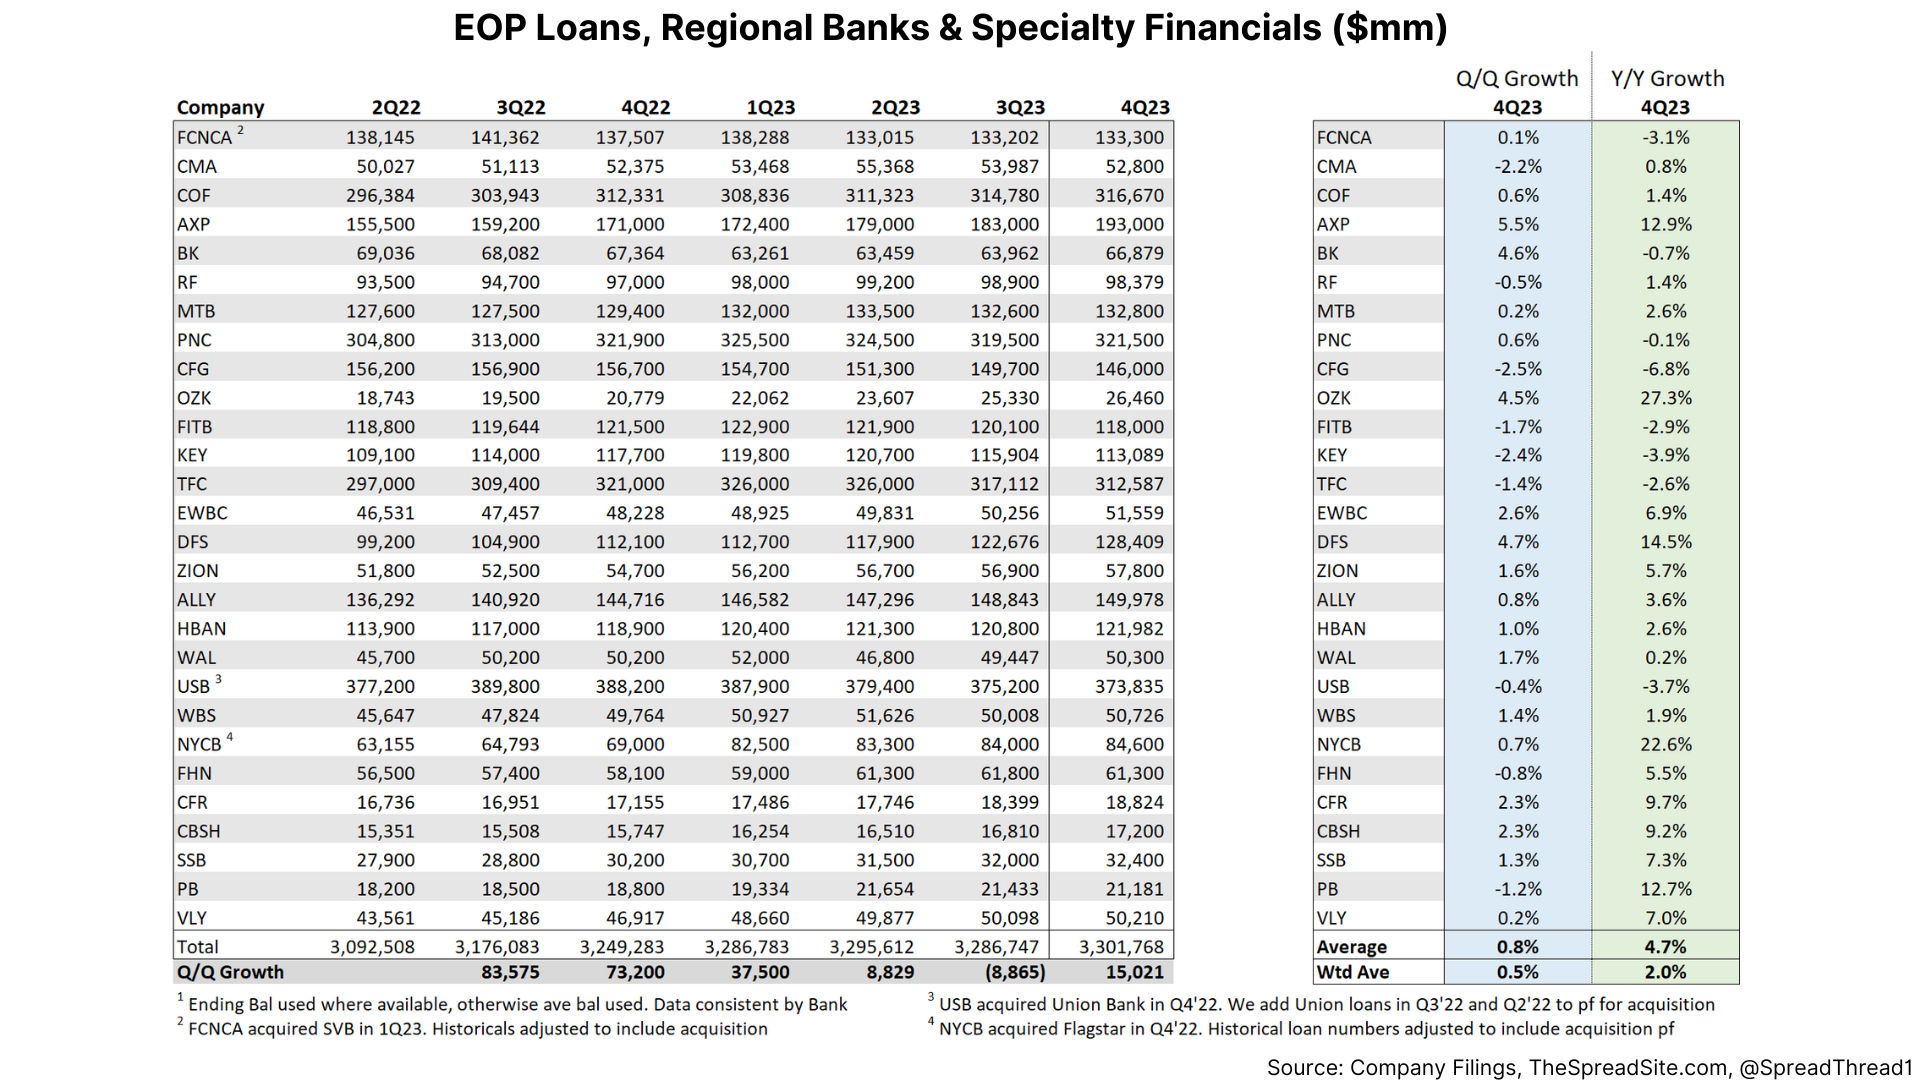
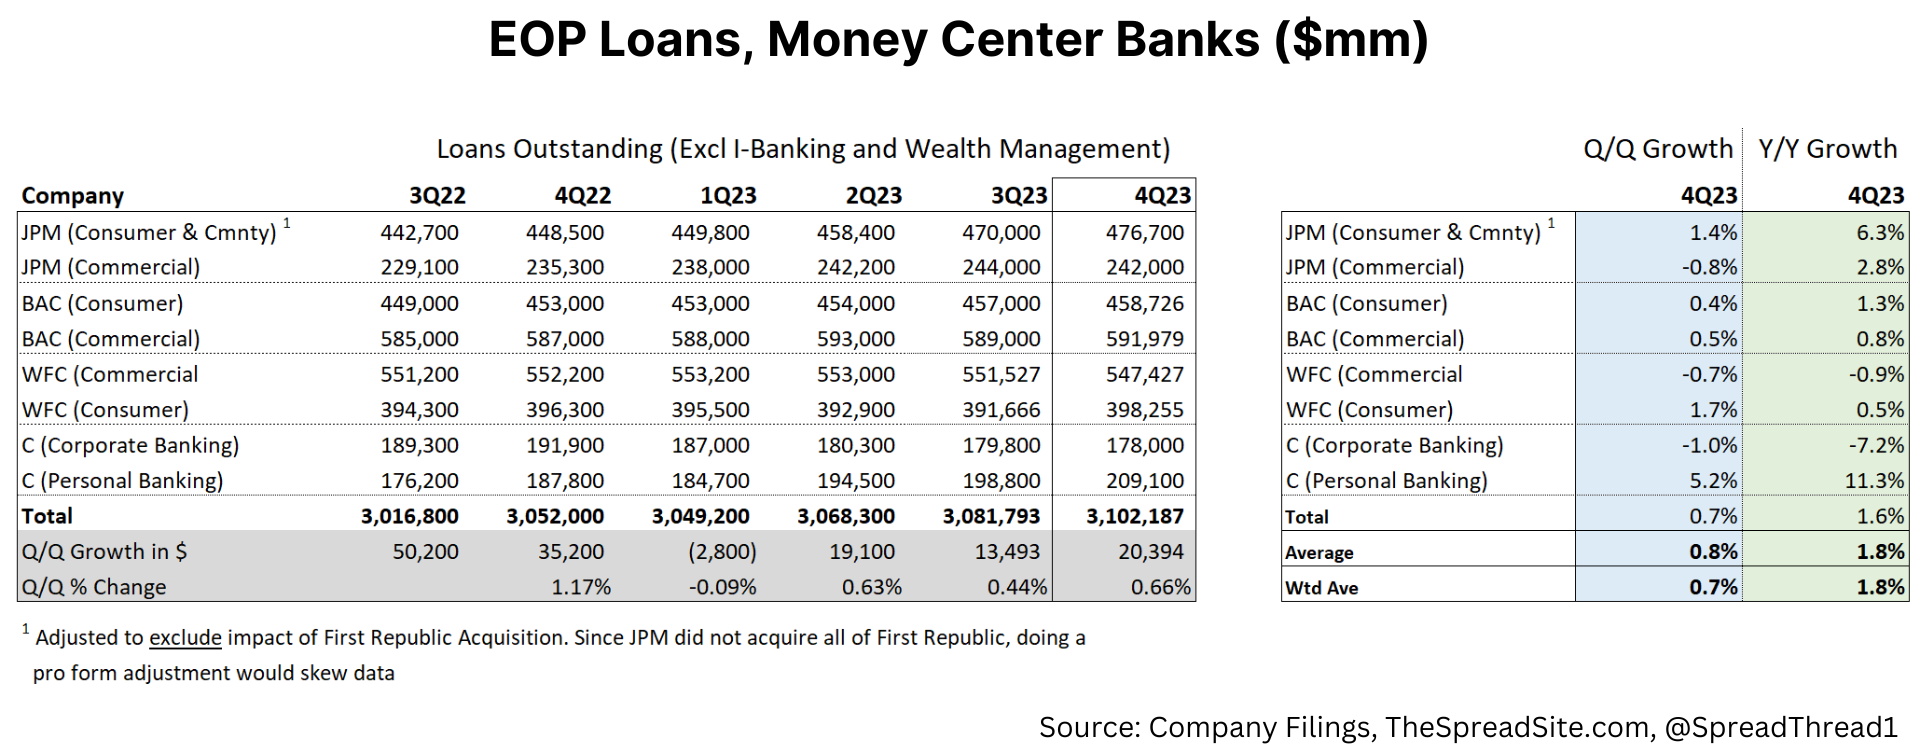
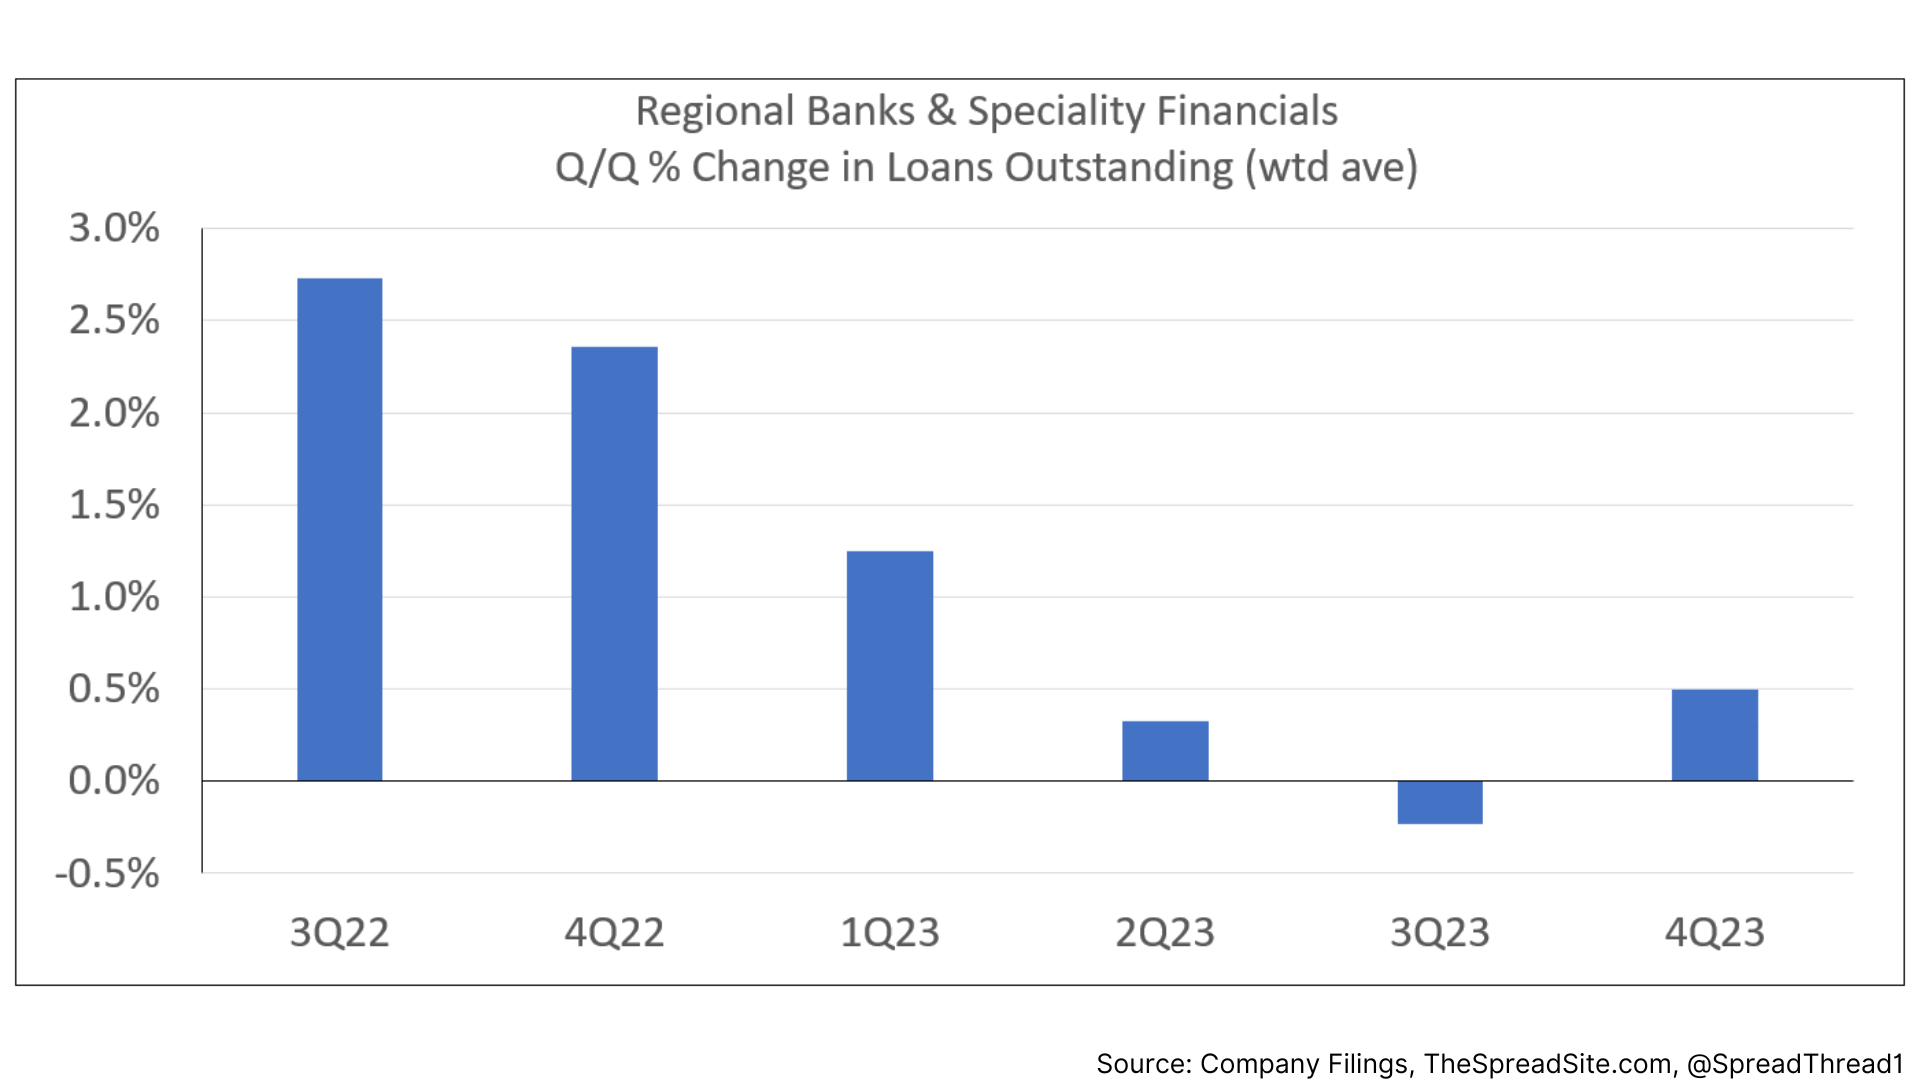
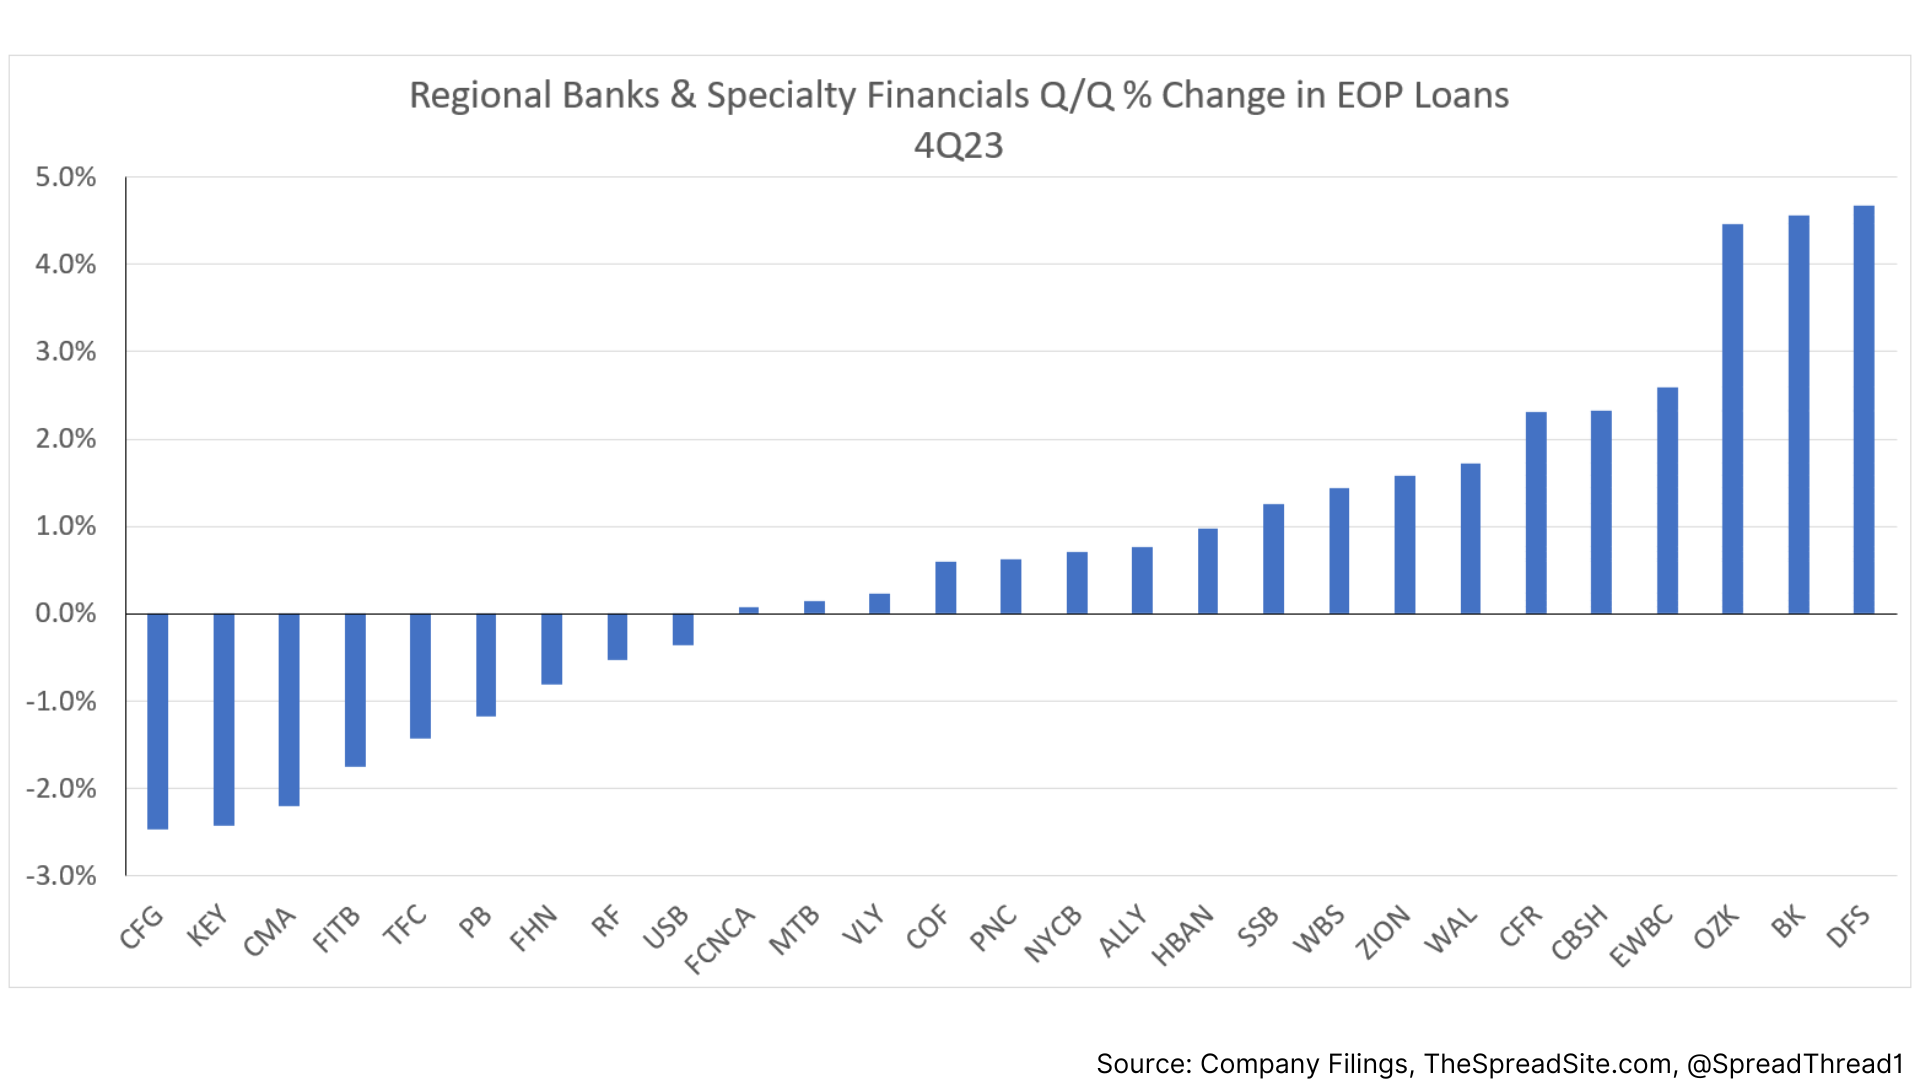
Loan Growth
Lastly, we look at end of period ("EOP") loans outstanding (ave balances used if EOP data unavailable), which increased slightly on a Q/Q basis. The largest percent increase came from DFS, which is primarily a credit card company.
Disclosures
Please click here to see our standard legal disclosures.
The Spread Site Research
Receive our latest publications directly to your inbox. Its Free!.


