Closed End Funds: An Overview, Risks and Opportunities
Summary
- Given how much rates have risen, the Closed End Fund (“CEF”) asset class is becoming more interesting. We walk through CEFs in detail, discussing their structure, how they trade, ways they differ from mutual funds or ETFs, highlight some risks facing this sector, and end with a few recommendations.
- A key difference inherent in CEFs is they can trade at a premium or discount to Net Asset Value (“NAV”) as share price is determined based on supply and demand. We discuss this nuance and look for opportunities in CEFs with large discounts relative to their own history.
- CEFs can use leverage (usually short-term) to enhance returns, but this can become problematic in an environment like today, where short-term rates rise quickly and the yield curve inverts. We describe CEF leverage in detail and associated risks.
- Within our checklist used for analyzing CEFs, a few high grade muni CEFs look attractive. Specifically, tickers “NUV” and “LEO” as they are composed of long duration, high grade municipals, trade cheap to NAV, and can cover their dividend assuming spot interest rates.
Introduction
As rates continue to rise and volatility starts to pick up, opportunities in Closed End Funds ("CEFs") may improve, especially for smaller, less liquidity constrained investors. In order to understand the space better, we walk through CEFs in detail, discussing their structure, how they trade, ways they differ from mutual funds or Exchange Trade Funds (“ETFs”) and highlight some risks facing this sector. Furthermore, as a follow-up to our last publication (Duration On Sale,) we highlight a few specific opportunities within the muni CEF space.
An Overview of Closed End Funds
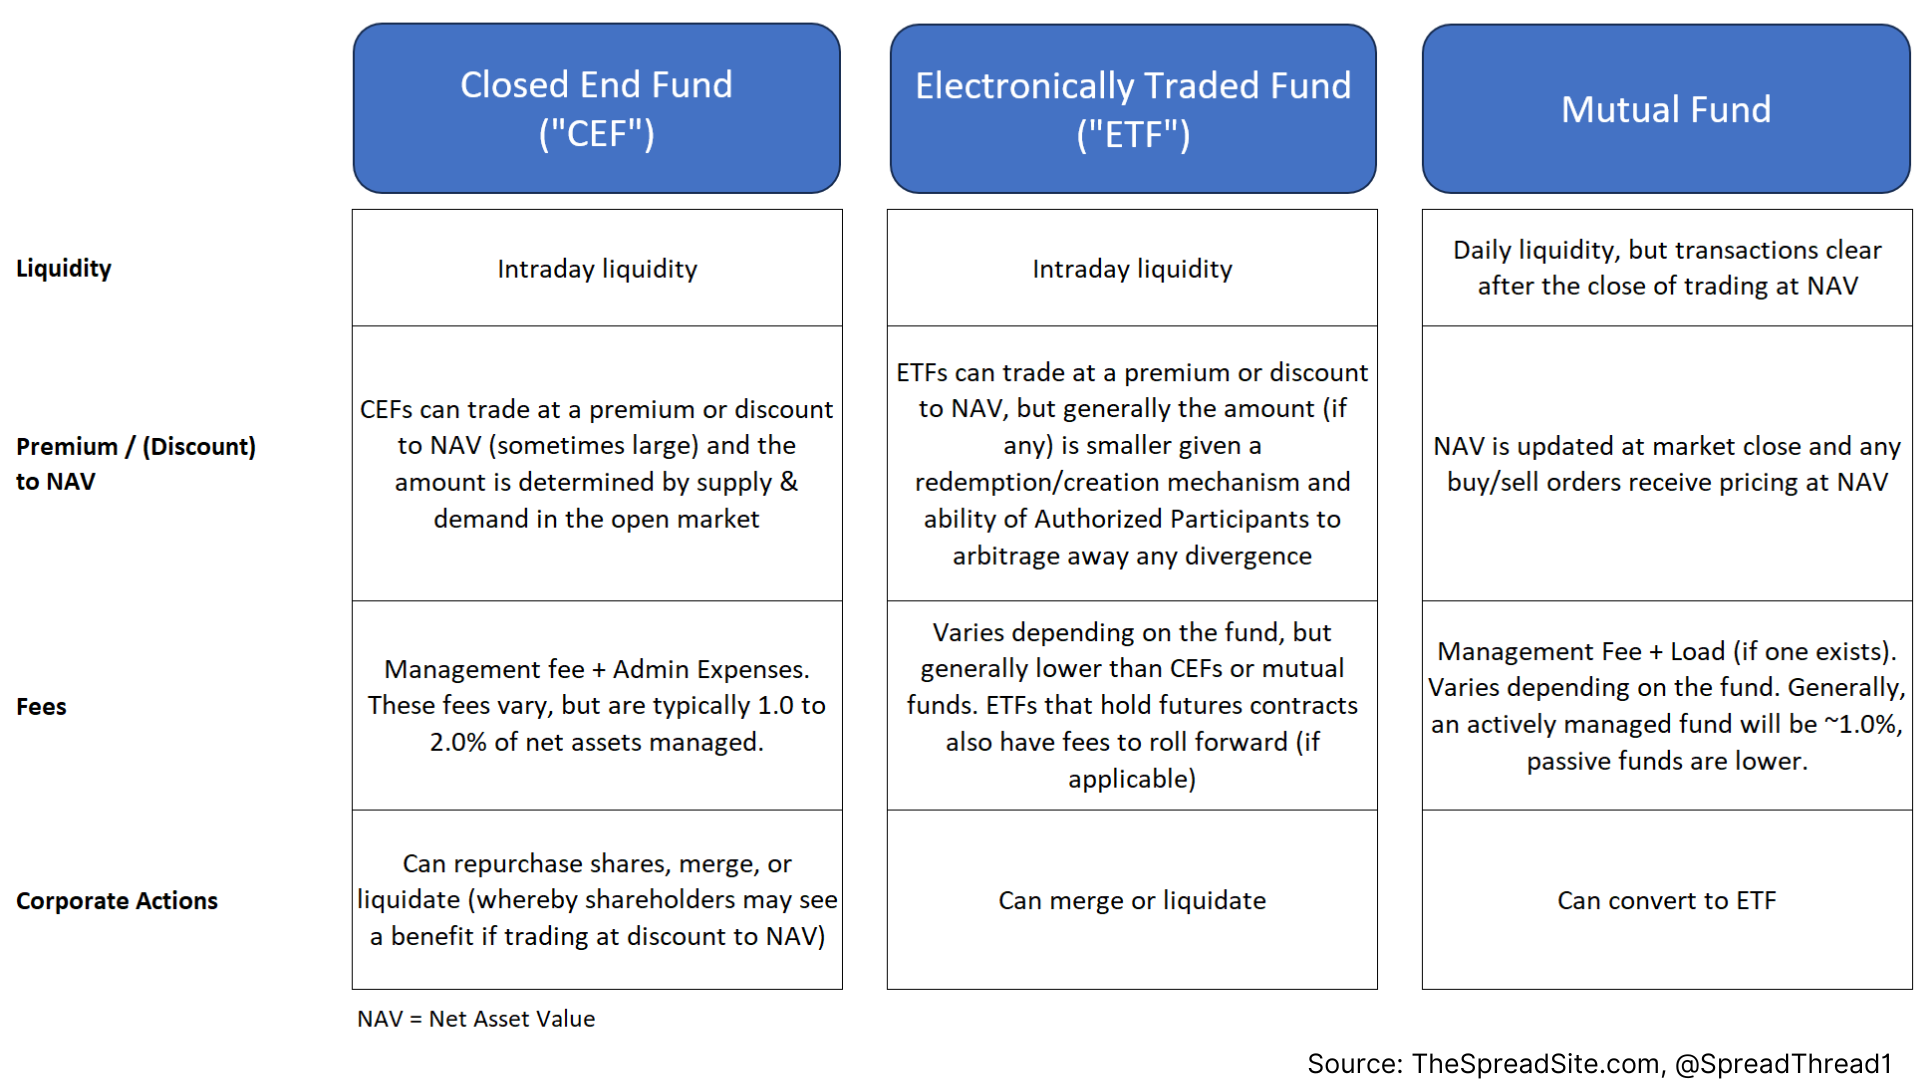
A CEF is simply a portfolio of professionally managed investments with publicly traded shares of equity. Any investor wishing to buy a CEF can do so by transacting in the open market intraday at the prevailing market price.
CEFs are different from ETFs and Mutual Funds in a few key ways. First, once a CEF is created and does an IPO, they no longer receive inflows or outflows of capital from investors. It is possible for a CEF to issue additional shares through a secondary offering, but this is rare. Typically, the initial money raised at IPO serves as the permanent capital base. Consequently, the market price is determined by supply and demand and causes CEFs to trade at premiums or discounts to their underlying Net Asset Value (“NAV”), which is reported daily.
Below we show a table illustrating some basic characteristics across CEFs, ETFs and Mutual Funds.
While a CEF can technically hold any type of asset allowed by its Investment Objective, they tend to be income focused with the majority investing in loans, bonds, municipals, preferreds and mortgages.
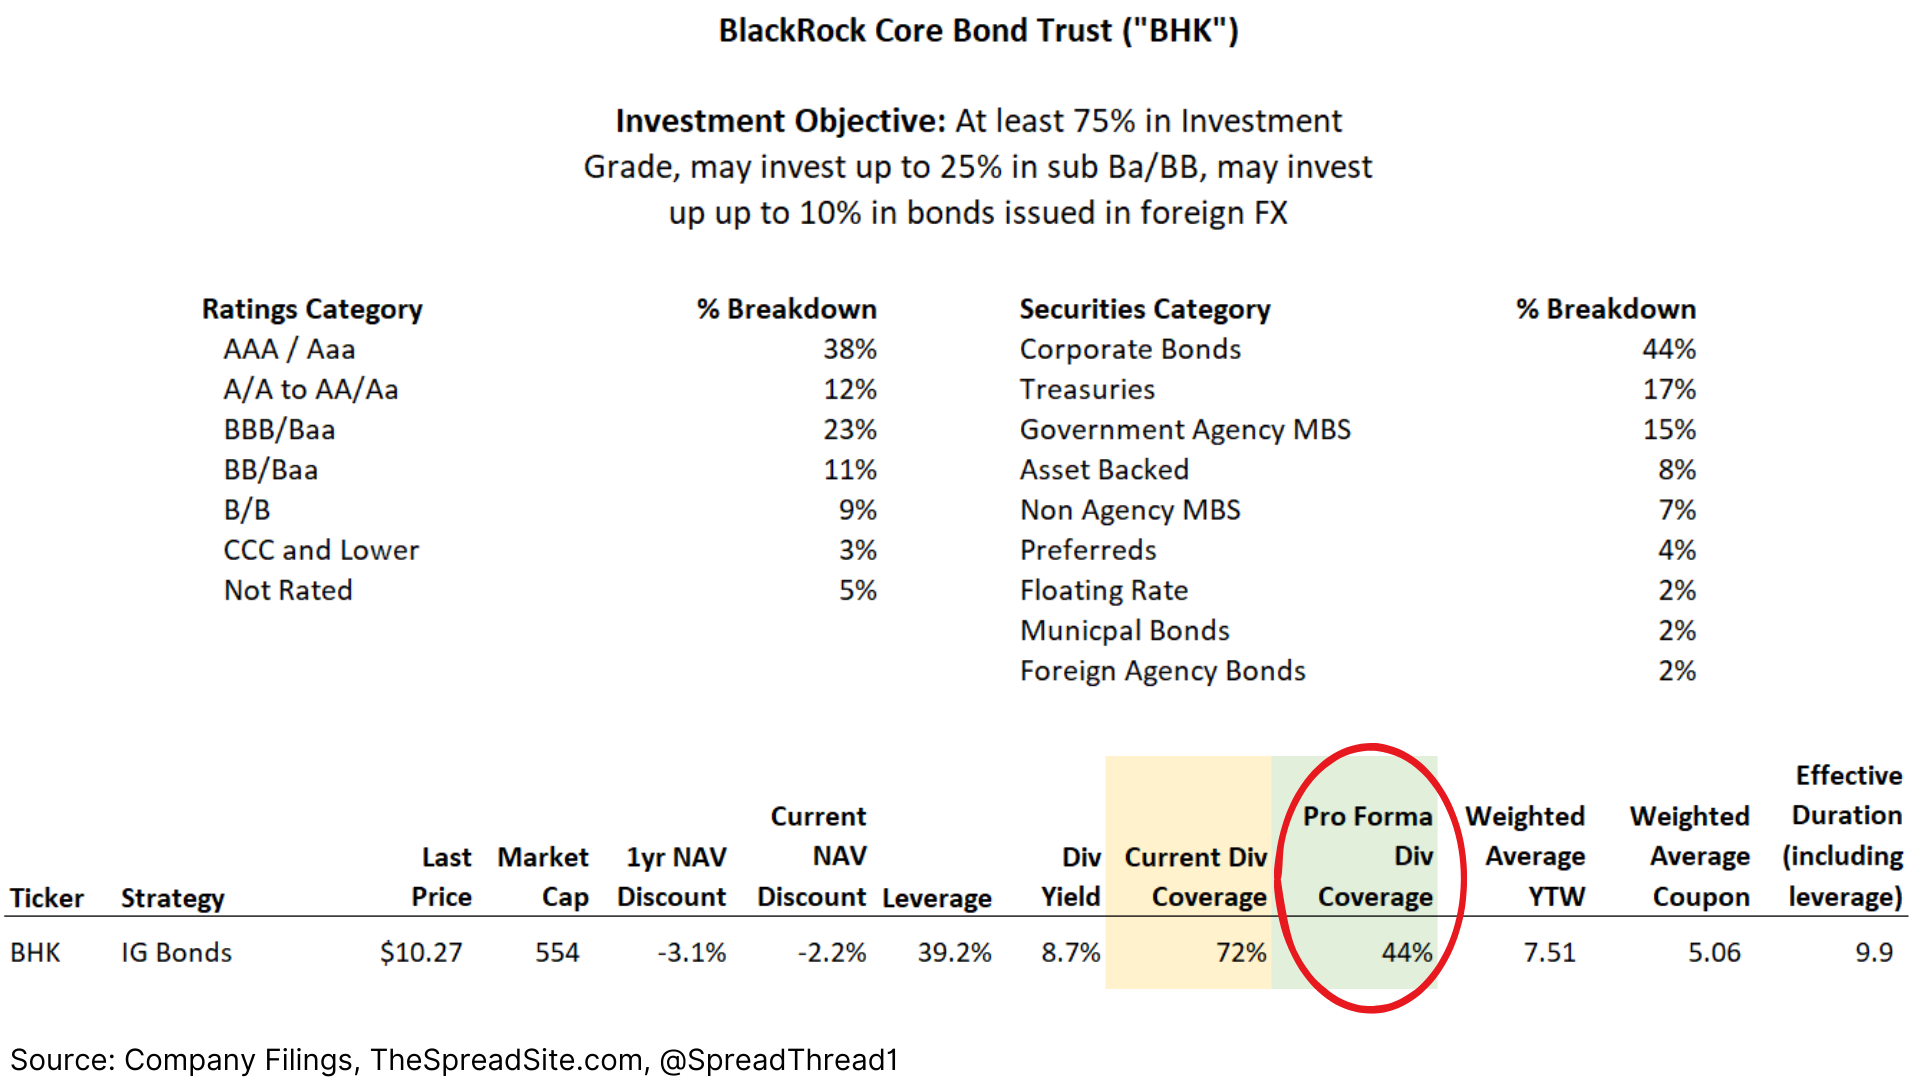
The Investment Objective (vast majority of CEFs have one) will state the general category of assets held by the CEF and will also provide guidelines around how much leverage is allowed and areas where they can stray from the main asset class. We show an example from a BlackRock CEF (some parts removed for brevity), with a few key areas underlined by us.
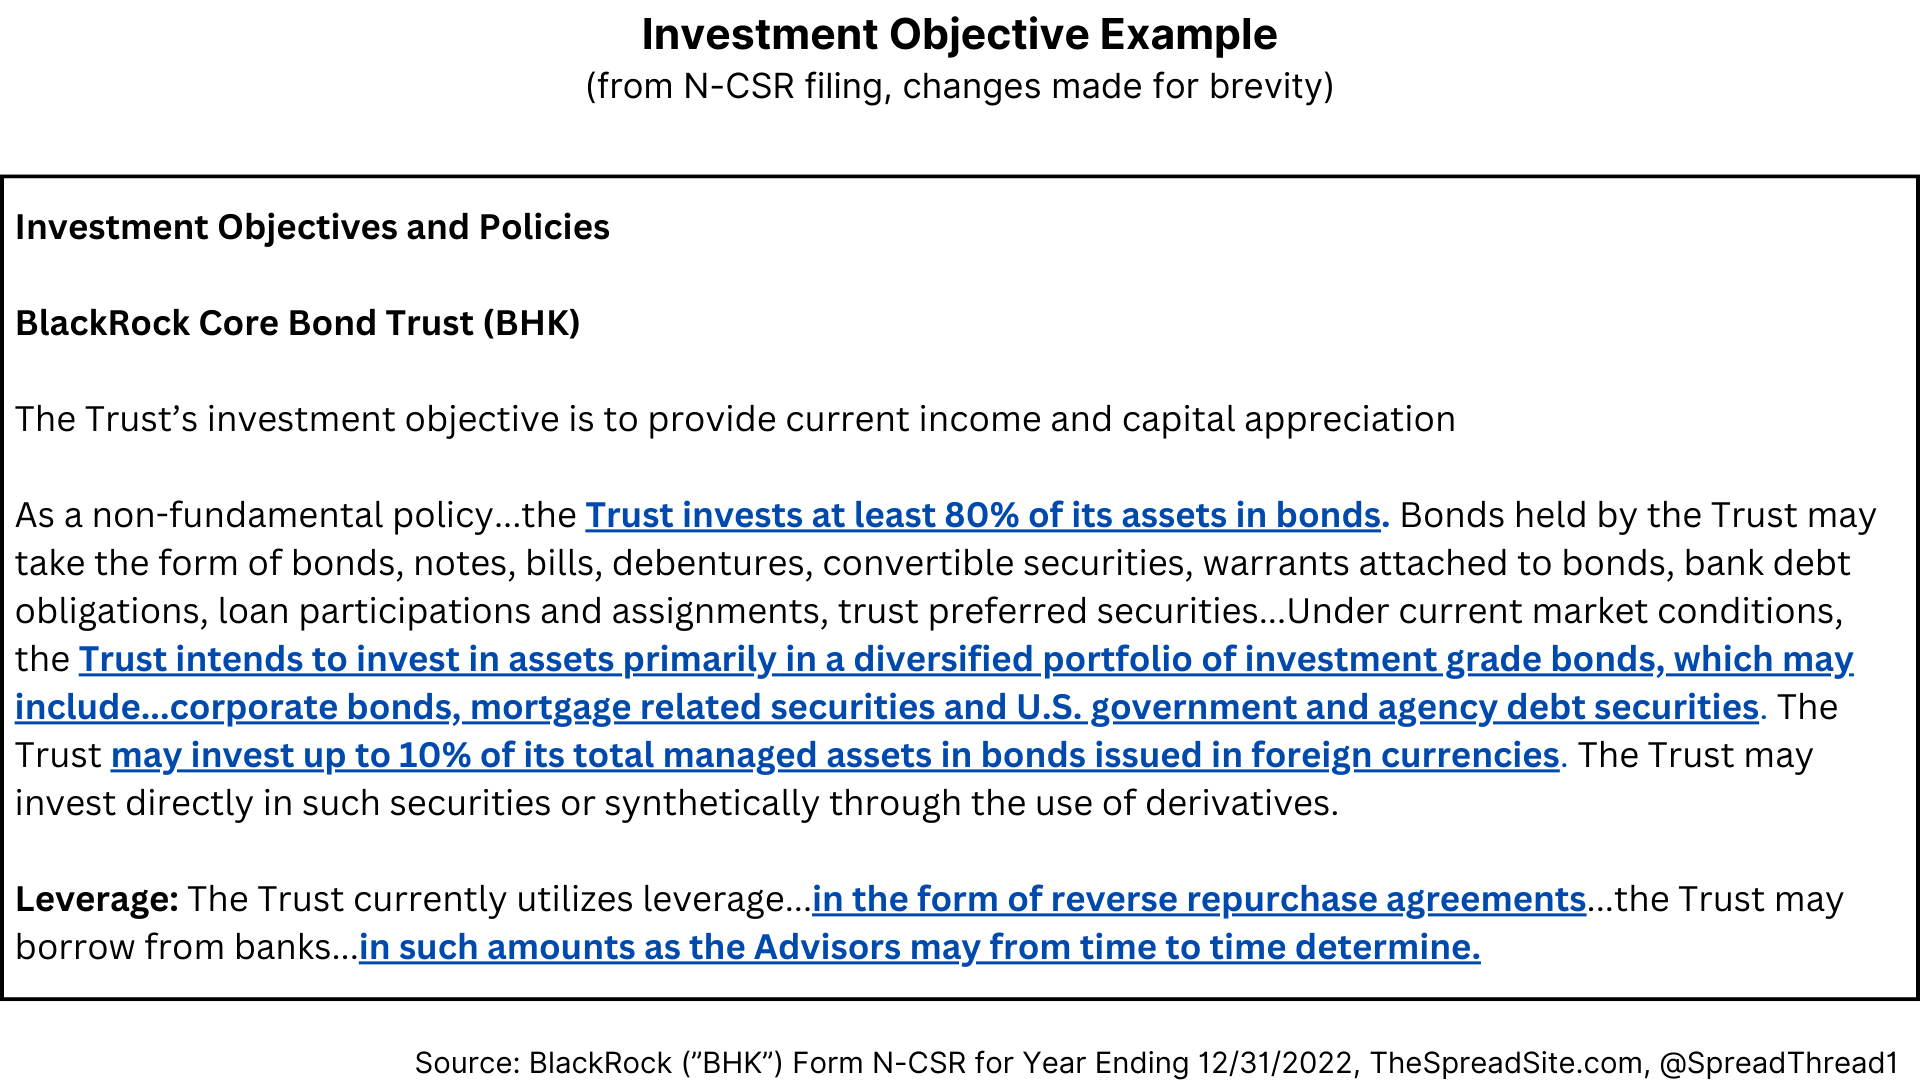
It is important for investors to understand what a CEF actually holds vs their description, as differences can arise. For instance, a CEF may call itself “high grade, low duration bond trust” but the Investment Objective may allow up to 20% of assets to have a duration greater than 7 years and up to 15% of assets in the high yield category.
There are a few places to look for more granularity on holdings, leverage, or strategy. The first is a webpage for the specific CEF (i.e. BlackRock, Pimco and Nuveen list details for all their CEFs on their websites). Detail on the BlackRock fund mentioned above (“BHK”) can be found on their website. There are also annual or semi-annual filings under the “N-CSR” designation (they don’t file under a “10-k” or “10-Q”) that contain details on holdings and the Investment Objective. CEFConnect is another resource that aggregates data, but we prefer site or filing specific data.
Premiums & Discounts to NAV
As mentioned, the fact that CEFs can trade at a premium or discount to NAV is arguably their most unique property. This will track sentiment within the asset class as well as general macro factors. For example, in a rising rate environment it is likely discounts on Municipal and Investment Grade CEFs would widen. This is in part because the underlying assets are likely declining in price and seeing outflows, driving selling activity in the CEFs. Historically, CEFs as a whole trade at a discount as the chart below indicates.
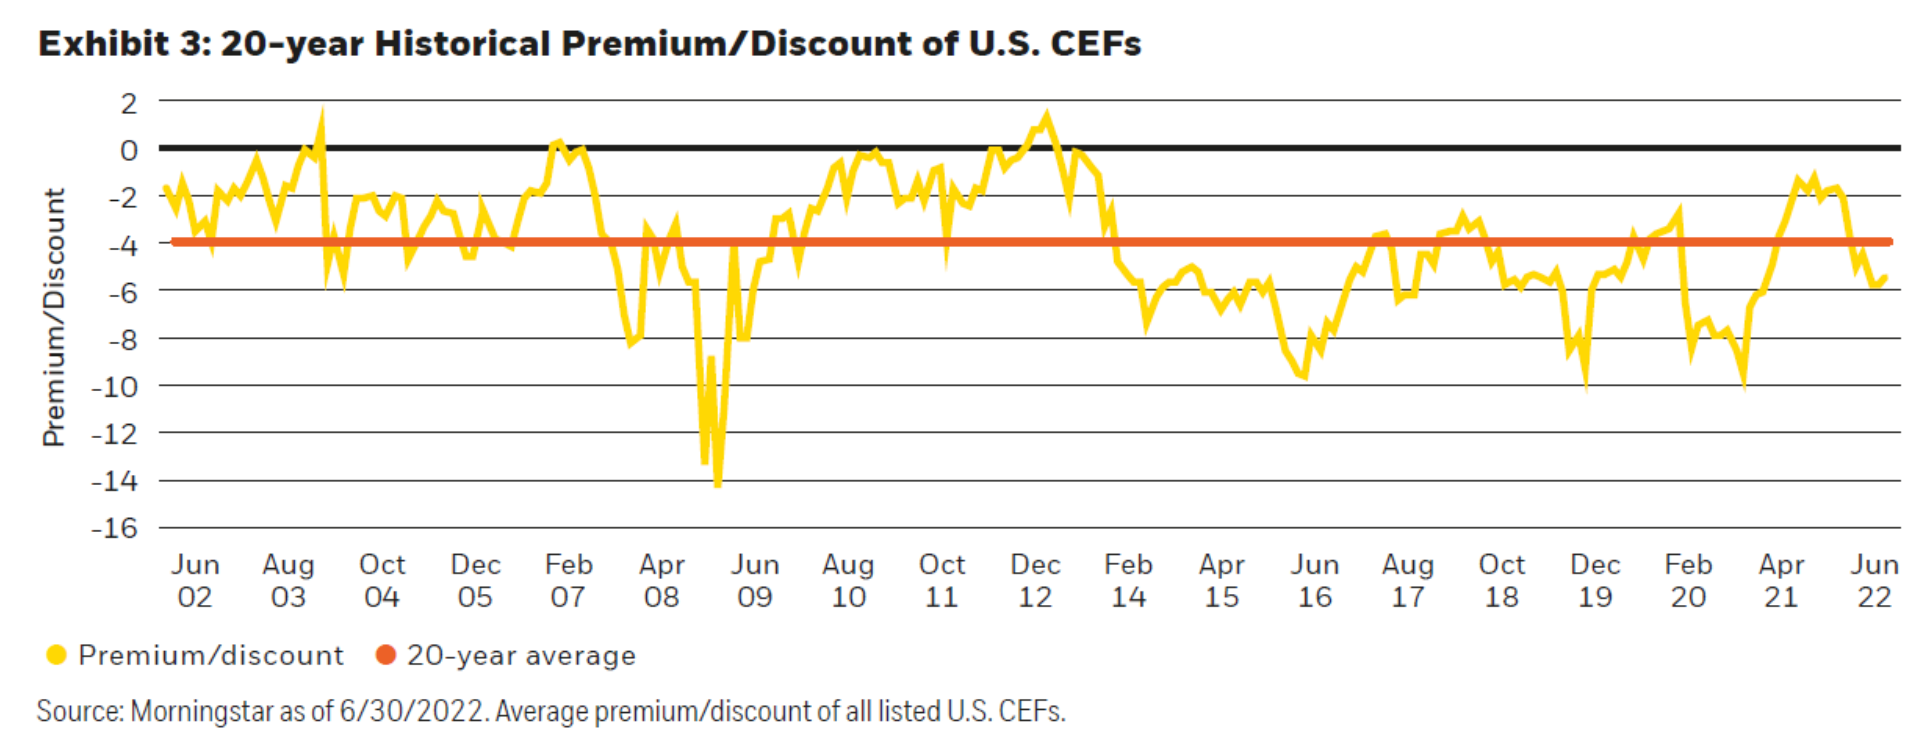
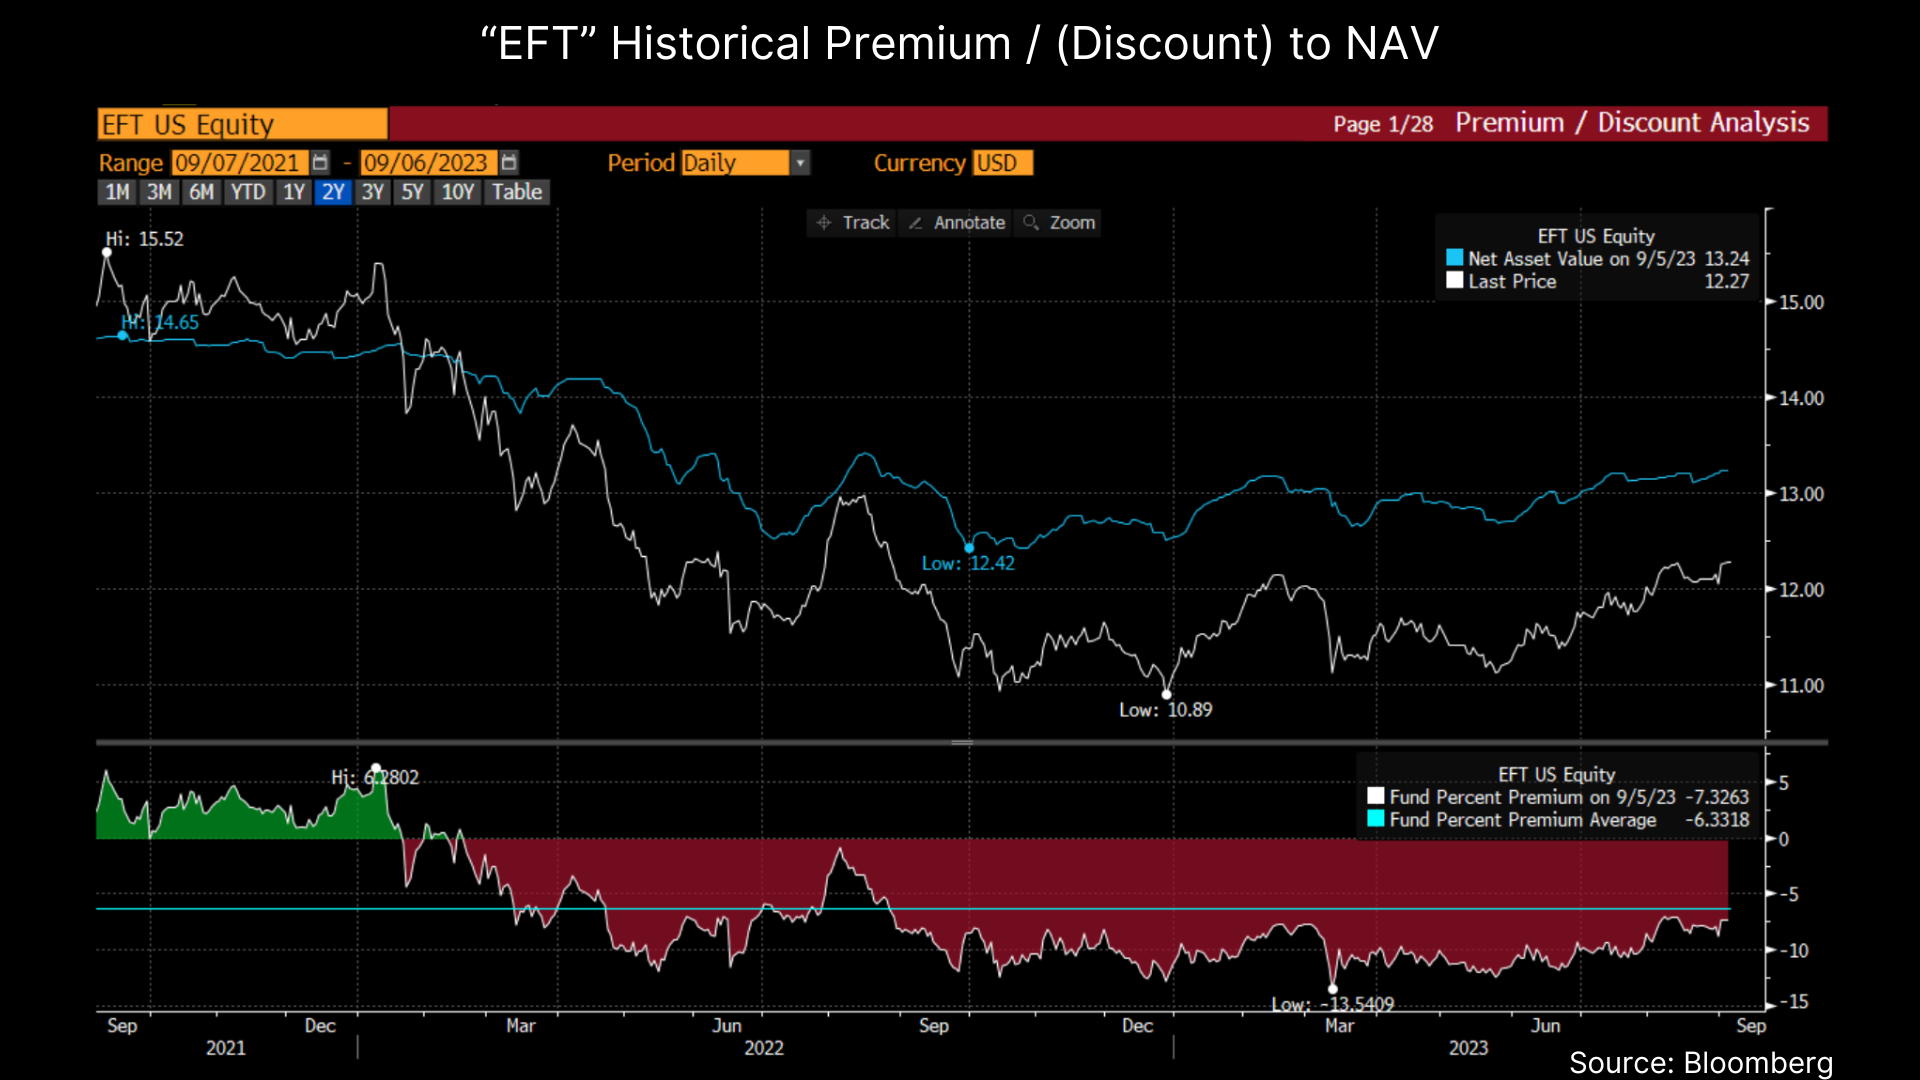
In our experience, a CEF discount should be compared to its own history. For example, if a CEF is trading at an 8% discount to NAV, but over the last year has averaged a 10% discount, we would not consider the discount particularly attractive. We like to see a discount greater than recent history (the timeline for what counts as “recent history” is subjective). As an example, we show the Eaton Vance Floating Rate CEF (“EFT”) where the current discount is arguably cheap at (7.3%). However, in the last year that discount has averaged (10%) and over 2 years the discount averaged (6.3%). We would not classify this CEF as attractive based on its current discount to NAV.
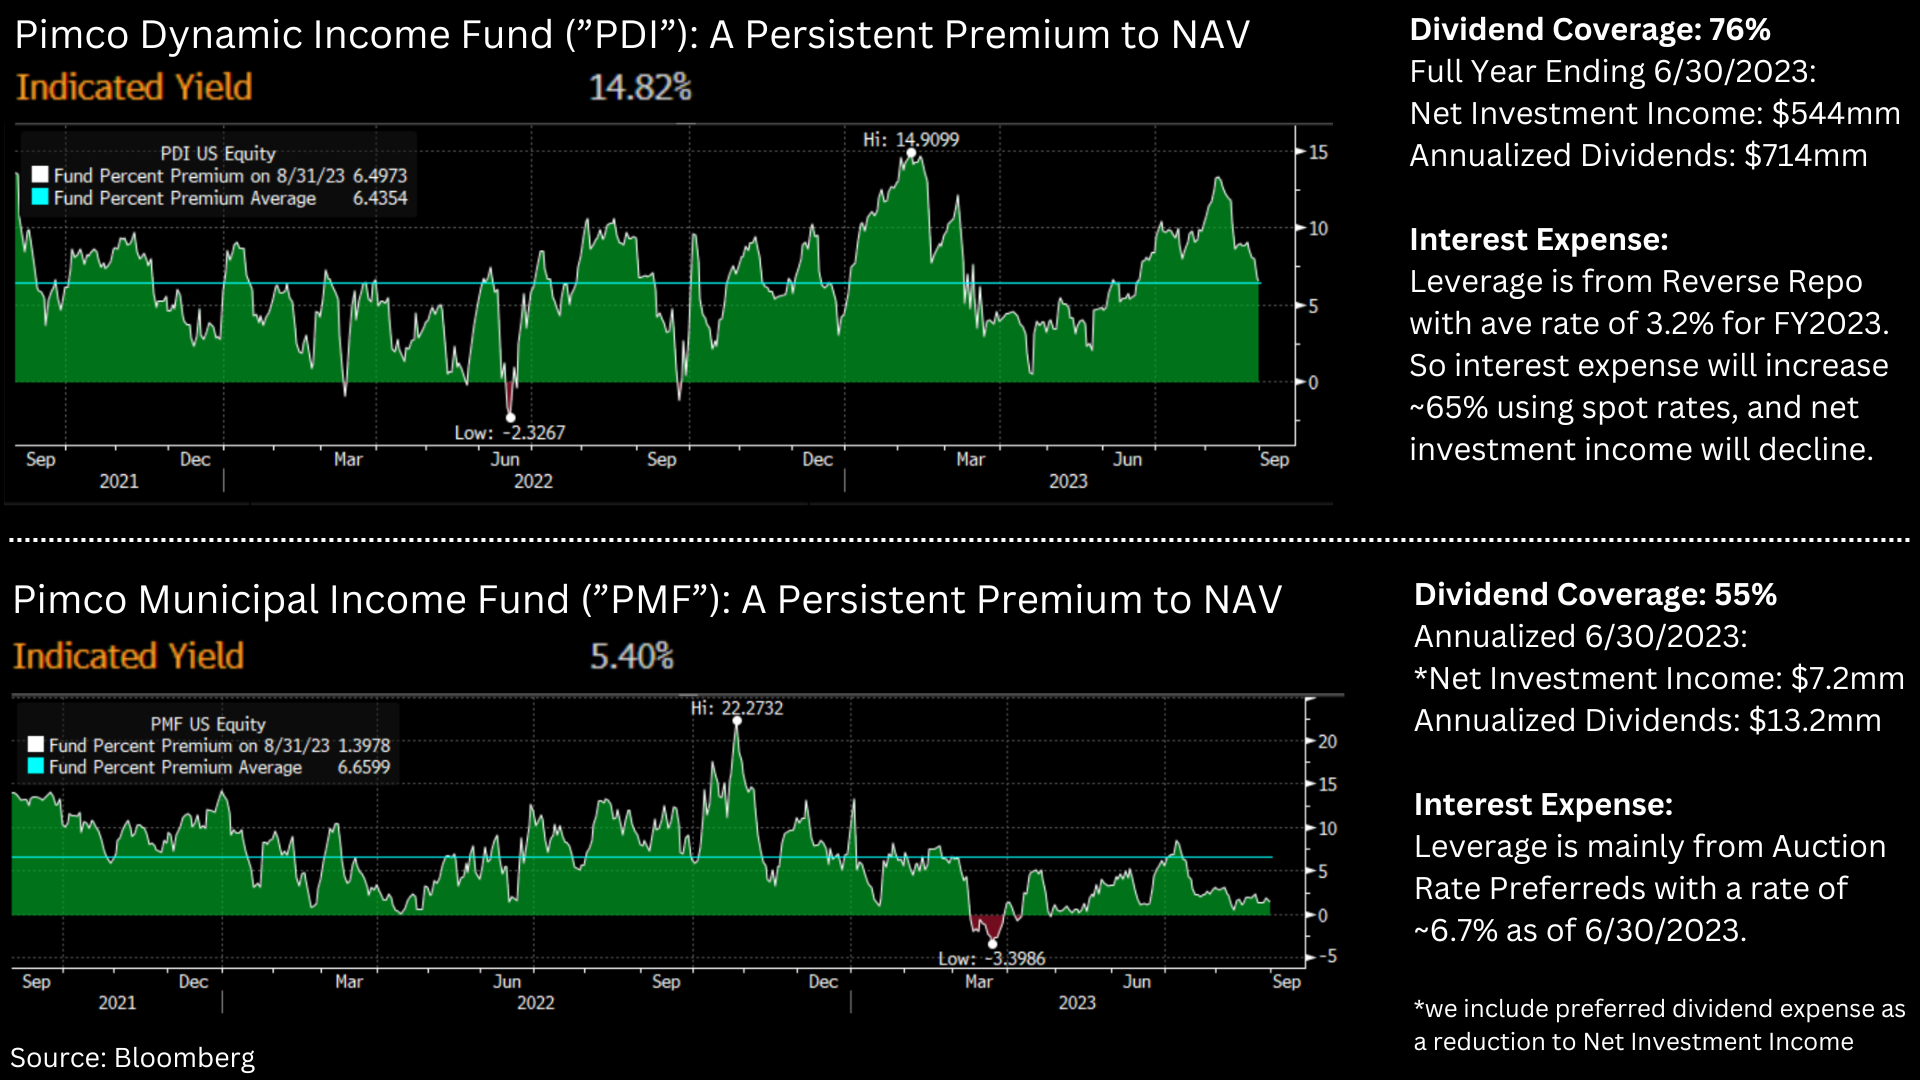
We typically avoid buying CEFs at a premium and some do trade persistently above NAV (Pimco has a few in this category). This can occur for a variety of reasons. Sometimes it is a large yield at IPO that attracts investors (even if unsustainable) or short-term outperformance. Below we show two Pimco CEFs that almost always trade at premiums.
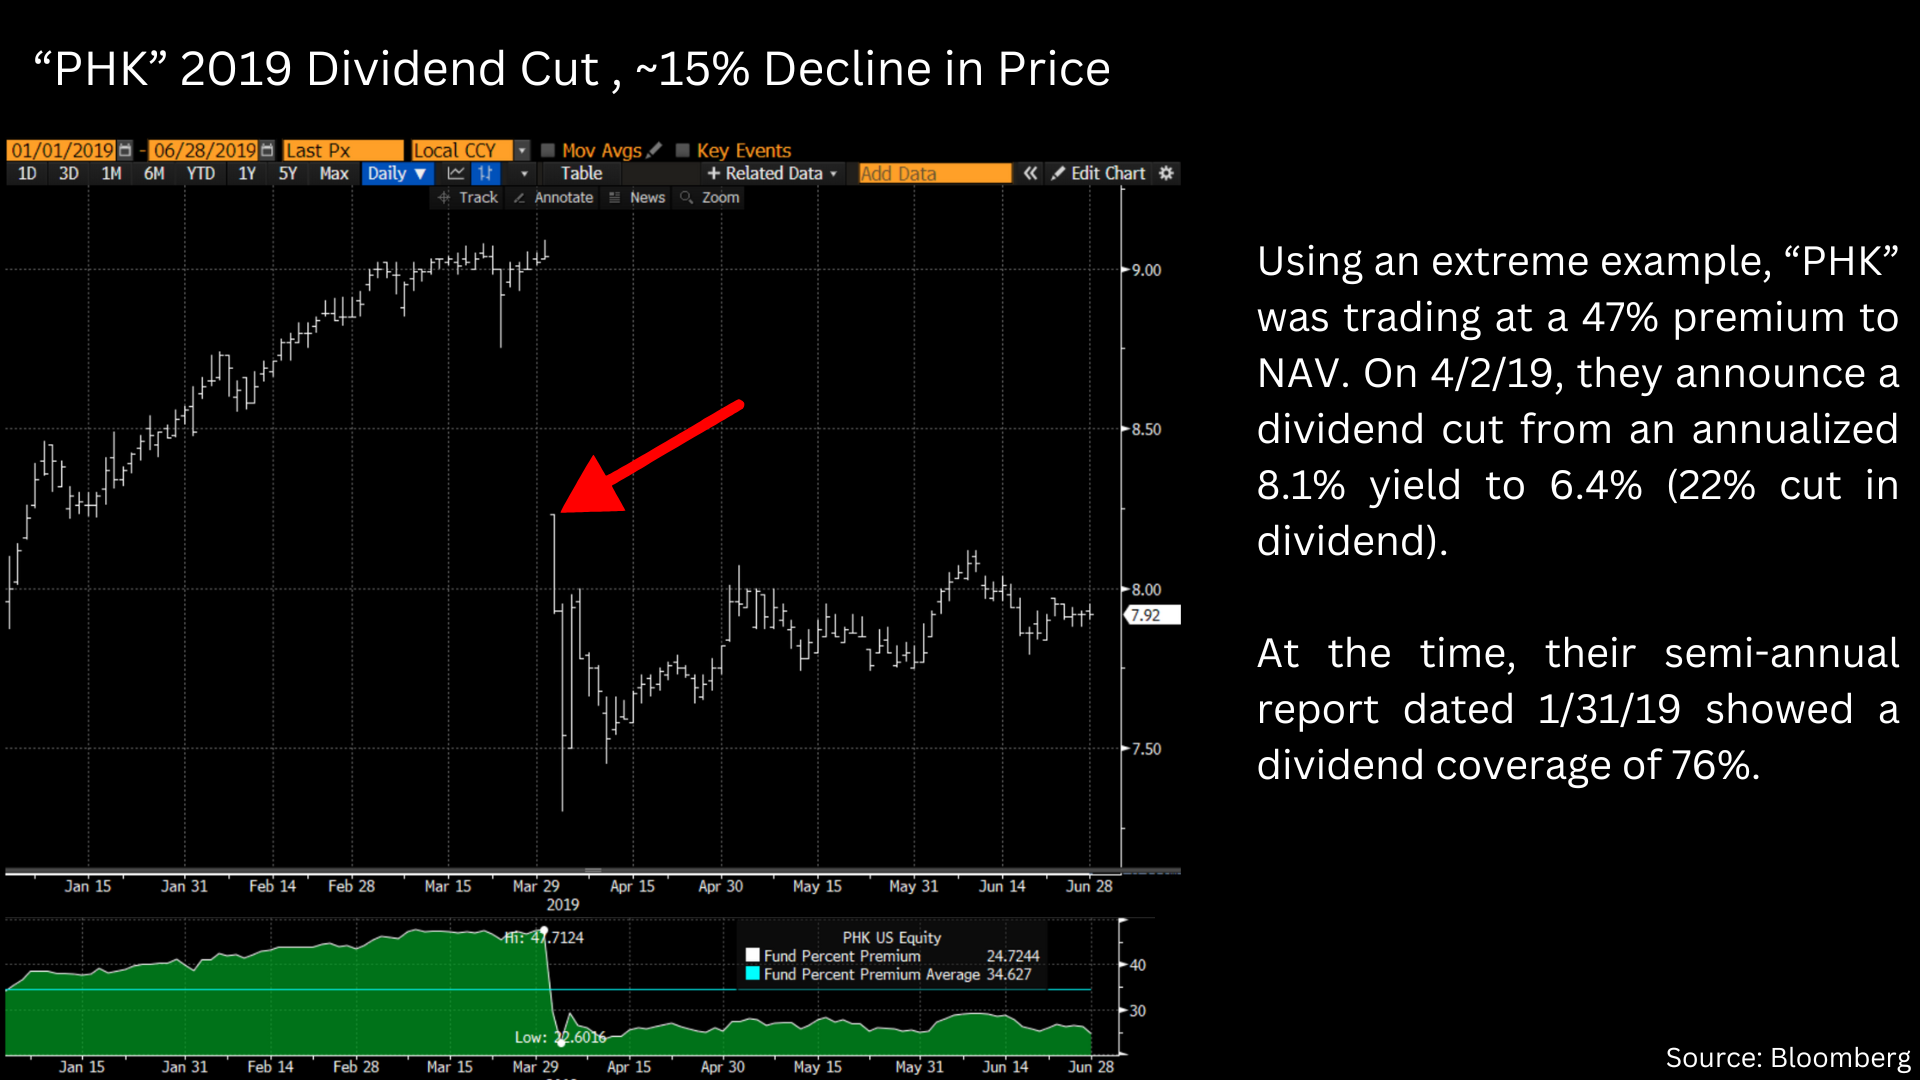
In a more surprising situation, Pimco’s High Income CEF (“PHK”) trades at a large premium even after a dividend cut in 2019. We highlight this name only to say that the CEF space can be strange and it may be worth simply avoiding names trading at large premiums to NAV. As a sidenote, for those thinking of shorting names trading at a premium, keep in mind the CEF space faces a notoriously difficult stock lending program (i.e., it is difficult to short shares).
There are investment funds that take an activist approach to CEFs with an attempt to close large and persistent discounts to NAV. This is a specialized strategy and we will not get into the details, but Saba Capital Management (@boazweinstein) and Relative Value Partners are a few institutional investors focused on the space.
An Inverted Yield Curve Can Cause Problems with Leverage
Most CEFs are able to use leverage to increase their dividend yield. Generally, this means they borrow in the short-term market to buy assets in an amount greater than their equity. As a simple example, let’s say CEF “XYZ” raises $500mm at IPO and buys $500mm of bonds. They can then go into the reverse repo market and borrow against those bonds (lets say $100mm) to buy a total of $600mm worth of bonds. They will then pay the prevailing repurchase rate (or a rate negotiated with a specific counterparty) on the $100mm.
The problem, however, is if the cost of reverse repo is greater than the current yield on the bonds (negative leverage). This is occurring with some CEFs that we discuss later.
The major categories of leverage used by CEFs are listed below:
- Reverse Repo: qualified assets are pledged in the overnight borrowing market, which generally tracks the Fed Funds rate (overnight reverse repo is ~5.35%)
- Preferreds: these can carry different names (“VMTP,” “VRDP”), but generally a CEF will sell preferred securities to institutional investors like money markets. These preferreds will carry dividends that reset on a short-term schedule (i.e. weekly, or monthly) and may be redeemed by the holder.
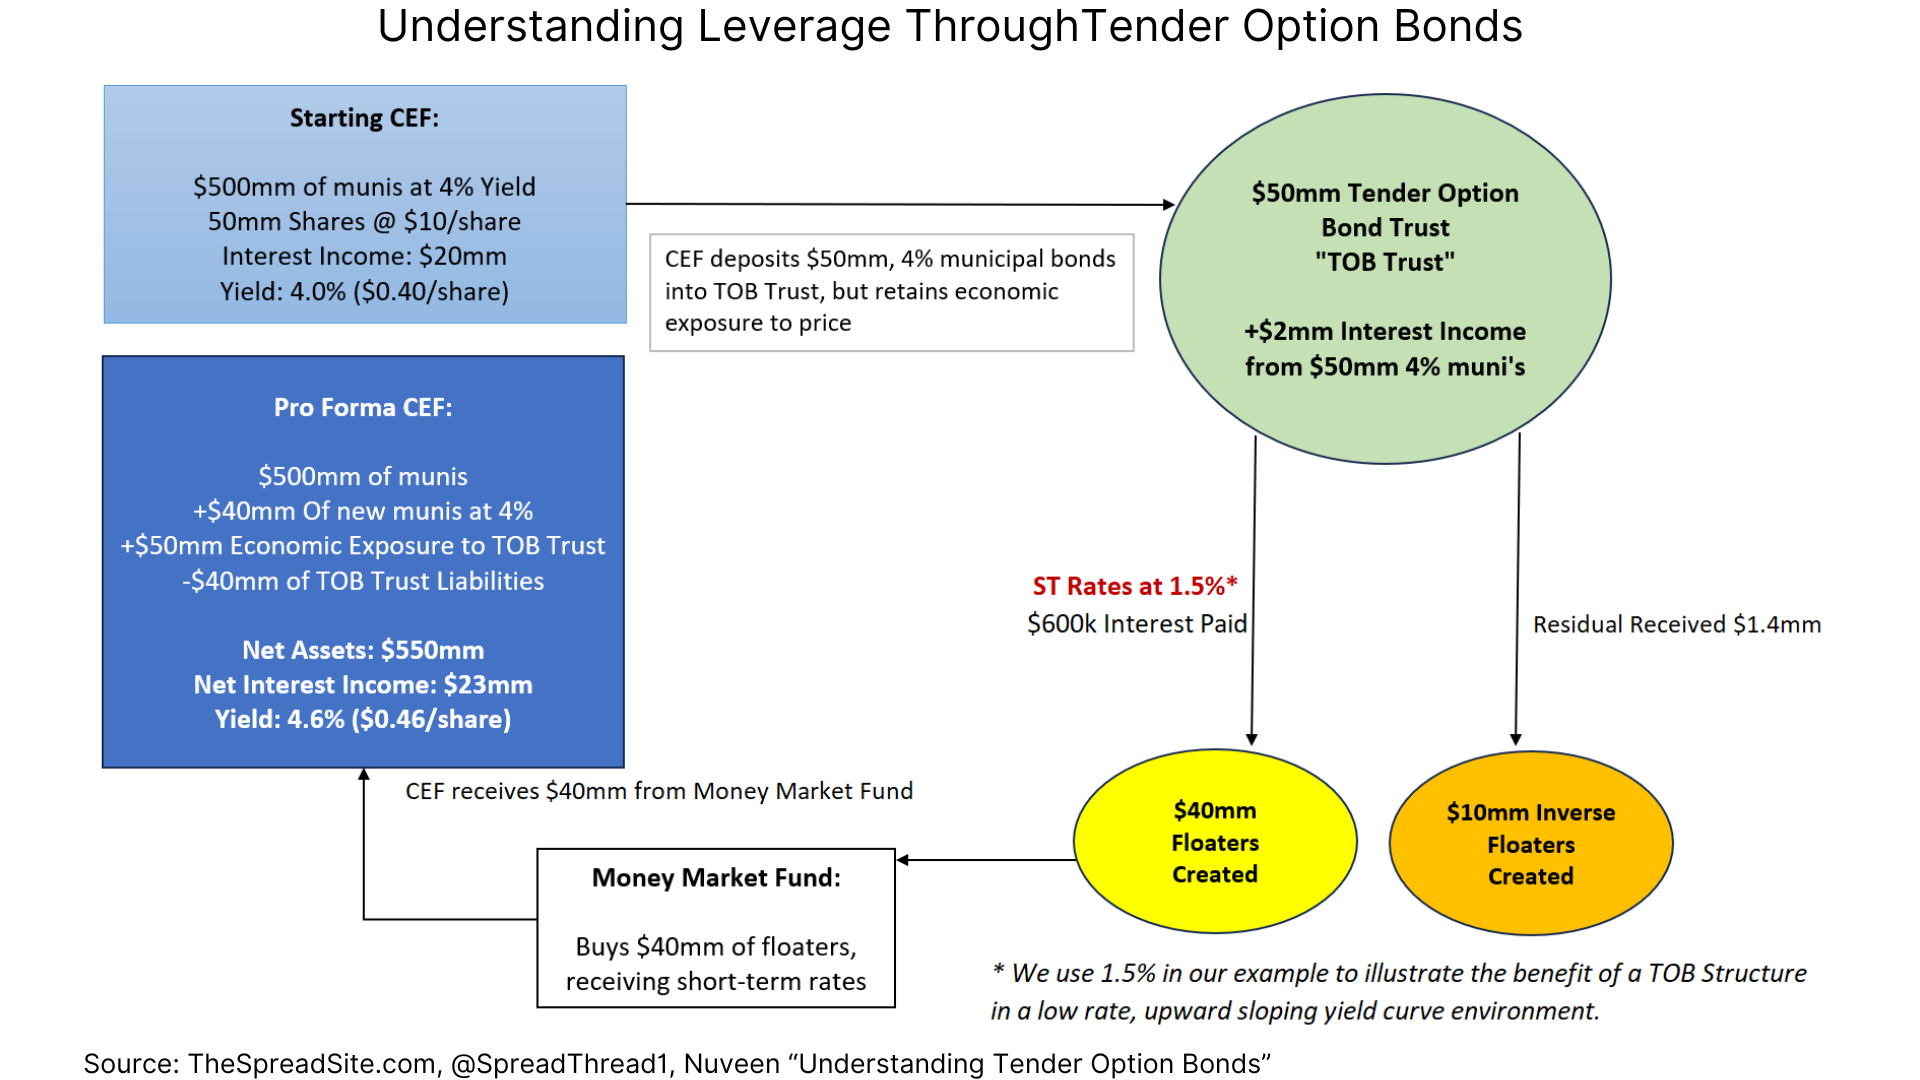
- Tender Auction Bonds (“TOBs”) & Inverse Floating Rate Securities: see image below, but generally bonds that pay floating short-term rates and are backed by qualified collateral owned by the CEF.
TOBs and Inverse Floaters can be confusing and terms will vary depending on the fund. We show a simplified example below to hopefully illustrate the moving pieces. Essentially, this is a form of secured borrowing where leverage is created if the rate paid on the “Floaters” is less than that received on the “Inverse Floaters” and less than the yield on additional assets purchased.
Our example is highly simplified as each CEF can have its own unique terms on each part of the TOB Trust. In addition, there is a structure put in place to manage the redemption feature of the Floaters. We are just trying to show the basic mechanics.
Each CEF will have its own mix of products used to create leverage. Terms are typically specific to each structure as these are usually bilateral contracts created with the counterparty to the structure (banks or money market funds are typical participants). However, most structures used to create leverage fall into one of the categories mentioned above, with terms that are generally similar. During the Financial Crisis, a leverage structure called Auction Rate Preferreds became problematic, but these are very rarely forms of CEF leverage today. For a quick summary of what happened, check out the CFA Institute article titled, "The ARS Debacle: The Forgotton Crisis of 2008".
The main takeaway, however, is that they are all short-term, floating rate structures. This creates risk, particularly when the yield curve is inverted.
For example, looking at the BlackRock Core Bond Trust (“BHK”), we see the fund (73% IG bonds) has a dividend yield of 8.7% and leverage of 39% using reverse repurchase agreements. As of their last annual report (period ending 12/31/2022), dividend coverage (net investment income / dividends paid) was 72% (in our view, bordering on too low). However, the average cost of reverse repo during 2022 was ~1.9%. If we assume an average repo cost of 5.25%, dividend coverage drops to 44%, which is a concerning coverage ratio, in our view.
This should not be a big surprise as the fund’s weighted average coupon is 5.1% and spot reverse repo rates are >5.1%. This is the risk inherent with an inverted yield curve and borrowing short to invest long. We would avoid this CEF.
CEFs can pay out a dividend greater than their net investment income by selling their underlying assets. And in a scenario where the underlying assets have seen significant price appreciation, this is usually fine. However, when asset prices are declining and dividends are greater than net investment income, the asset base begins to shrink in a negative feedback loop.
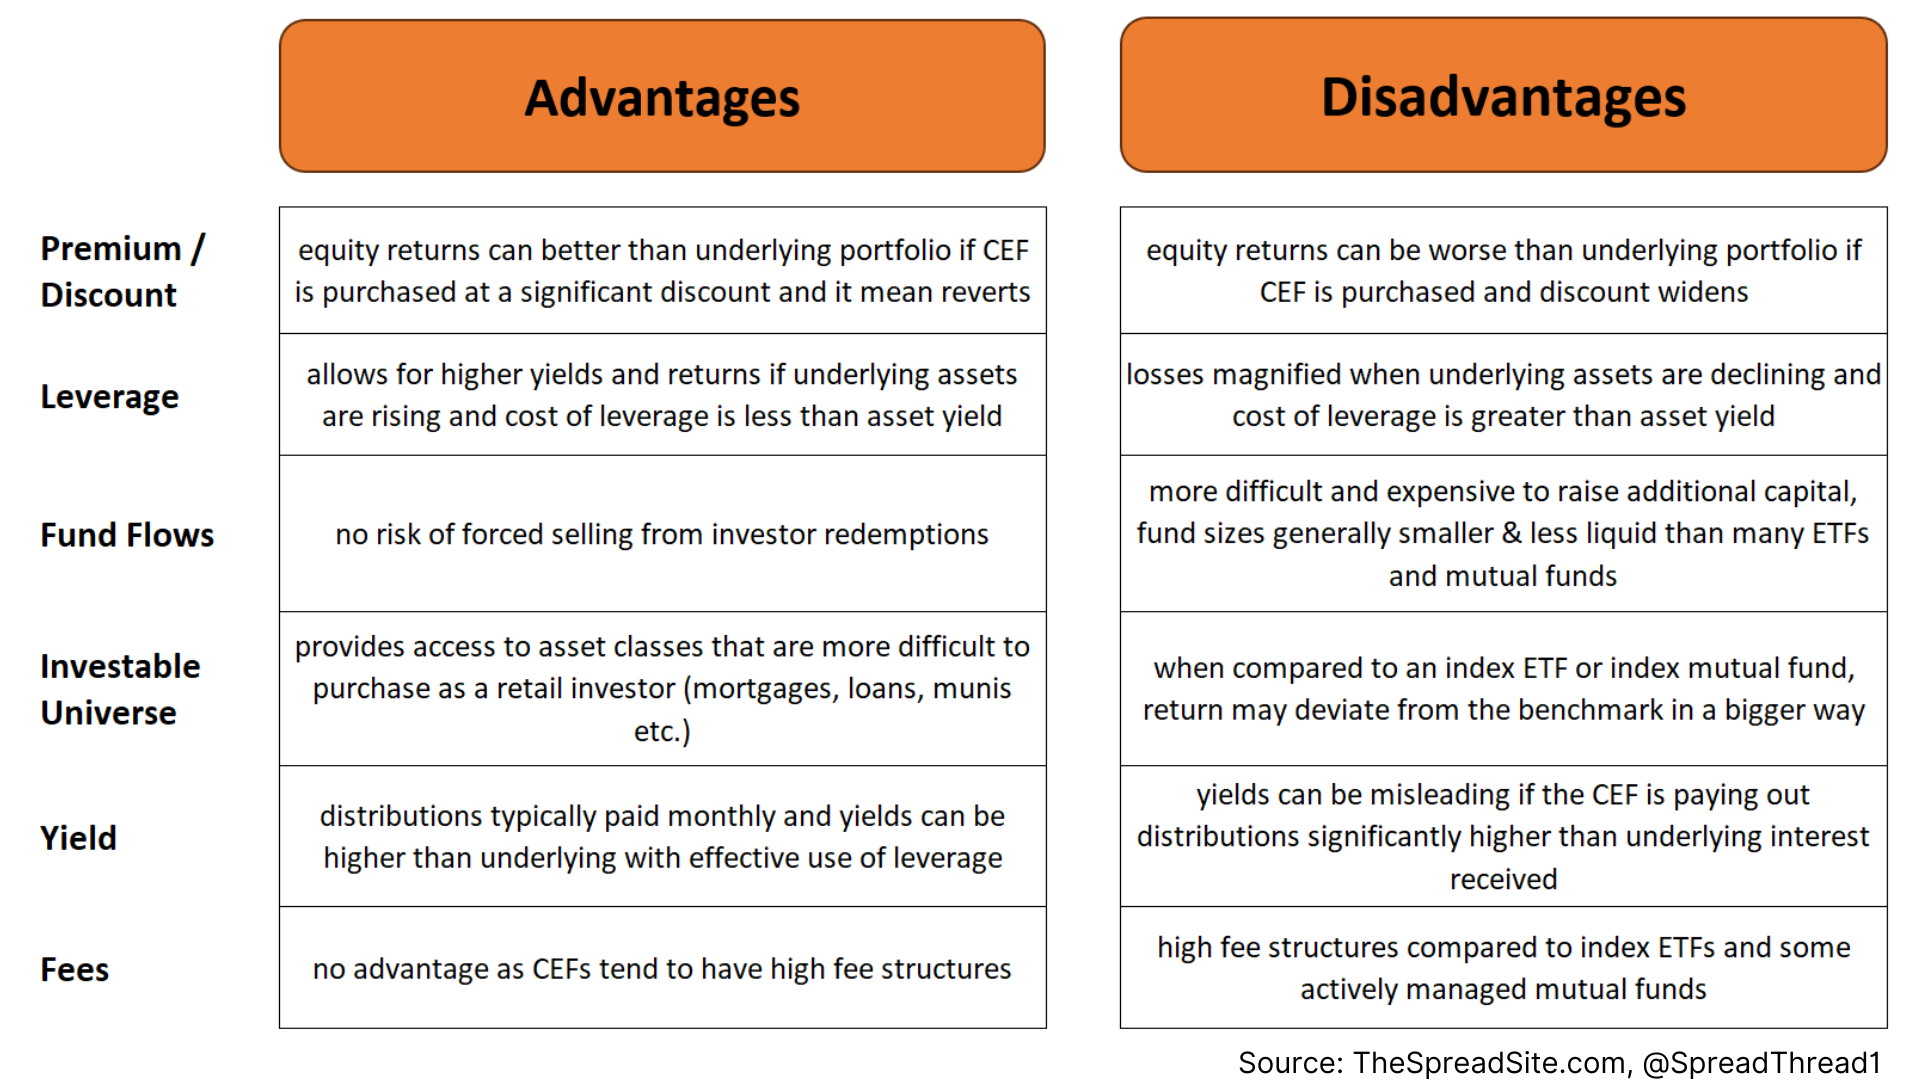
Many of the nuances inherent in a CEF structure (leverage, premium /discount to NAV, etc.) can be both advantages and disadvantages. The key is making sure the valuation is reasonable (within the CEF and the underlying asset class) and that major risks are not lurking within the CEF's structure.
CEF Recommendations
Finally, we end with a methodology we use to screen for CEFs and a few recommendations. Generally, our checklist for finding attractive CEFs is as follows:
- Start with asset class we like from a macro perspective
- Filter out names with limited liquidity (a rough min is 30d average volume >50k shares)
- Filter out names trading at a discount to NAV less than a ~1yr ave NAV discount
- Evaluate remaining names by looking at their leverage, dividend coverage and pro-forma dividend coverage at spot interest rates
As we discussed in Duration On Sale, we think high-quality fixed income is looking more attractive, and this impacts our view within CEFs. For example, we prefer Munis, MBS, Treasuries and high-quality IG corporates over leveraged loans, high yield bonds and preferred stock. Our screen yielded the following municipal bond CEFs (see Appendix for additional detail on each fund). We were hoping to also find some attractive high-quality corporate bond CEFs or mortgage CEFs, but the ones we came across had issues with dividend coverage assuming spot interest rates. Preferred stock CEFs like “JPS” screen attractive, but we remain cautious on that asset class for now.
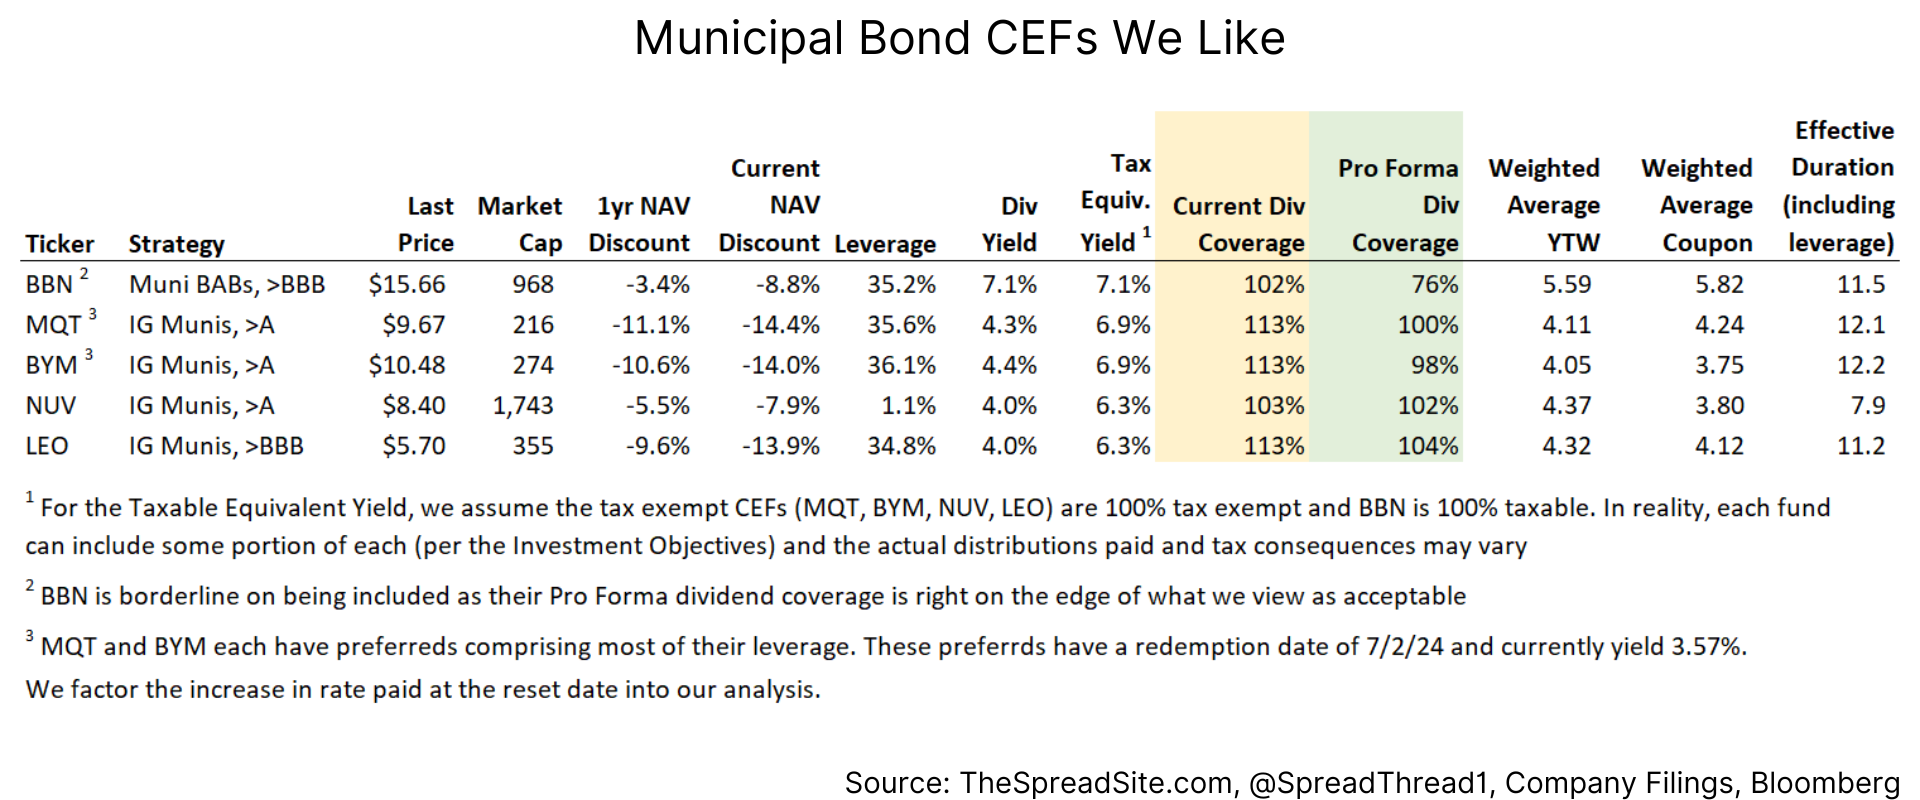
Assuming long-term rates stabilize (and unchanged muni spreads) we can make some return assumptions. Using “MQT” as an example, if over a 1yr time frame the discount to NAV mean reverts and we use the top 37% federal tax bracket, the tax equivalent yield would be a 10.1% [((4.3% / (1-.37)) + (14.4% -11.1%)].
Clearly long rates can rise further, spreads can widen, the NAV discount can increase, etc. We just highlight this as one scenario we believe is realistic for a CEF that screens as attractive.
Appendix
Additional Descriptive Information on Muni CEFs We Like
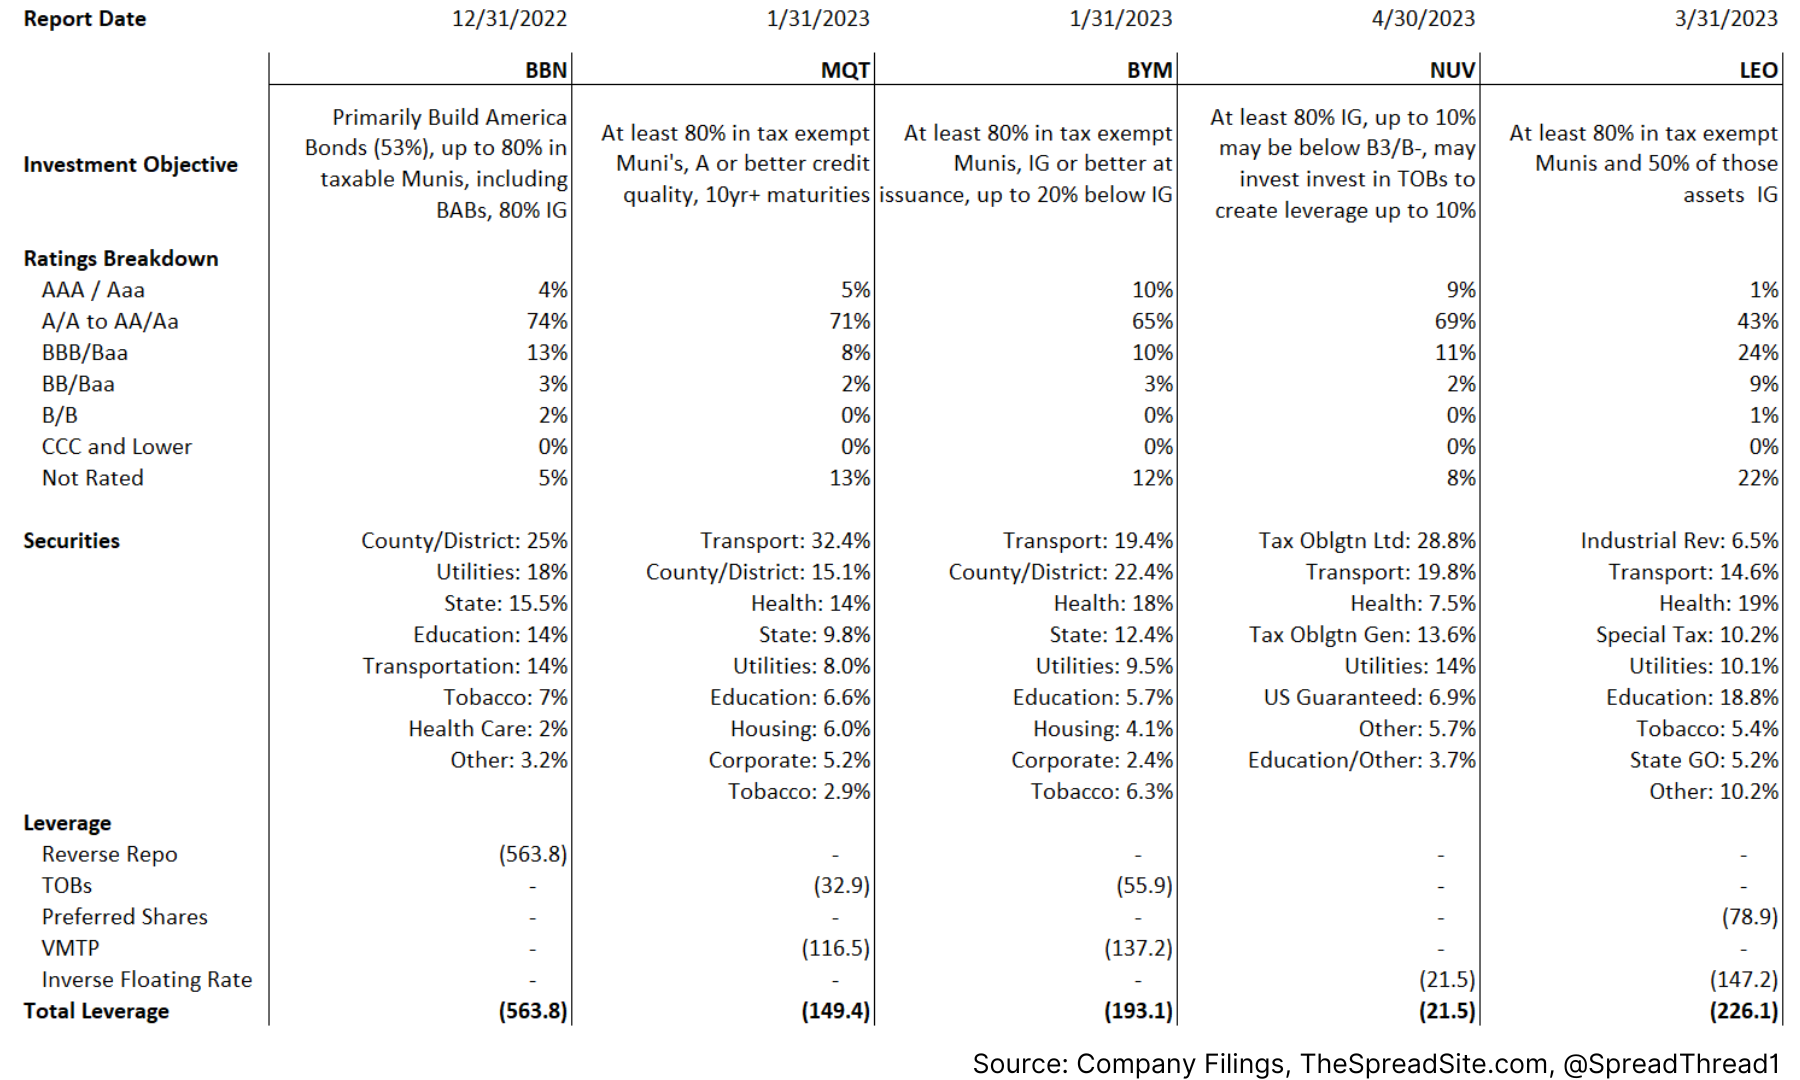
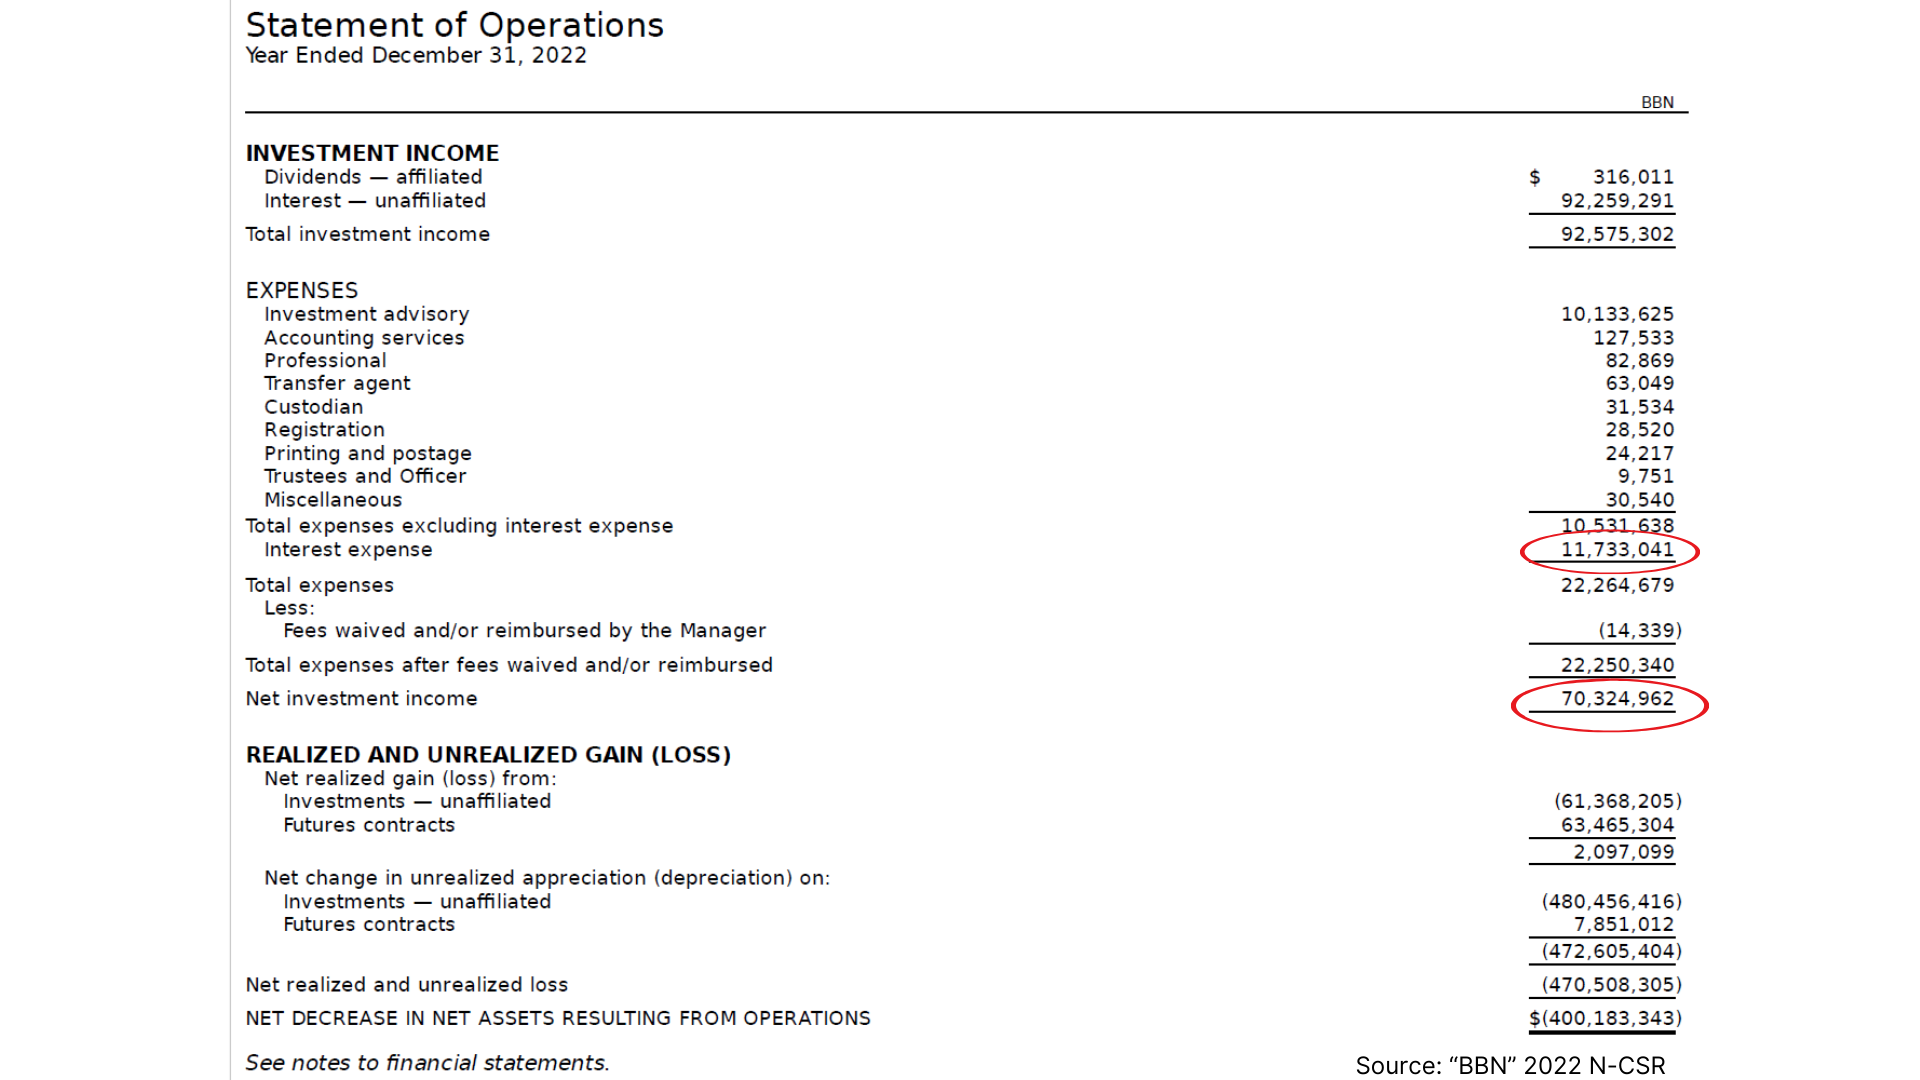
Finding "Net Investment Income" and "Interest Expense" (BBN as Example):
This data will be in the Statement of Operations shown in the most recent N-CSR (some CEFs file semi-annually, some only annually). Often, one document is filed for multiple CEFs managed within an investment manager. We compare the annual or annualized Net Investment Income to the annualized distribution paid to shareholders to get a distribution coverage ratio as we think this is a very important metric that is not typically stated on CEF Connect or CEF websites.
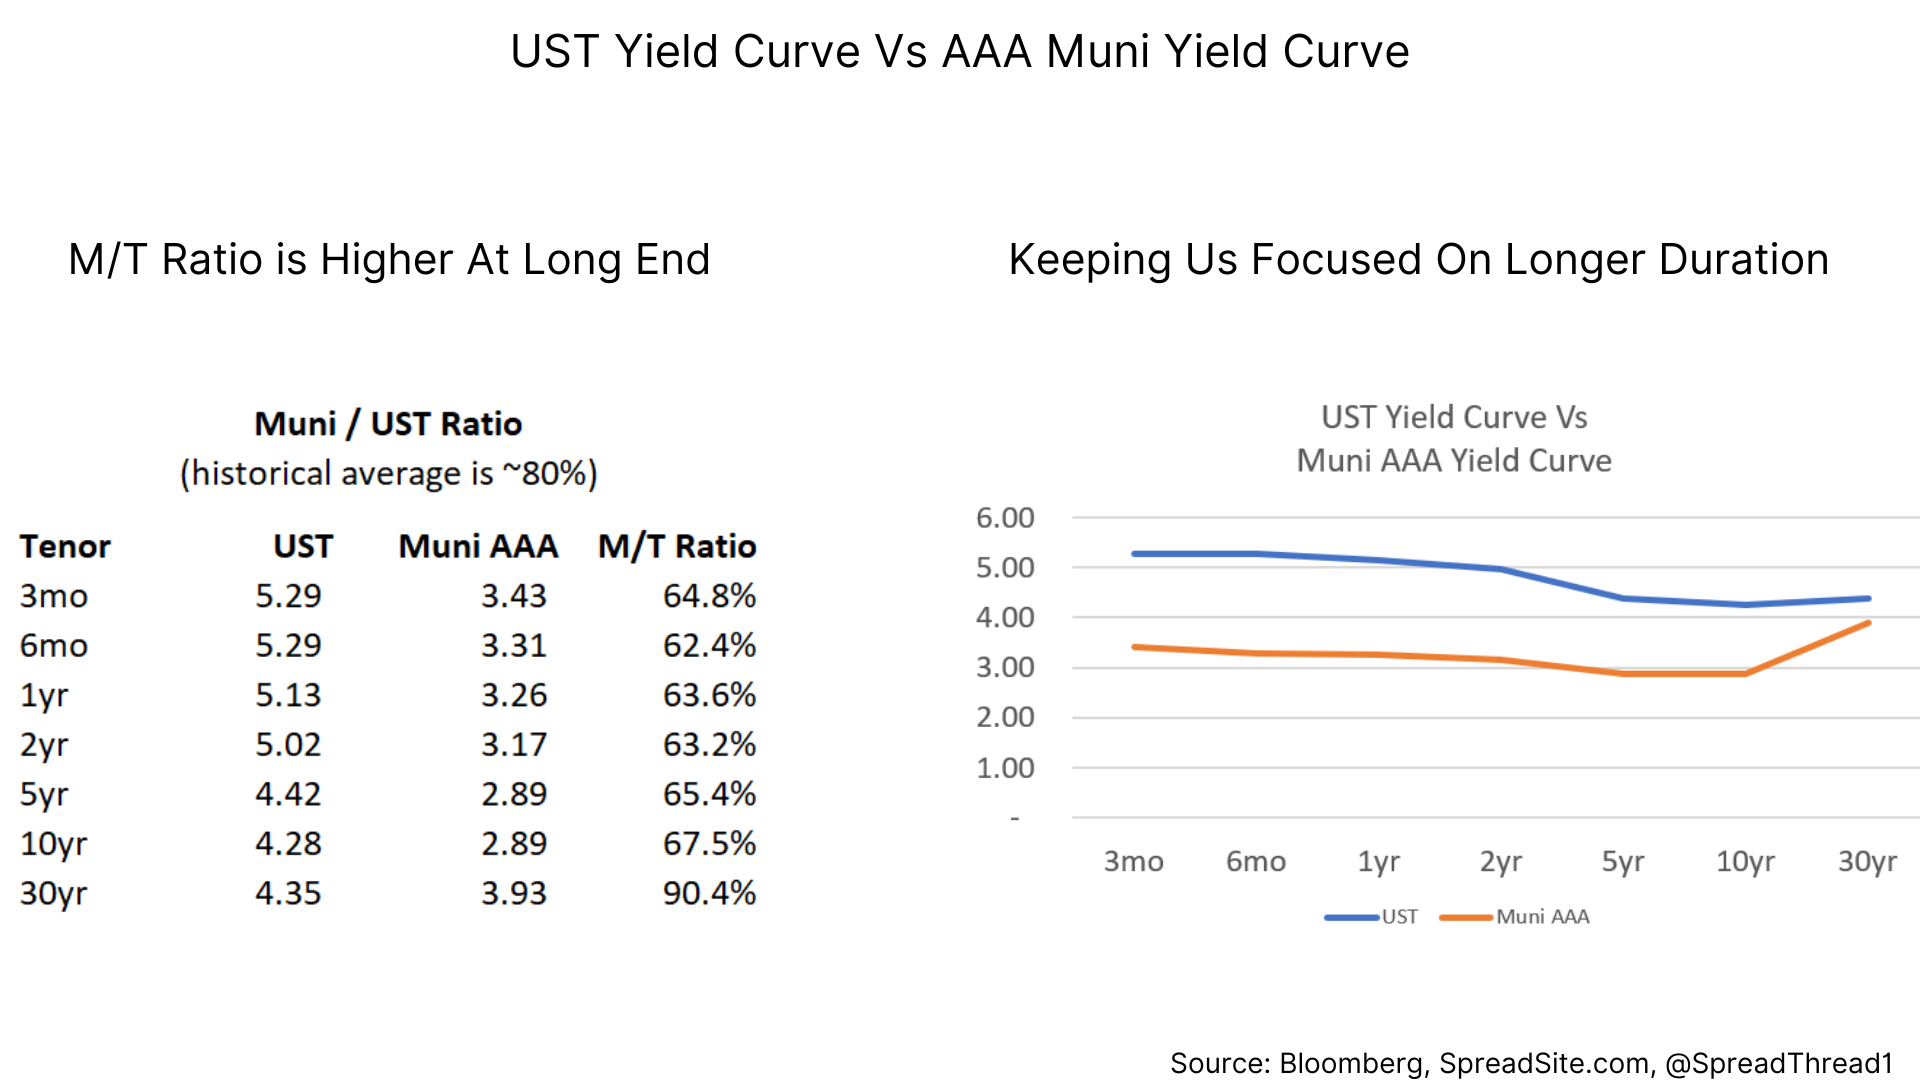
Municipals and the MMD Yield Curve
Municipals are priced off a “risk-free” yield curve made up of AAA municipal bonds. This curve is referred to as “The Municipal Market Data (MMD) Yield Curve.” For the spreads in our table in the "CEF Recommendations" section, we use a Bloomberg implied AAA curve, which is very similar to MMD.
Additionally, this MMD or BVAL AAA curve can be compared to the UST yield curve to see if the former is cheap or rich. The general idea is that munis are tax exempt and should trade tight to USTs. Multiple factors can influence this relationship and is outside the scope of this report, but generally anything above 80% is considered “cheap”.
Disclosures
Please click here to see our standard legal disclosures.
The Spread Site Research
Receive our latest publications directly to your inbox. Its Free!.


