Corporate Credit Primer
We put together a primer on corporate credit markets designed for someone with a low-to-moderate understanding of credit. We touch on most topics, at a high level, that we believe are important to understand when investing in the asset class. In future primers, we will dig into some of the topics below in greater detail.
Table of Contents
- Corporate Bond Basics – Corporate bond terminology and return calculations.
- Investment Grade Credit – The features, key statistics, and risks in investment grade bonds and bond indices.
- High Yield Credit – The features, key statistics, and risks in high yield bonds and bond indices.
- Leveraged Loans/ Private Credit - The features, key statistics, and risks in leveraged loans and basics on private credit as well as CLOs.
- Credit Default Swaps – Explanation of credit derivatives and credit derivative indices.
- Credit Analysis – Basics on corporate credit fundamentals, capital structures and covenants.
- Credit Technicals – Understanding the drivers of supply and demand in corporate credit markets.
- ETFs – A brief summary of the options for investing in credit.
Corporate Bond Basics
Before getting into the details on credit markets, we start by defining some basic terminology necessary to evaluate a corporate bond.
-
Maturity: The date when the principal on a debt instrument comes due.
-
Coupon: The annual interest rate paid on a debt instrument.
-
Bullet Bond: A bond whose principal is paid on its maturity date.
-
Callable Bond: A bond that can be paid off by the issuer prior to its maturity date at a specified call price.
-
Yield to Maturity: The annual rate of return on a debt instrument purchased at a market price and held to maturity taking into consideration the coupon and pull to par of the bond.
-
Yield to Call: The annual rate of return on a debt instrument purchased at a market price and held to the call date taking into consideration the coupon and price change of the bond.
-
Yield to Worst: The lowest yield an investor can receive (without the issuer defaulting); typically the lower of yield to maturity or yield to call. High yield bonds are usually callable and quoted as yield to worst. Investment grade bonds are typically quoted as yield to maturity.
-
Duration: A bond’s sensitivity to changes in interest rates taking into consideration a bond’s maturity, yield, coupon, and call features. Bonds with longer maturities and lower coupons typically have longer durations/ greater interest rate sensitivity.
-
Credit Spread: Generally, the difference between the yield on a corporate bond and the yield on a Treasury bond with the same maturity.
-
A spread can be calculated in many different ways. For example, the option-adjusted spread (OAS) is the spread using a model that adjusts for the embedded options in the bond. Various factors lead to wide (large) or tight (small) credit spreads.
- Default risk – The likelihood of a debt issuer not paying back the full principal due to bankruptcy or restructuring.
- Liquidity risk – The difficulty and cost in buying and selling a debt instrument.
- Recovery rate – The amount of a debt instrument (percentage of par) that will be repaid to a creditor in the even of a bankruptcy or restructuring.
- Seniority – The priority in which a creditor will be repaid in the event of default, relative to other investors in the capital structure.
- Covenants – Legally binding agreements between a debt issuer and lender that require the issuer to maintain certain conditions or list what activities will or will not be undertaken.
- Credit rating – Measures of credit quality by ratings agencies such as Standard & Poor’s, Moody’s and Fitch.
-
Bonds with low default risk, strong liquidity, high expected recovery rates, senior in the capital structure, tight covenants, and high credit ratings, should trade at tighter spreads, all-else-equal.
-
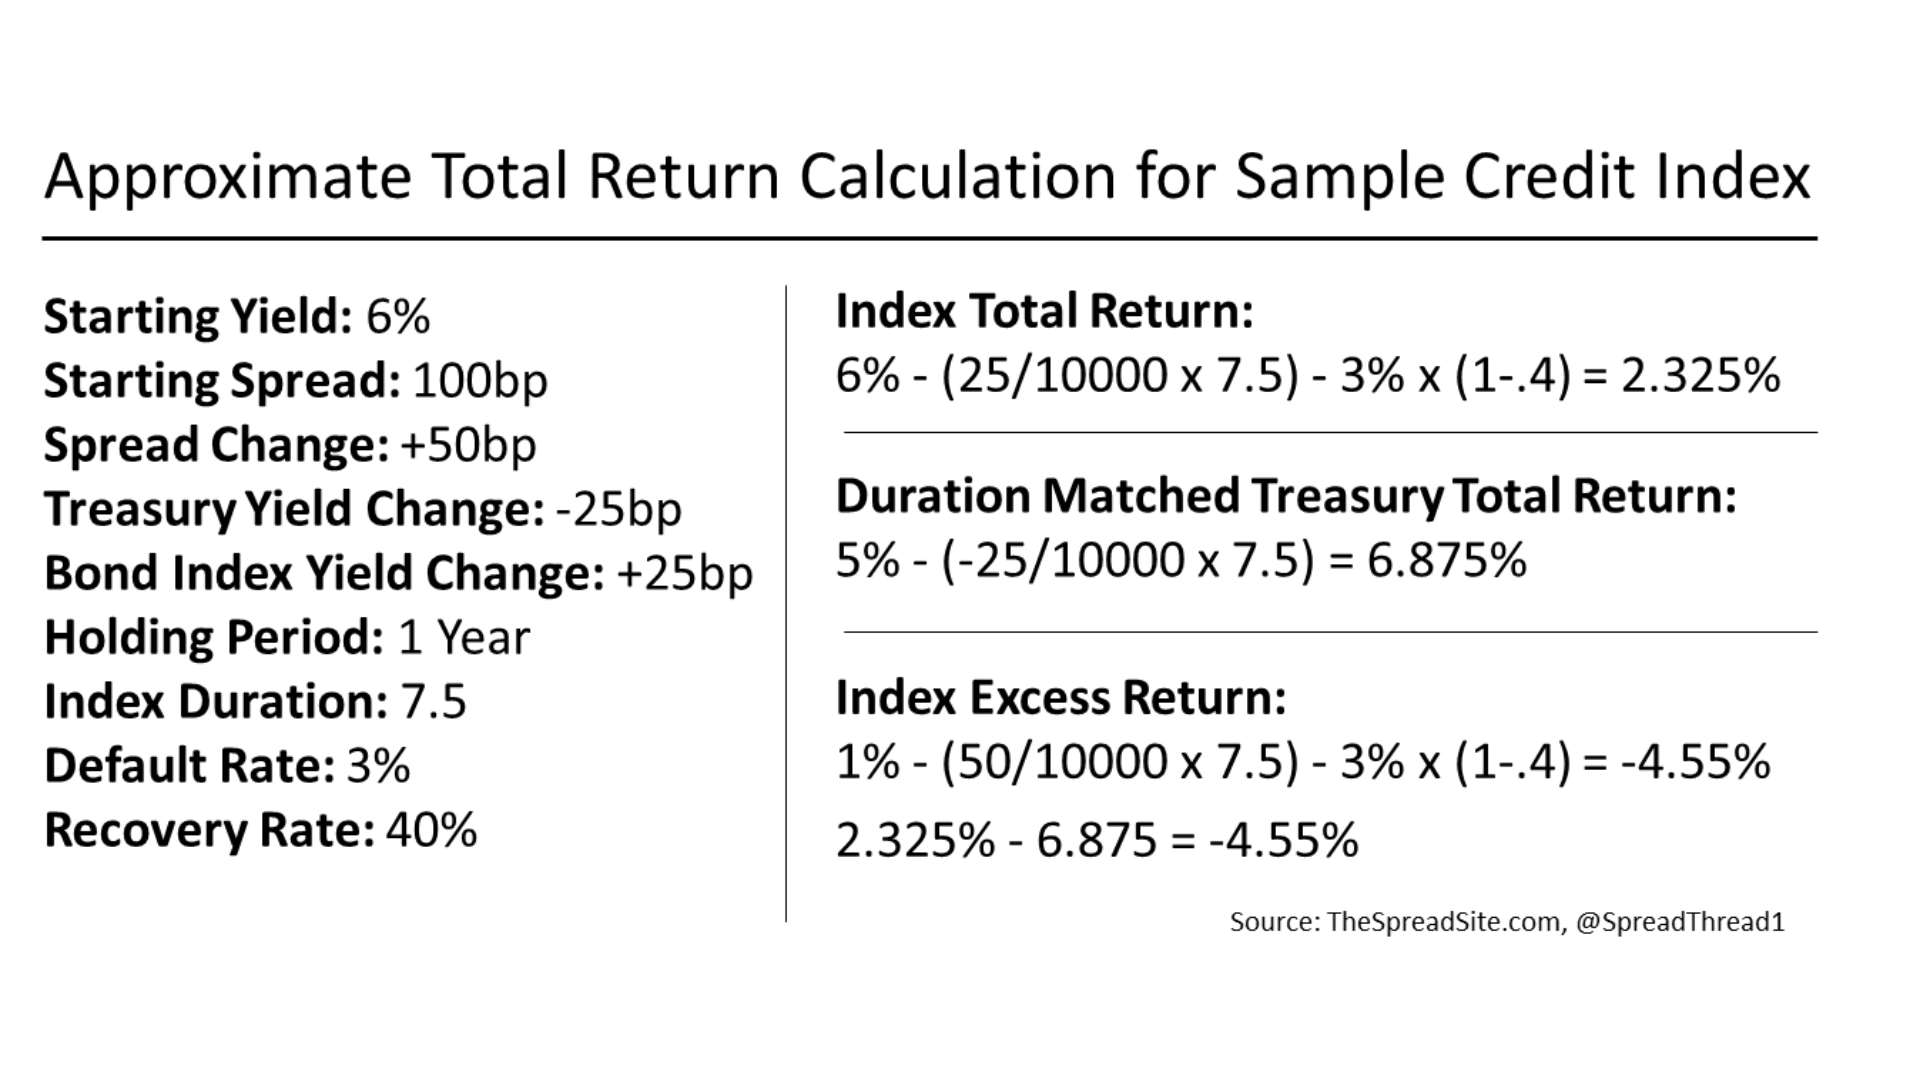
Performance: Total Return measures the rate of return on (in this case) a bond taking into consideration price change and coupon. Excess Return is typically calculated as the total return of a corporate bond minus the total return of a duration matched Treasury bond. Below – A sample return calculation for a credit index.
Investment Grade Credit
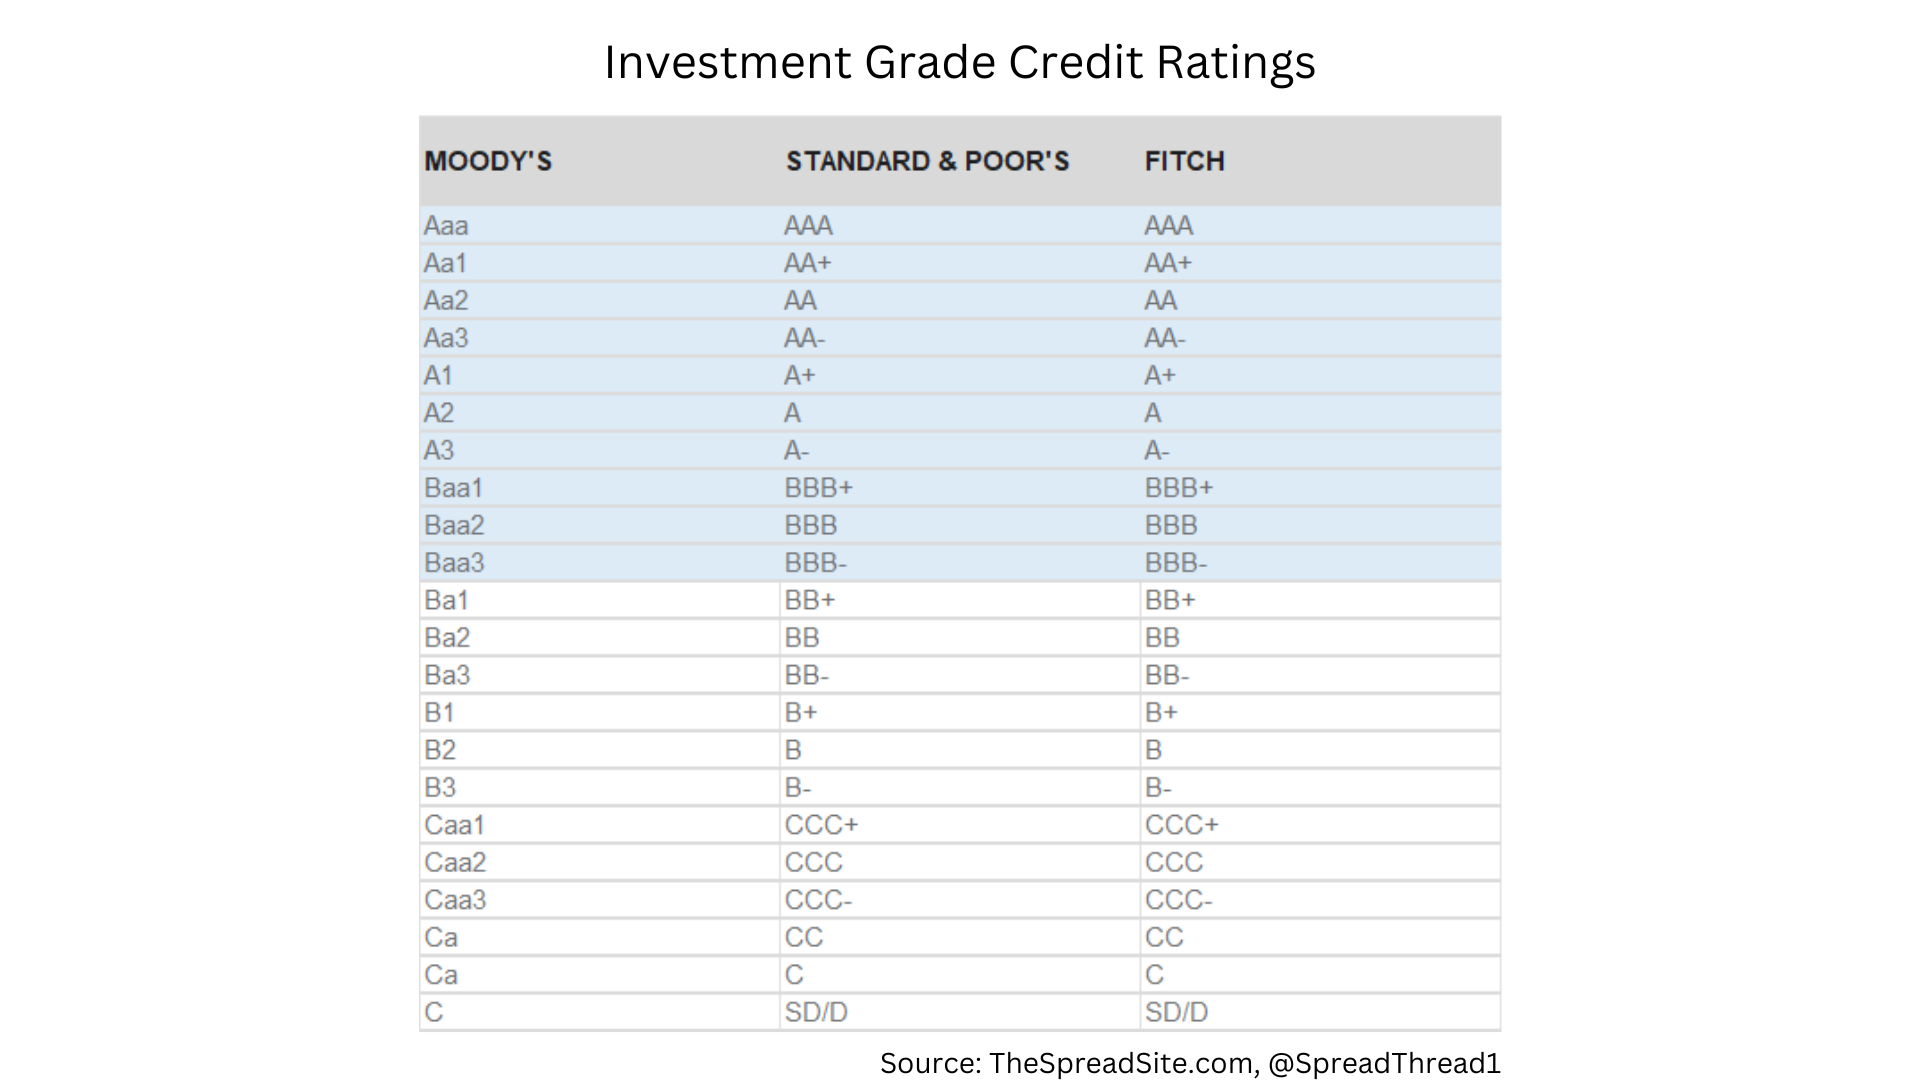
Investment grade (IG) corporate bonds are rated BBB- or higher, and on average are made up of businesses at lower risk of default due to better fundamentals (i.e., lower leverage) than those in the high yield market. Investment grade corporate bond indices measure the performance of this market, and are used as benchmarks by certain money managers. As an example, the Bloomberg US Corporate Bond Index tracks the investment grade market. Below is a subset of requirements for inclusion in this index as well as a few key details:
- Securities must be rated IG (Baa3/BBB-/BBB- or higher) using the middle rating of Moody’s, S&P, and Fitch. Other rules apply if the security has two or fewer ratings.
- Principal and interest must be denominated in USD.
- $300mm minimum par amount outstanding.
- Fixed-rate coupon bonds only.
- Bonds must have at least one year until final maturity.
- Only fully taxable issues are eligible.
- Global bonds are included.
- Senior and subordinated bonds are included.
- The index is rebalanced at each month-end and represents the fixed set of bonds on which returns are calculated for the next month.
- Newly issued bonds are eligible for inclusion in the following month’s index.
Some datapoints on the investment grade bond market:
- There is now about $8 trillion in IG corporate debt outstanding.
- The ratings quality of the market has deteriorated over time. In 1990 about 10% of IG debt was AAA rated and about 25% was BBB. Now around half the market is BBB and there are only a few AAA corporate issuers left.
- There are about 7,600 bonds in the IG index and ~850 individual companies.
- The average bond in the IG index has just under 11 years to maturity and ~7 duration.
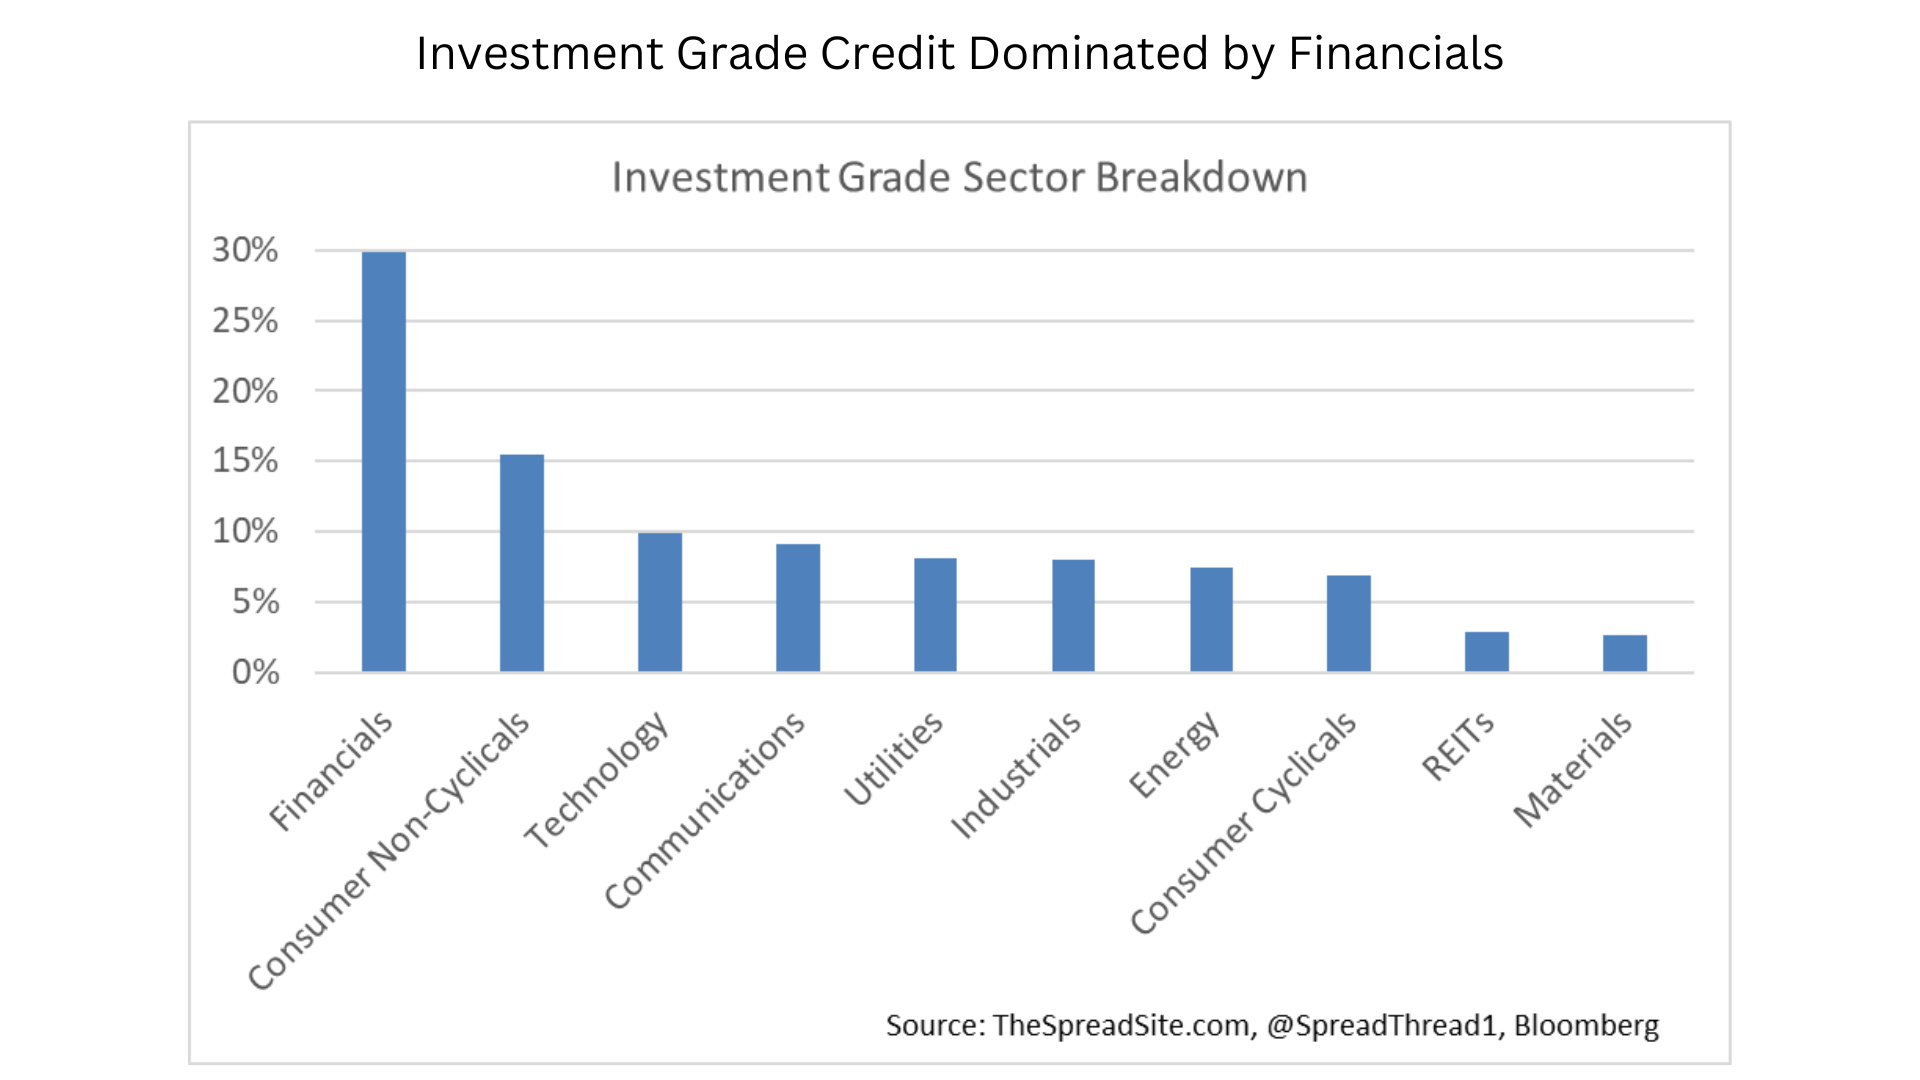
- Financials are the largest IG sector, at about 30% of the index. Consumer non-Cyclicals is a distant second at 15%.
- Most IG debt is fixed rate. Some bonds are issued with floating-rate coupons though these are not included in the traditional credit indices.
- The biggest holders of IG bonds are non-US institutions and insurance companies.
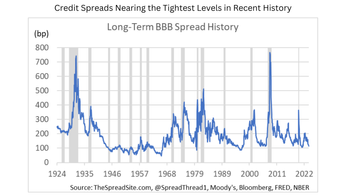
Investment grade spreads have historically traded as low as ~75bp at the tights in bull markets, and ~250bp at the wides in recessions, though briefly hit ~600bp during the financial crisis. Below is a very long-term history of BBB spreads.
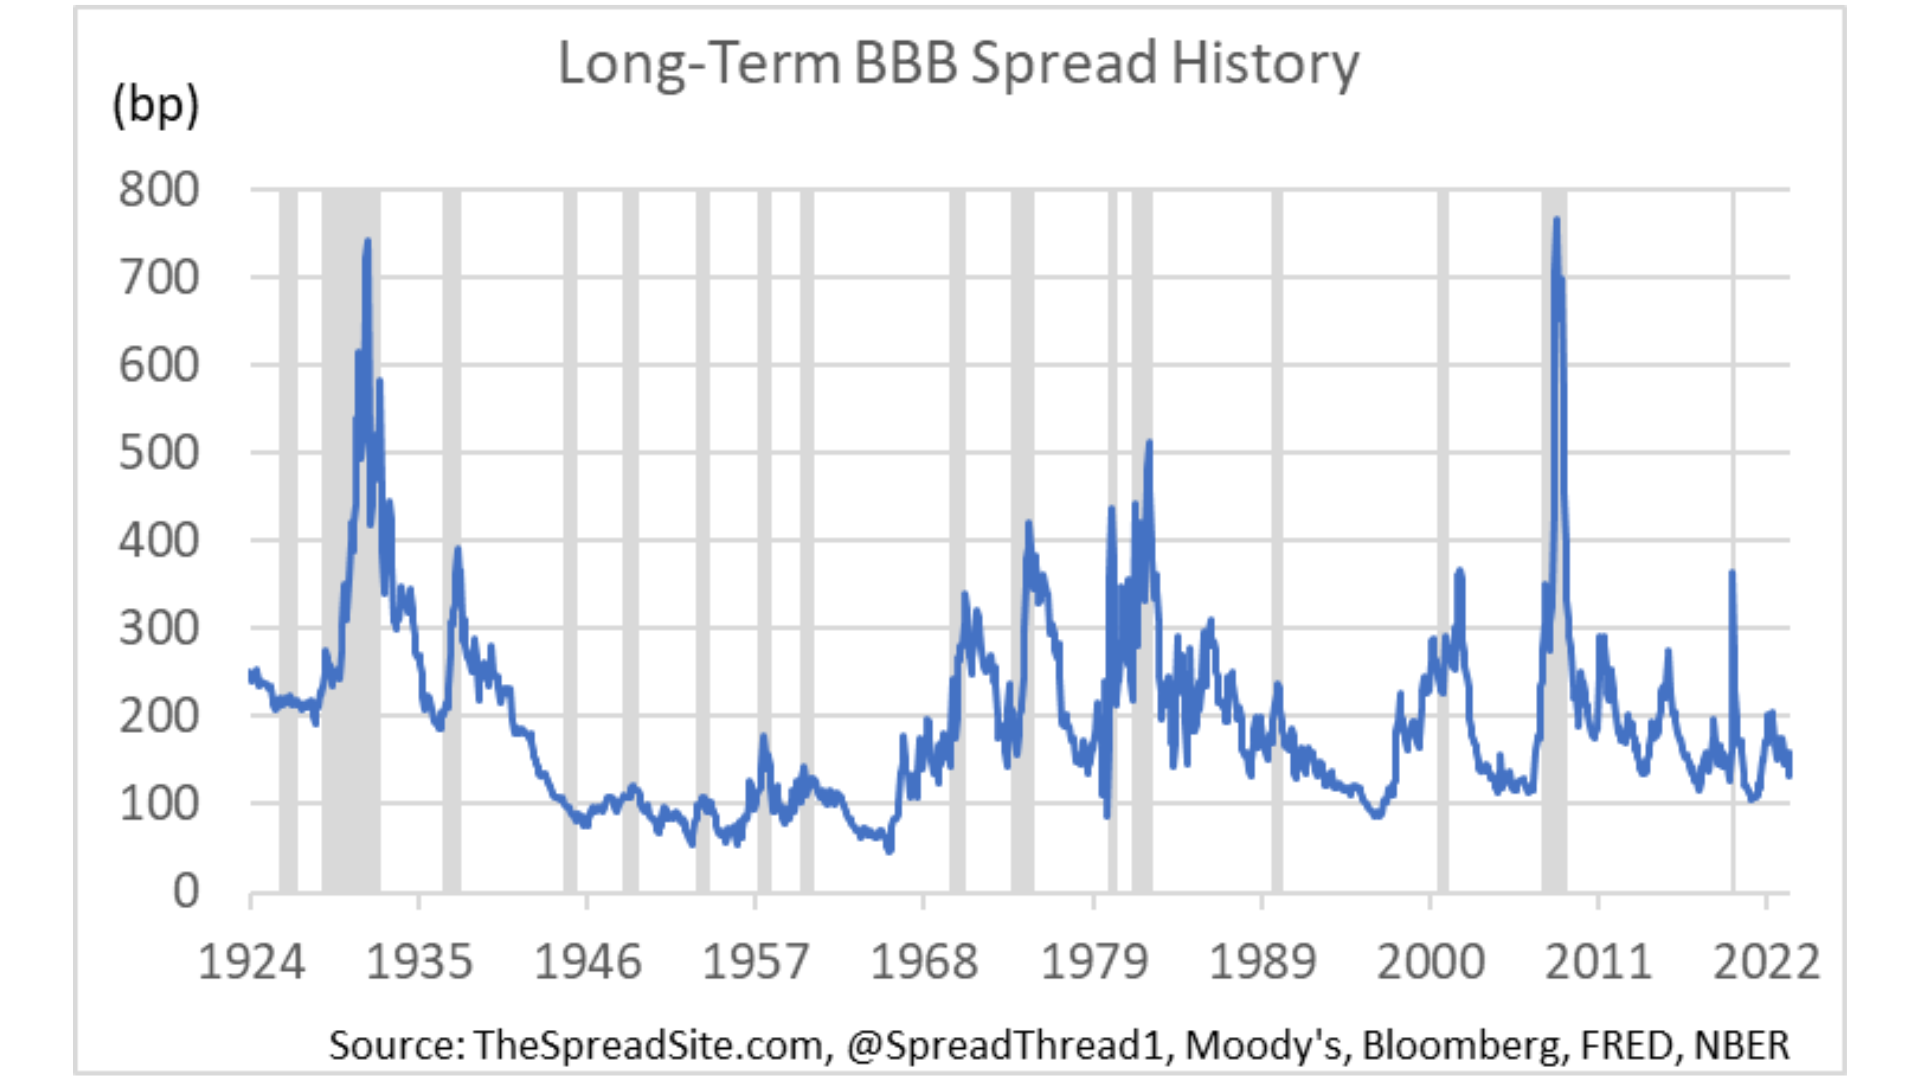
Finally, the upside with owning investment grade corporate bonds versus other areas in corporate credit is that default risk is minimal outside of fraud (Enron/WorldCom) or a financial crisis (Lehman Brothers). Also, IG companies tend to have lower fundamental risks, and are better positioned to withstand difficult economic times, and therefore investment grade is the low beta asset class vs high yield.
The risks with investment grade bonds are first, a downgrade from IG to HY (called a “Fallen Angel”) can lead to a material widening in spreads. This risk is higher in the market today given the growth in BBB debt outstanding as a percentage of the overall IG market, as noted above. Second, investment grade bonds are longer duration than high yield, typically with tighter spreads, often making them more exposed to rising rates. Third, a systemic/financial crisis will often hit investment grade hardest because of its meaningful exposure to the financial sector.
High Yield Credit
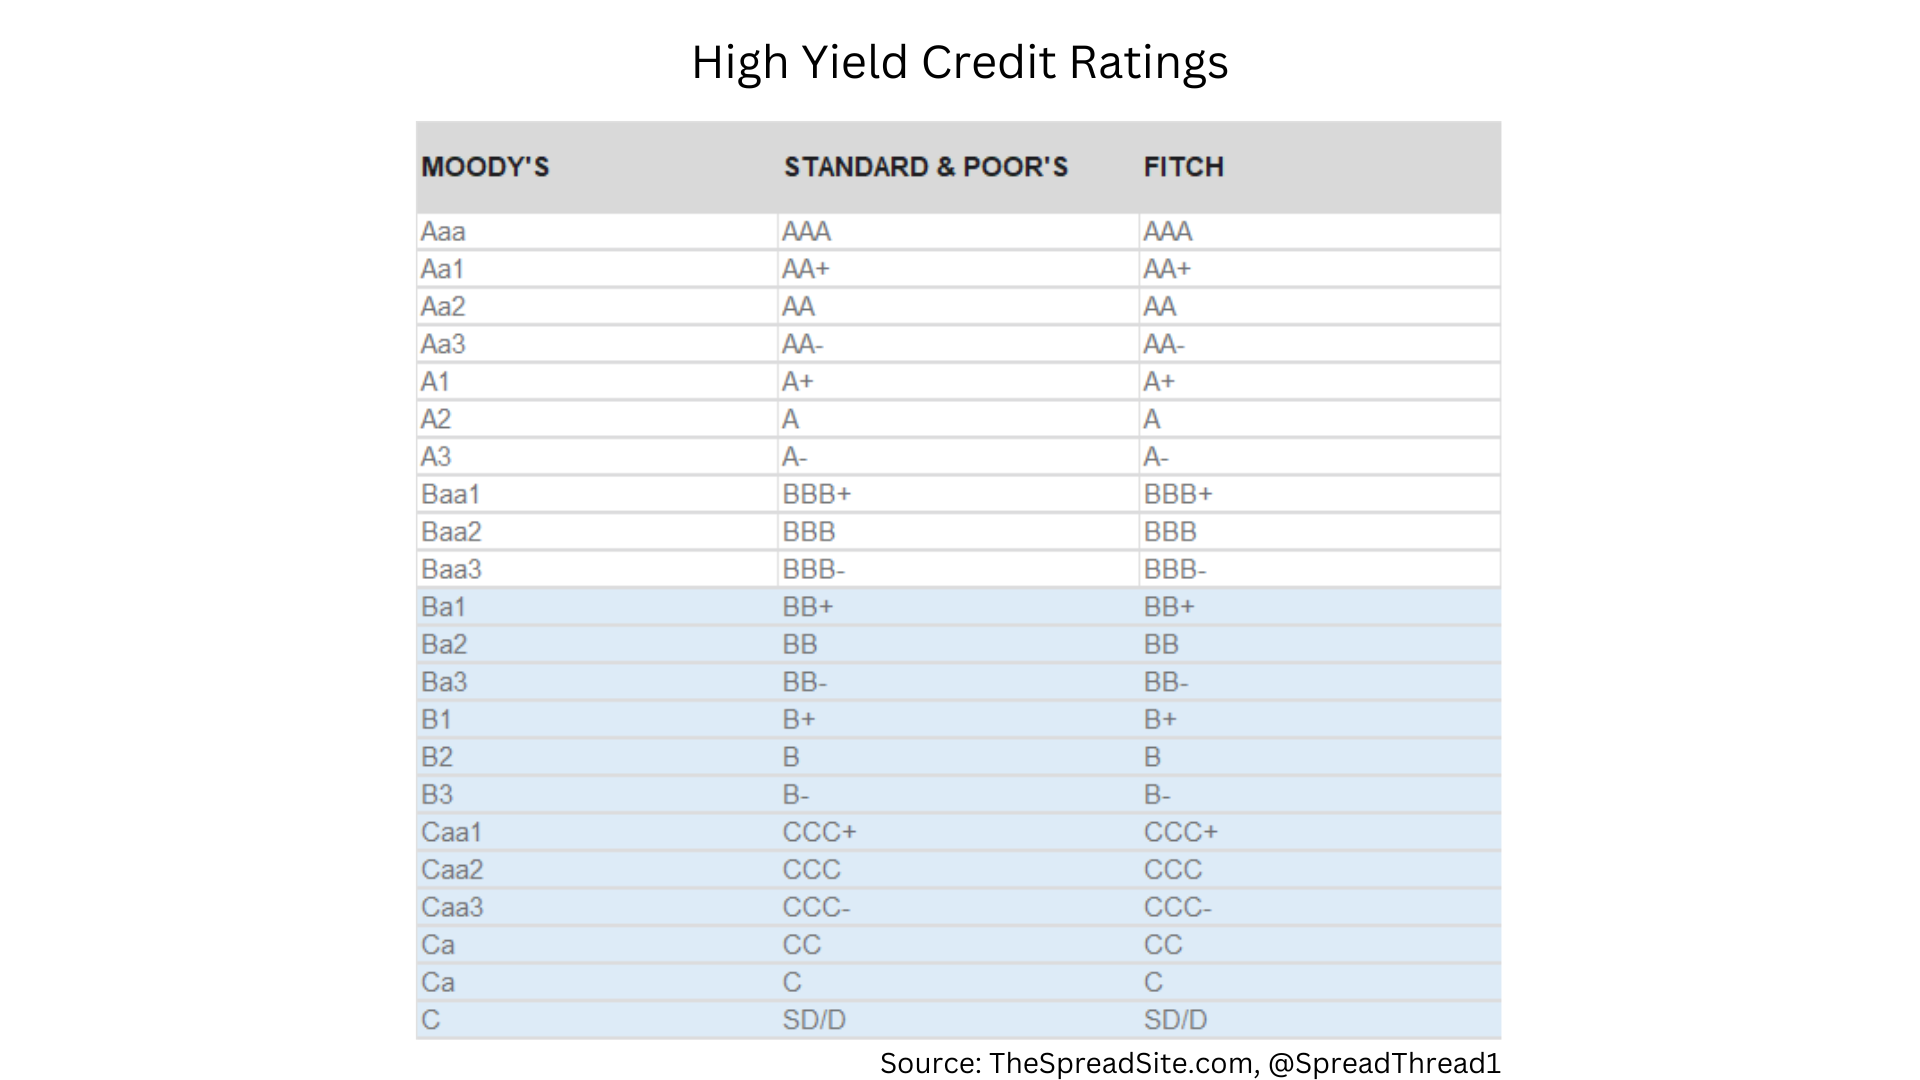
High Yield (HY) corporate bonds are rated BB+ or lower, and on average are made up of businesses at higher risk of default due to weaker fundamentals (i.e., higher leverage) than those in the investment grade market. Especially with high yield, fundamental analysis, the capital structure composition, and the details of a bond issue (covenants, etc…) are quite important (more on this in the sections below).
Prior to the 1980s, the high yield market was predominately comprised of “fallen angels” (defined in the IG section above). The LBO boom in the 1980s helped kickstart the new issue high yield market, with below-investment grade companies issuing bonds to finance LBOs, M&A, fund growth, and to refinance existing bonds and loans.
High yield corporate bond indices measure the performance of this market, and are used as benchmarks by some money managers. As an example, the Bloomberg US Corporate High Yield Index tracks the high yield market. Below is a subset of requirements for inclusion in this index as well as a few key details:
- Securities must be rated HY (Ba1/BB+/BB+ or lower) using the middle rating of Moody’s, S&P, and Fitch. Other rules apply if the security has two or fewer ratings.
- Principal and interest must be denominated in USD.
- $150mm minimum par amount outstanding.
- Fixed-rate coupon bonds only.
- Pay-in-kind (PIK) bonds and toggle notes are eligible.
- Bonds must have at least one year until final maturity.
- Only fully taxable issues are eligible.
- Bonds from issuers with an emerging markets country of risk, based on the indices’ EM country definition, are excluded.
- Senior and subordinated bonds are included.
- A security with both SEC Regulation-S (Reg-S) and SEC 144A tranches is treated as one security for index purposes. The 144A tranche is used to prevent double-counting and represents the combined amount outstanding of the 144A and Reg-S tranches.
- The index is rebalanced at each month-end and represents the fixed set of bonds on which returns are calculated for the next month.
- Newly issued bonds are eligible for inclusion in the following month’s index.
Some datapoints on the high yield bond market:
- There is now about $1.5 trillion in HY corporate debt outstanding.
- There are about 2,000 bonds in the HY index and ~900 individual companies.
- The average bond in the HY index has about 5 years to maturity and ~3.2 duration.
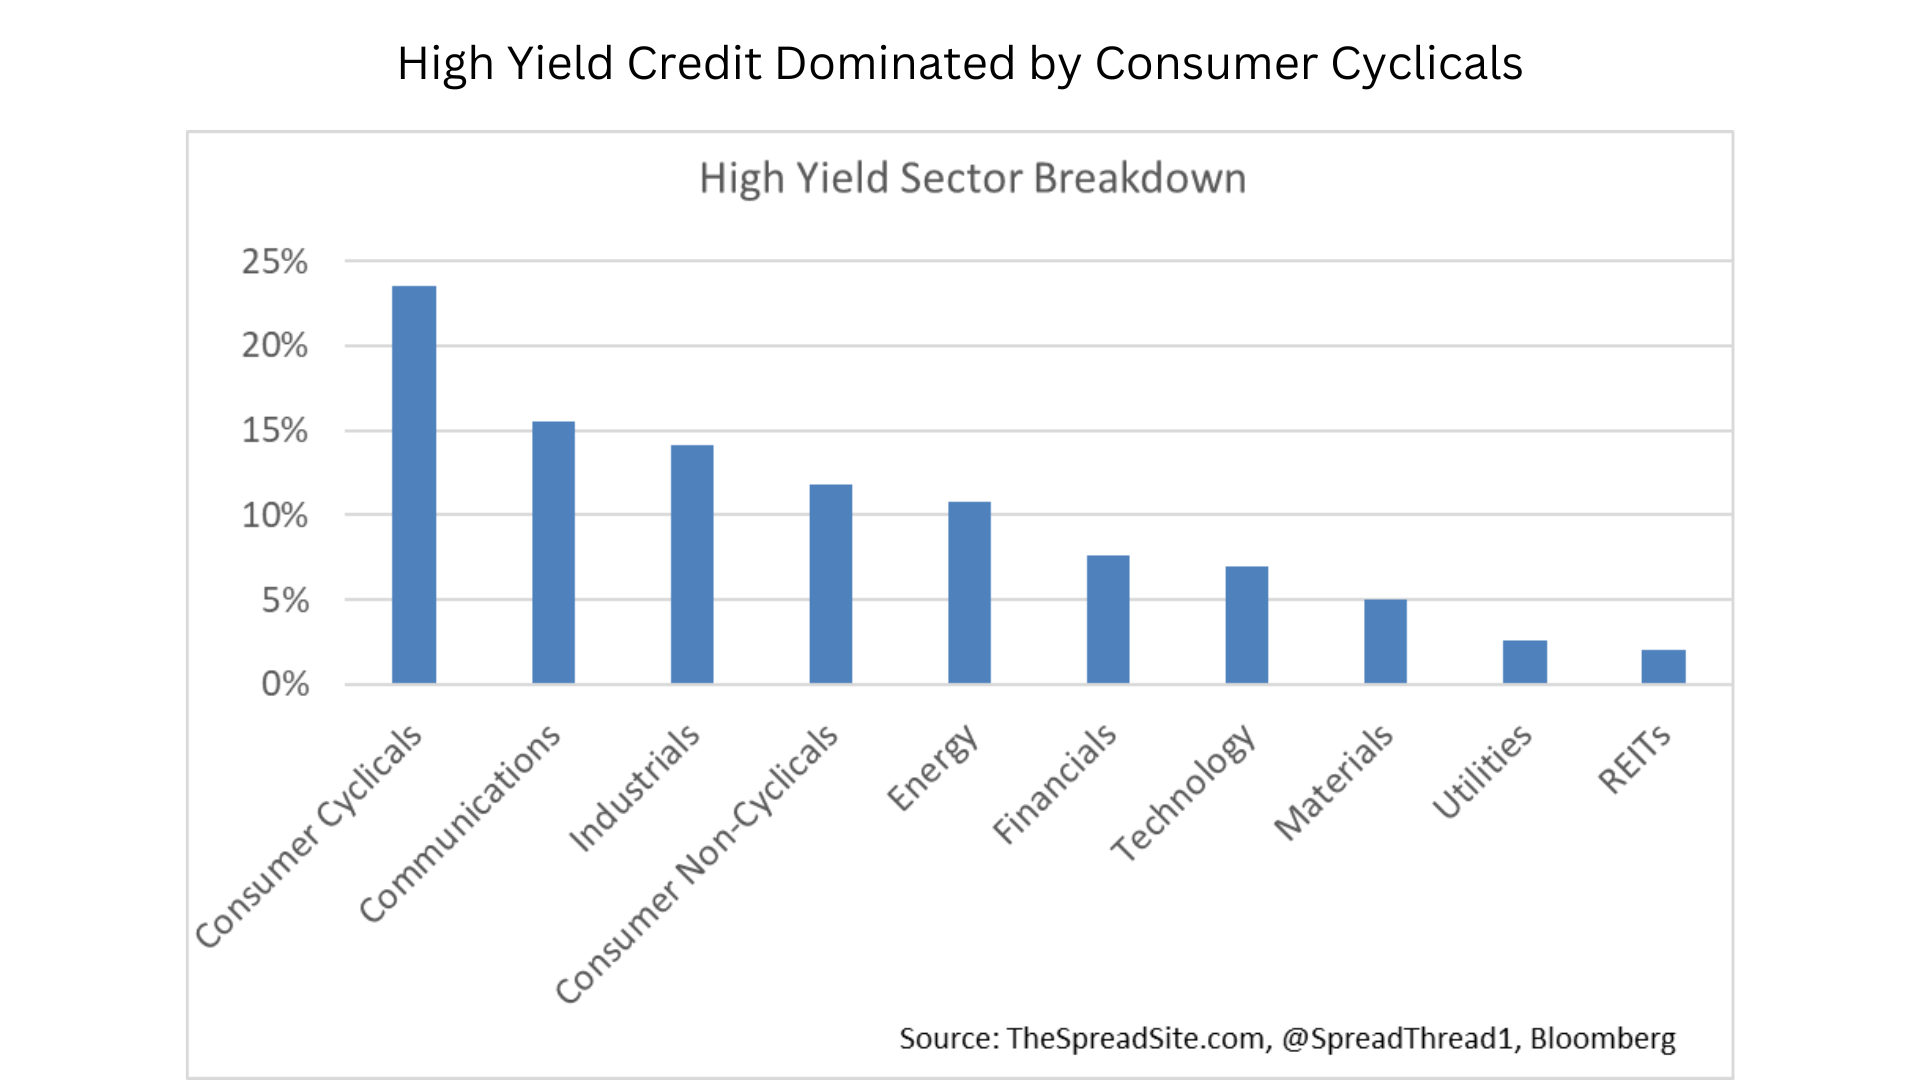
- Consumer Cyclicals are the largest HY sector, at about 24% of the index.
- Most HY debt is fixed rate. Some bonds are issued with floating-rate coupons though these are not included in the traditional credit indices.
- Most HY bonds are callable. For example, they may be issued with a 10Y maturity, non-callable until year 5. At year 5, they are callable often for par plus 50% of the coupon, with the call premium declining in each subsequent year.
- About 28% of HY bonds are issued by private companies (without publicly traded equities)
- Secured bonds have a priority claim to pledged assets over unsecured creditors. About 30% of the HY market is made up of secured bonds, with secured issuance increasing as a share of overall issuance in tougher macro environments.
- Pay-in-kind (PIK) bonds are when an issuer can pay a coupon with additional bonds instead of with cash, a structure at times utilized by weaker quality companies.
- The biggest holders of HY bonds are HY/income mutual funds, insurance companies and pension funds.
High yield spreads have historically traded as low as ~250bp at the tights in bull markets, and ~1000bp at the wides in recessions, though briefly hitting ~2000bp during the financial crisis. Below is a long-term history of high yield spreads.
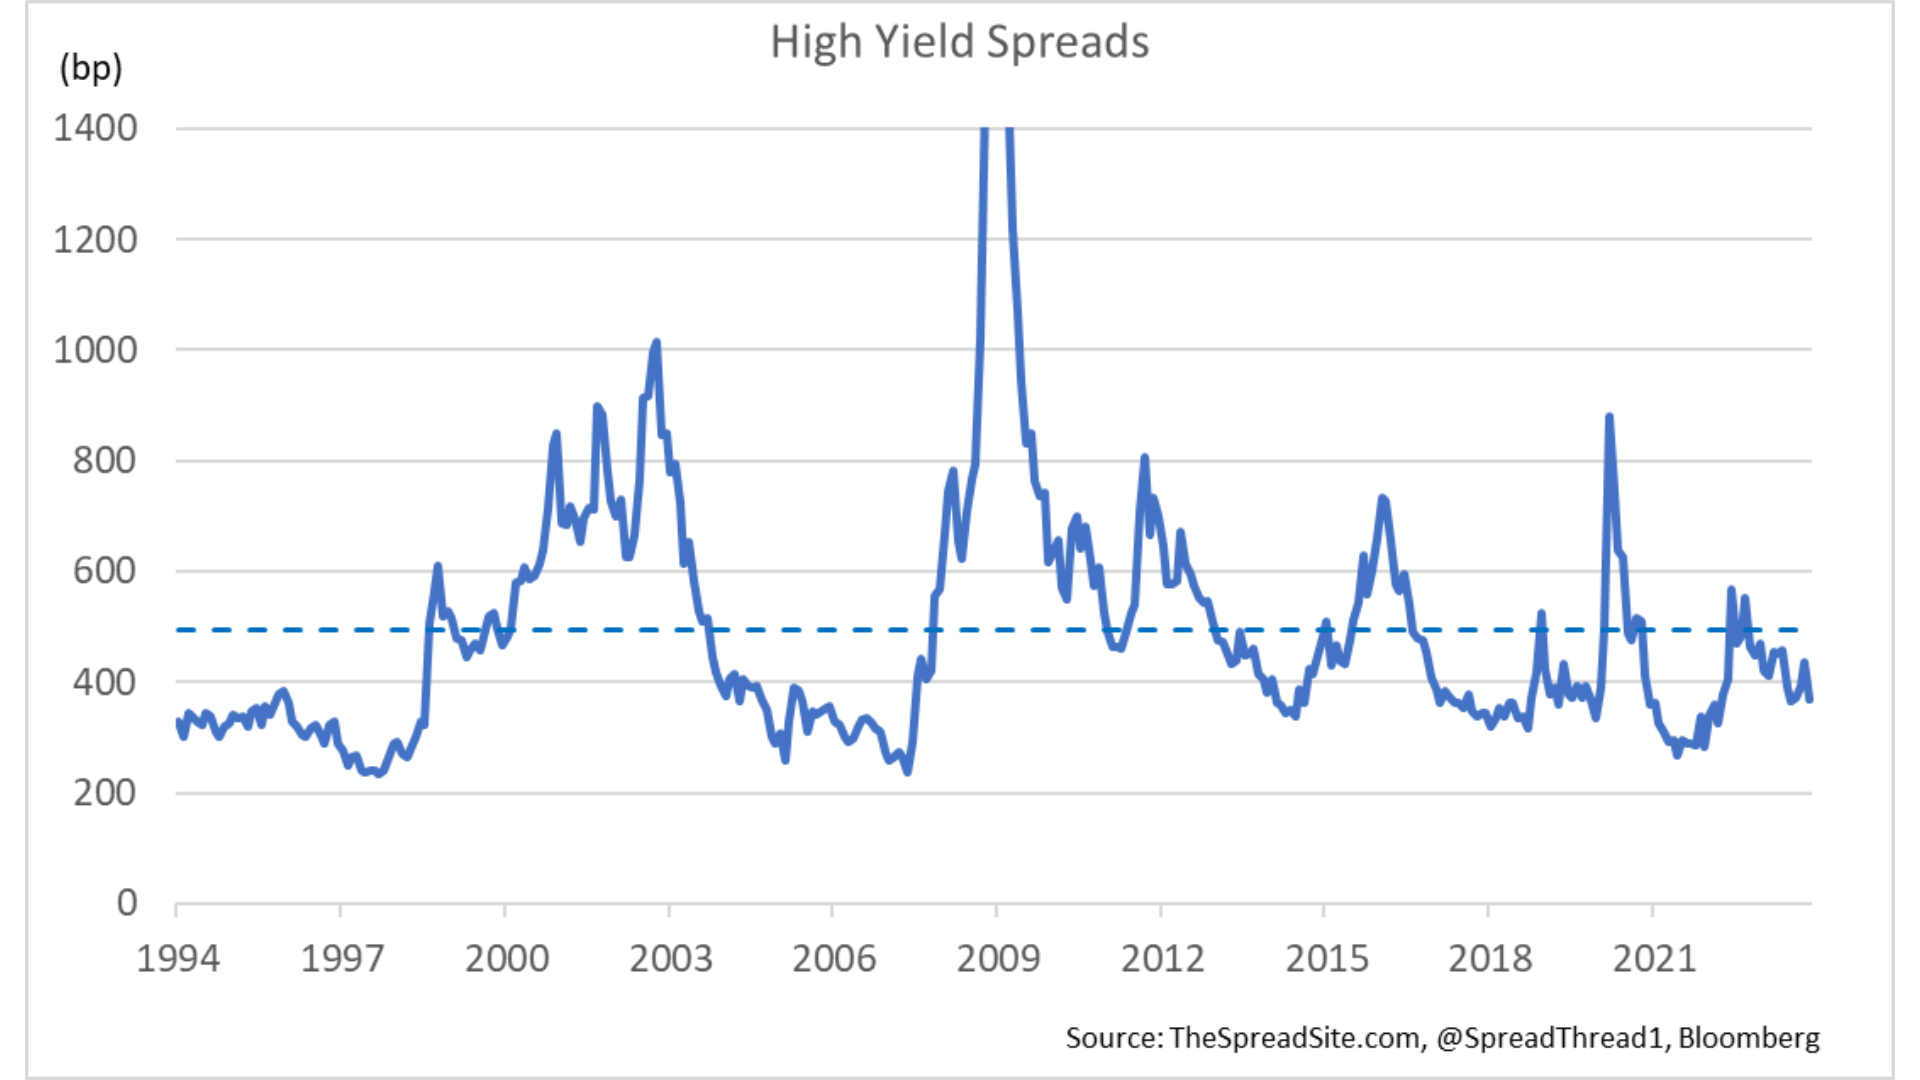
Finally, the upside with owning high yield corporate bonds versus higher quality credit is that spreads are wider, and therefore should outperform in a stronger market (i.e., higher beta). Additionally, HY is shorter duration that IG and therefore is usually less sensitive to rising rates. And unlike the ratings quality deterioration noted in the IG market, a growing share of HY is now in BB bonds (high quality HY) vs past cycles.
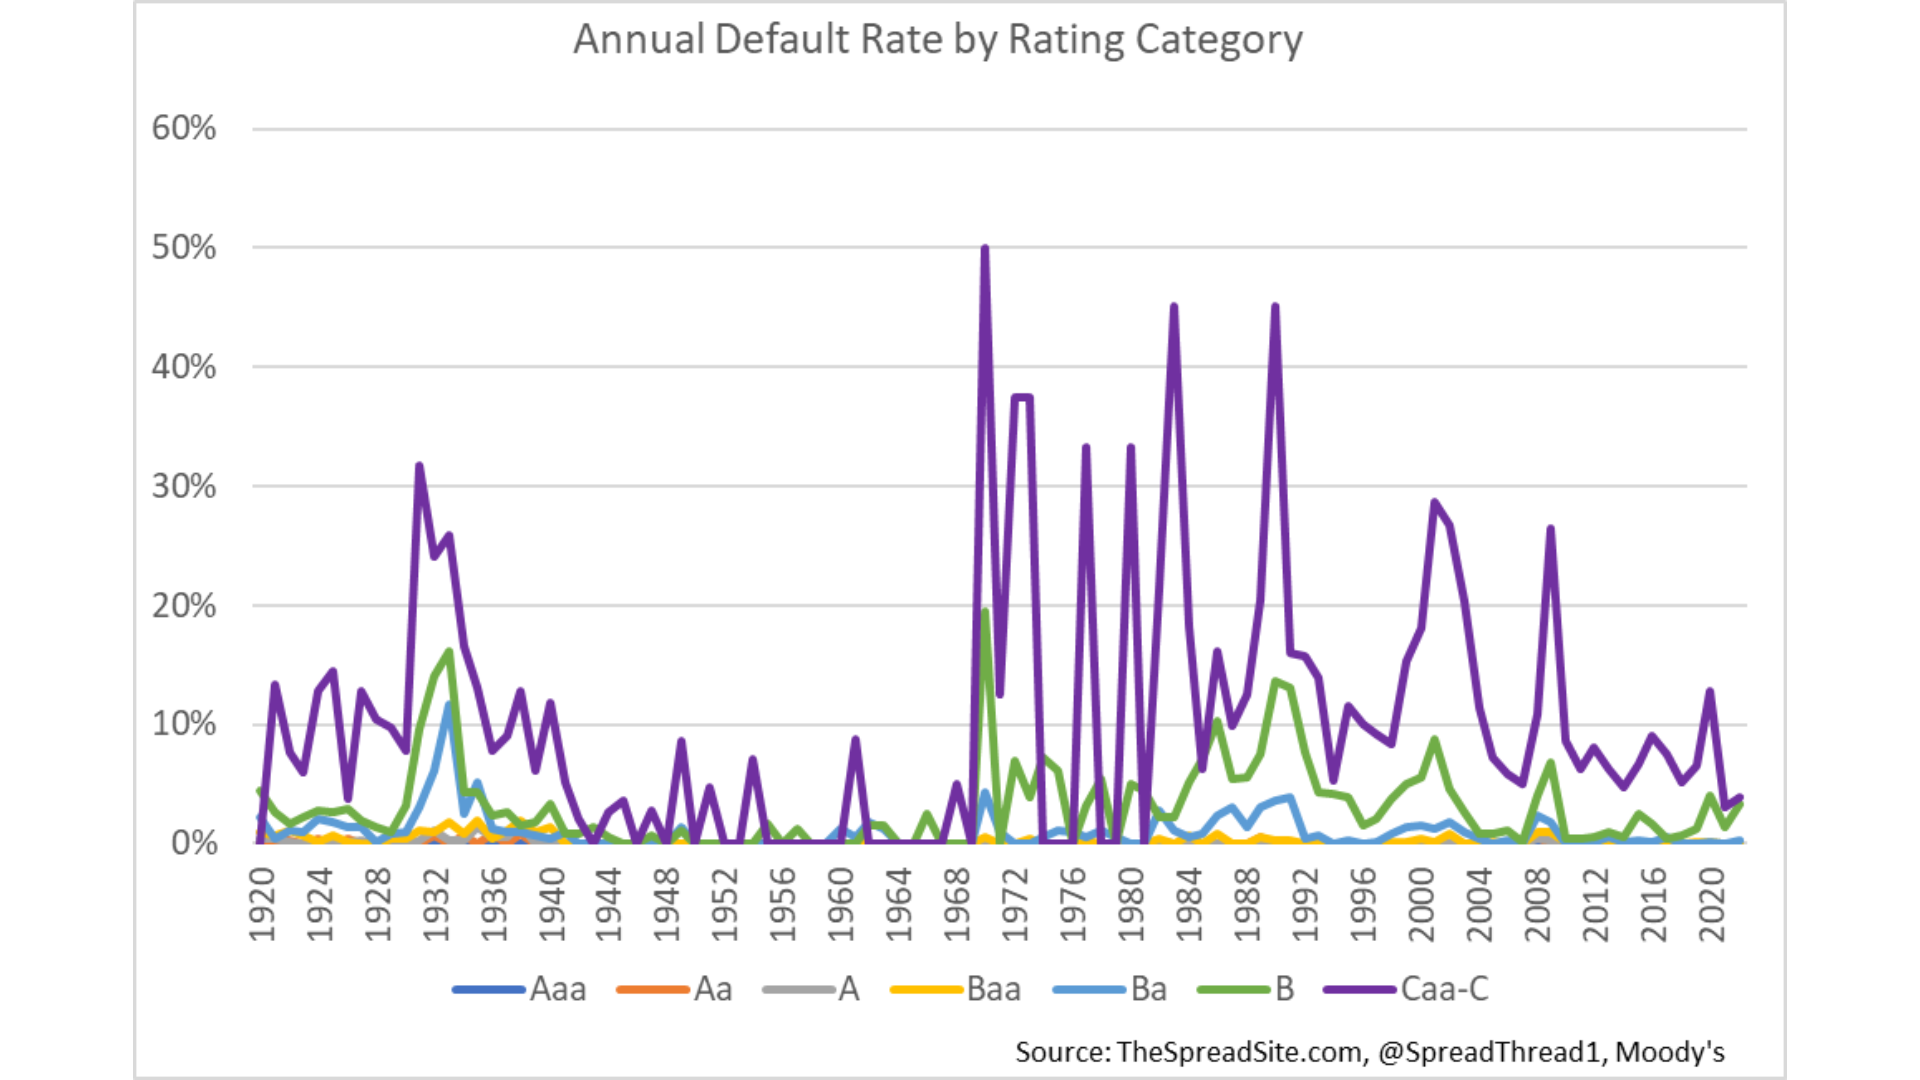
The key risk to high yield is that defaults will be much higher than IG and therefore the former will underperform in a weaker economy. As we show below, almost all defaults in a credit cycle come from high yield companies, especially those rated B and CCC. Additionally, HY has a larger share of “old economy” companies that are in secular decline. And HY tends to have weaker trading liquidity (true to some extent for all credit markets), which can lead to a gap in prices on the way down.
Leveraged Loans
Per S&P, the syndicated loan market consists of “commercial credit provided by a group of lenders. It is structured, arranged, and administered by one or several commercial or investment banks, known as arrangers.” In short, leveraged loans are loans made predominantly to companies with high yield ratings, that are sold to banks and institutional investors, and often actively traded in the secondary market. Institutional loans are term loans structured primarily for institutional investors. Pro-rata loans include revolving credit and amortizing loans typically sold to banks.
Leveraged loans have the following differences from high yield bonds:
- They are floating rate instruments, benchmarked off SOFR (originally LIBOR).
- Loans are typically senior secured debt, often ranking higher in the capital structure than high yield bonds (which are typically unsecured). As a result, defaulted loans historically had higher recovery rates than high yield bonds, on average. The majority of the leveraged loan market is made up of 1st lien loans. 2nd lien loans rank behind 1st lien loans in a bankruptcy and are typically lower in credit quality.
- Loans historically had more stringent covenants than HY bonds, but with the advent of cov-lite loans (more in the covenant section below), loan covenants became more “bond-like.”
- Loans are often issued with maturities of ~7 years, but can typically be pre-paid anytime, often with “soft-call” protection, meaning a fee to pre-pay in the first year or two.
- Additionally, a large portion of the loan market is made up of smaller, usually private companies that often would not have access to the high yield bond market.
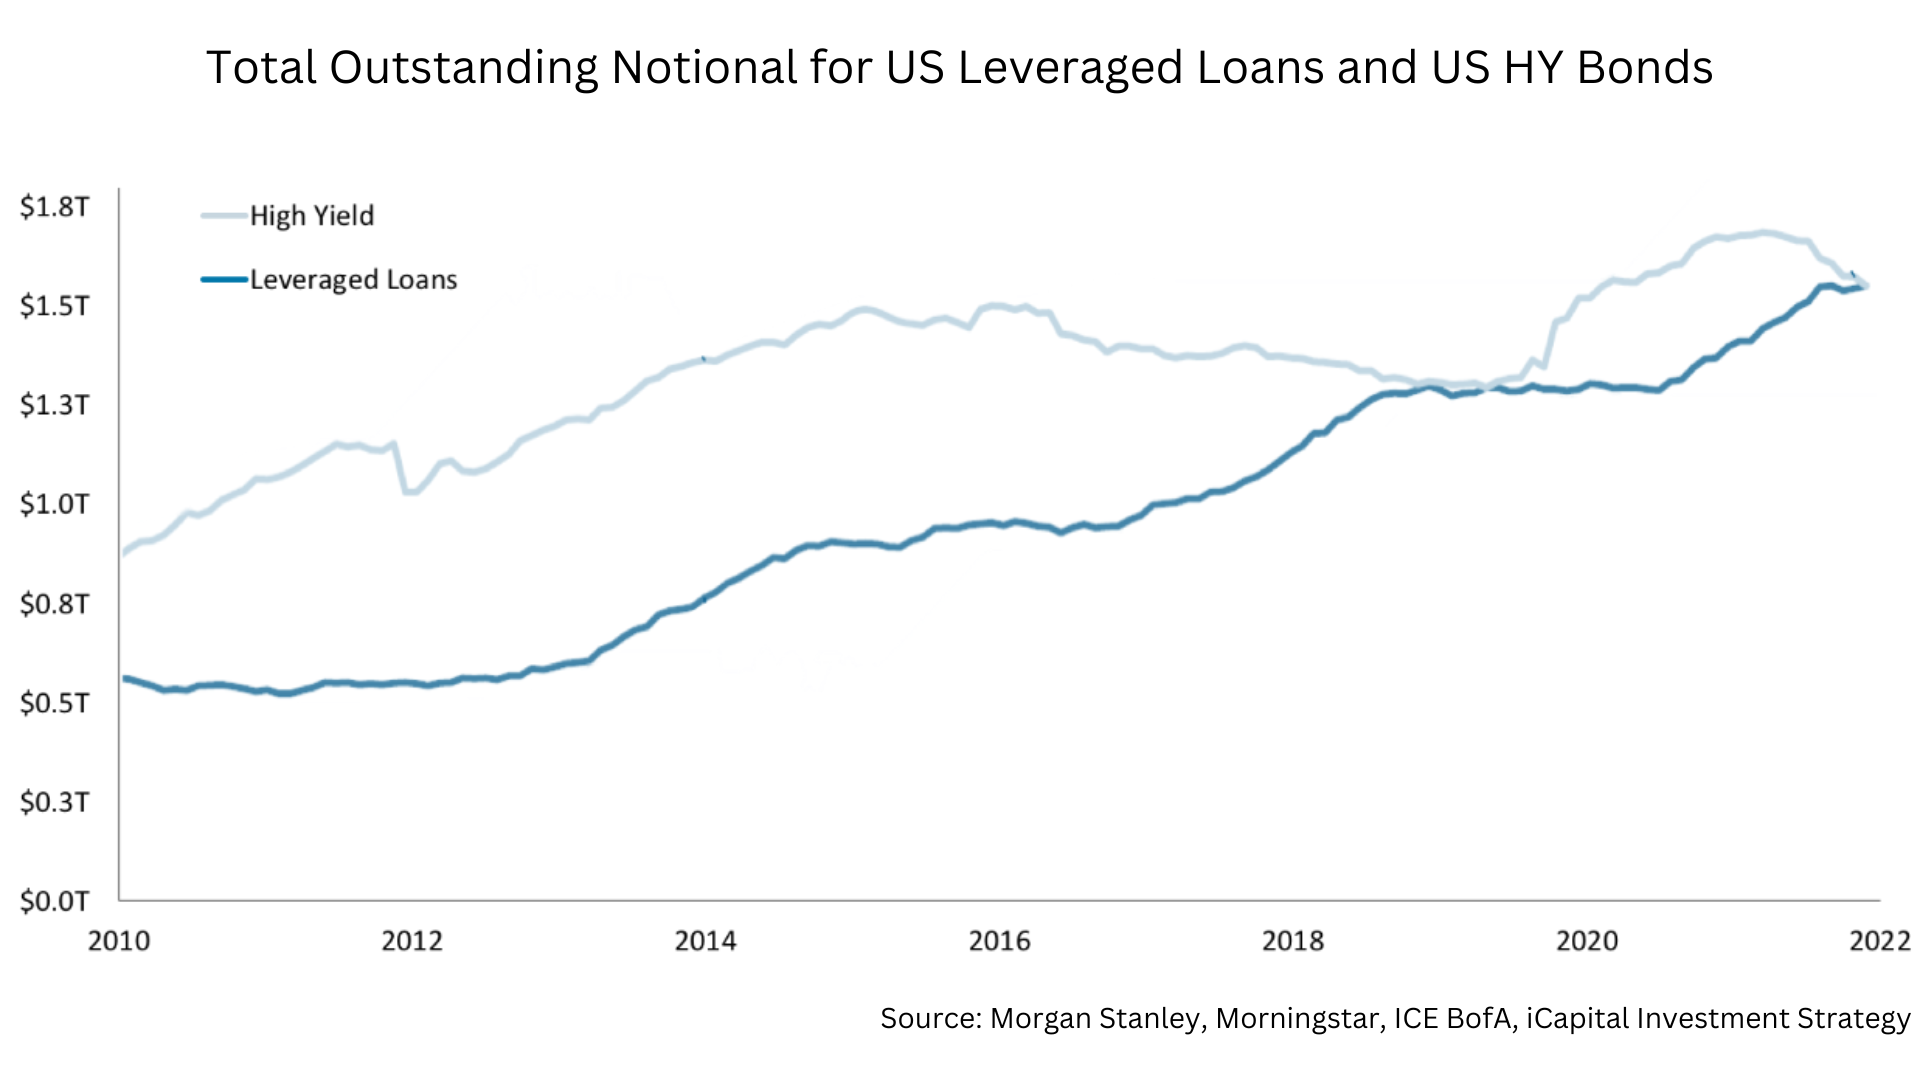
Leveraged loans are used to finance mergers and acquisitions, leveraged buyouts (LBOs), for recapitalizations (for example, taking on debt to issue a dividend), as well as general corporate purposes. The loan market has increasingly become the primary financing vehicle for M&A in the below investment grade market (especially LBOs) which has driven much faster growth in the loan market (vs HY) over the past decade. The leveraged loan market is now ~$1.5 trillion outstanding, similar in size to the high yield bond market.
About 60% of the loan market is owned by Collateralized Loan Obligations (CLOs), followed by loan mutual funds, insurance companies, and hedge/distressed/high yield funds.
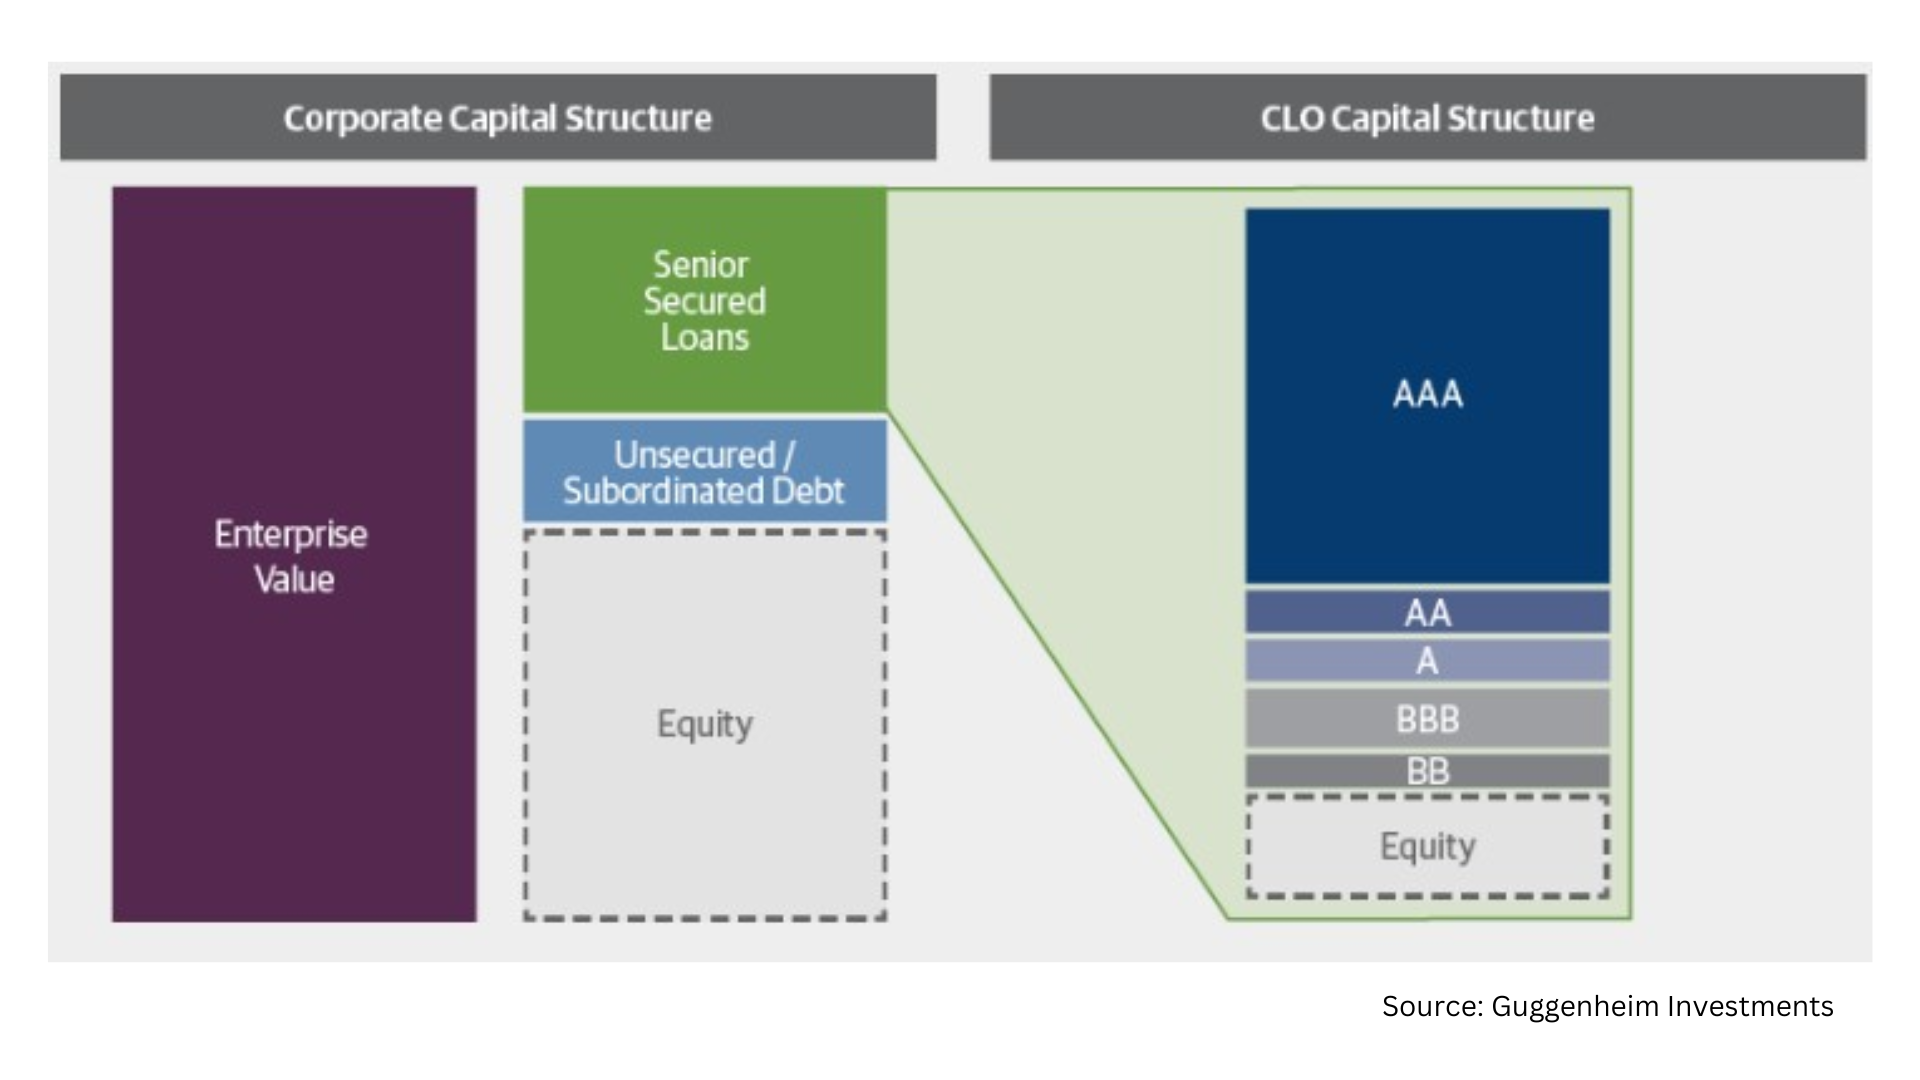
While we won’t go through CLOs in detail in this primer, in short, a CLO invests in a diversified pool of leveraged loans, slices the loans into tranches, which are then sold to investors. Any losses from the underlying loans are taken by the junior most tranches first. As a result, the senior tranches (i.e., AAAs) trade at the tightest spreads, but take on the least risk. Japanese banks have historically been some of the biggest buyers of CLO AAAs as well as other banks and money managers. CLO mezz/equity is owned by hedge funds, PE firms, and CLO managers.
The upside of owning leveraged loans is the seniority in the capital structure provides protection in the event of default. Additionally, the floating rate nature of the asset class provides protection from rising rates.
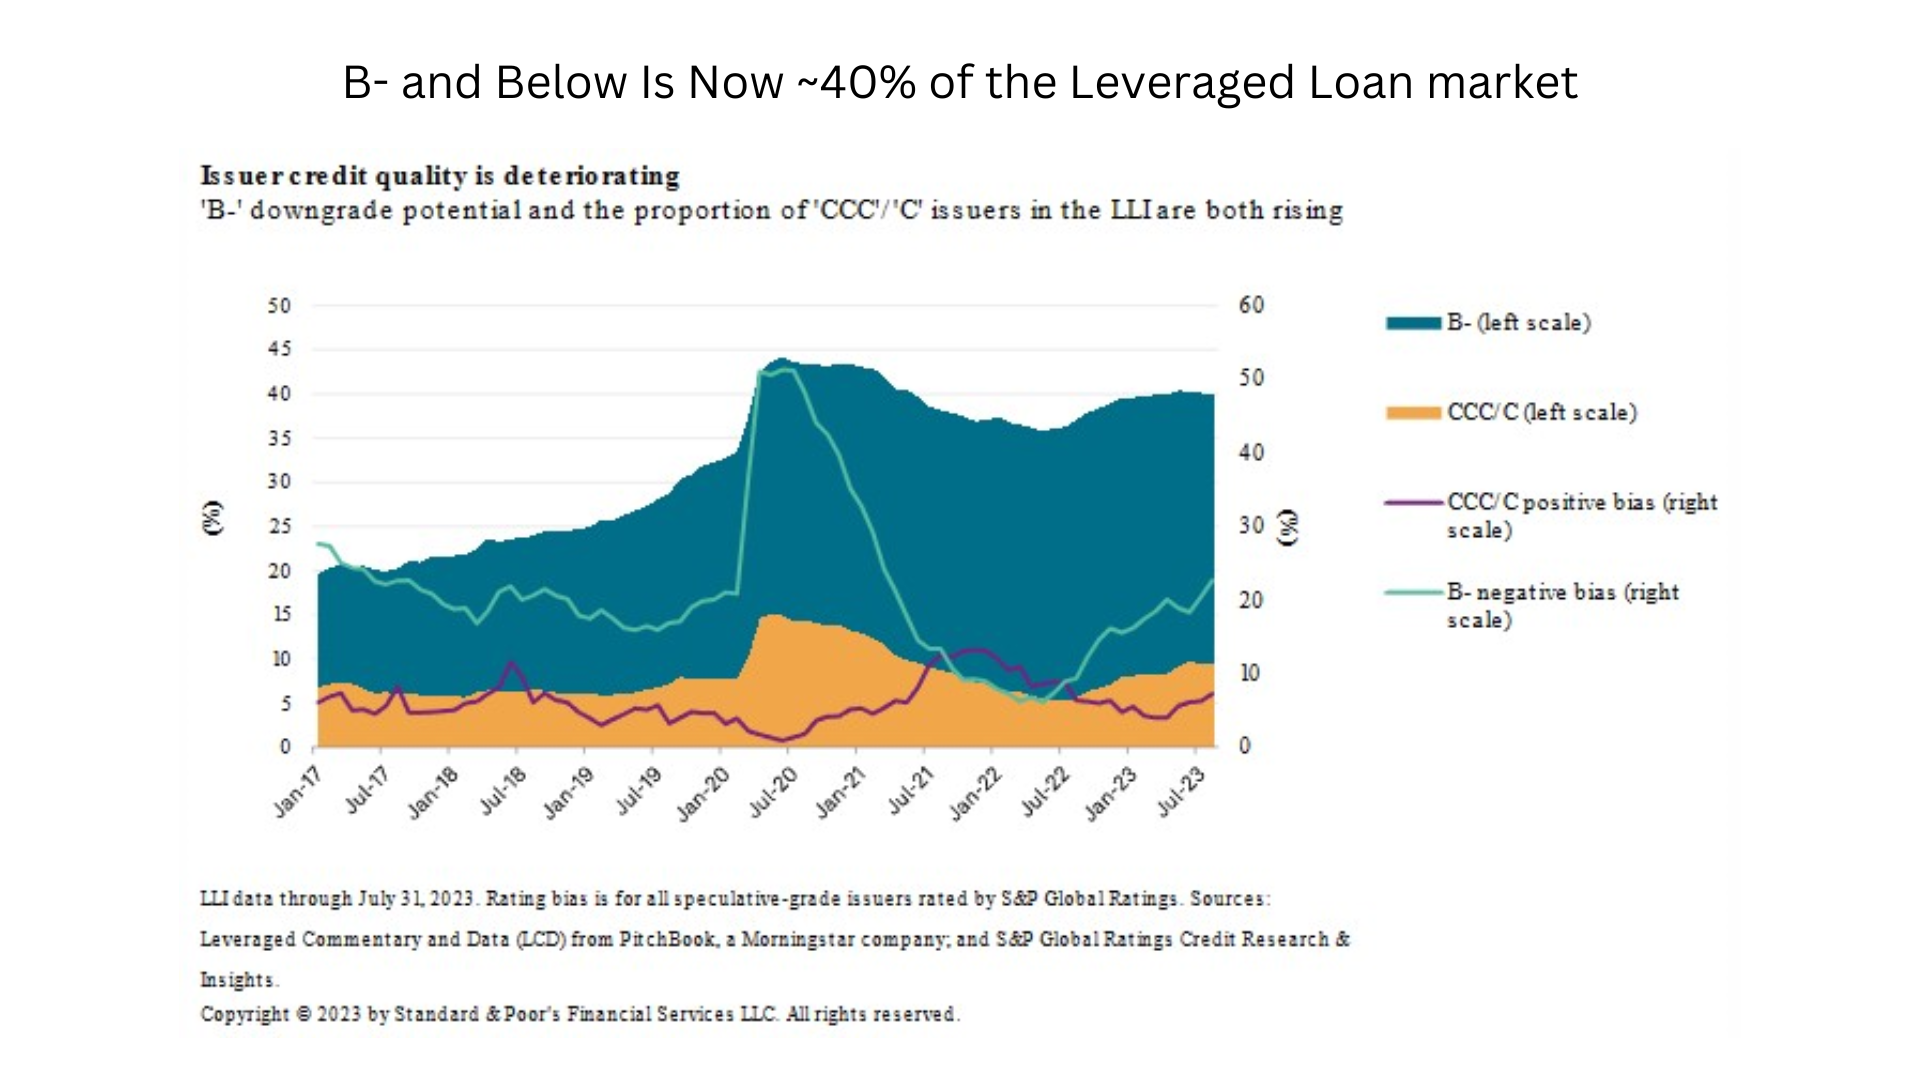
The risks in loans are similar to high yield bonds – lower rated companies tend to default at a greater rate in tough economic periods. However, unlike high yield, the credit quality of the loan market has deteriorated over the past 10-15 years. For example, loans are now lower rated on average with B- and lower rated loans a much bigger share of the market. Additionally, loan leverage levels have risen post-crisis as investors reached for yield, with a corresponding deterioration in loan covenant quality. Finally, a greater share of the loan market is “loan-only” without unsecured bonds in the capital structure to cushion investors in the event of default. These factors combined could mean higher defaults and lower recovery rates for loans in the next default cycle.
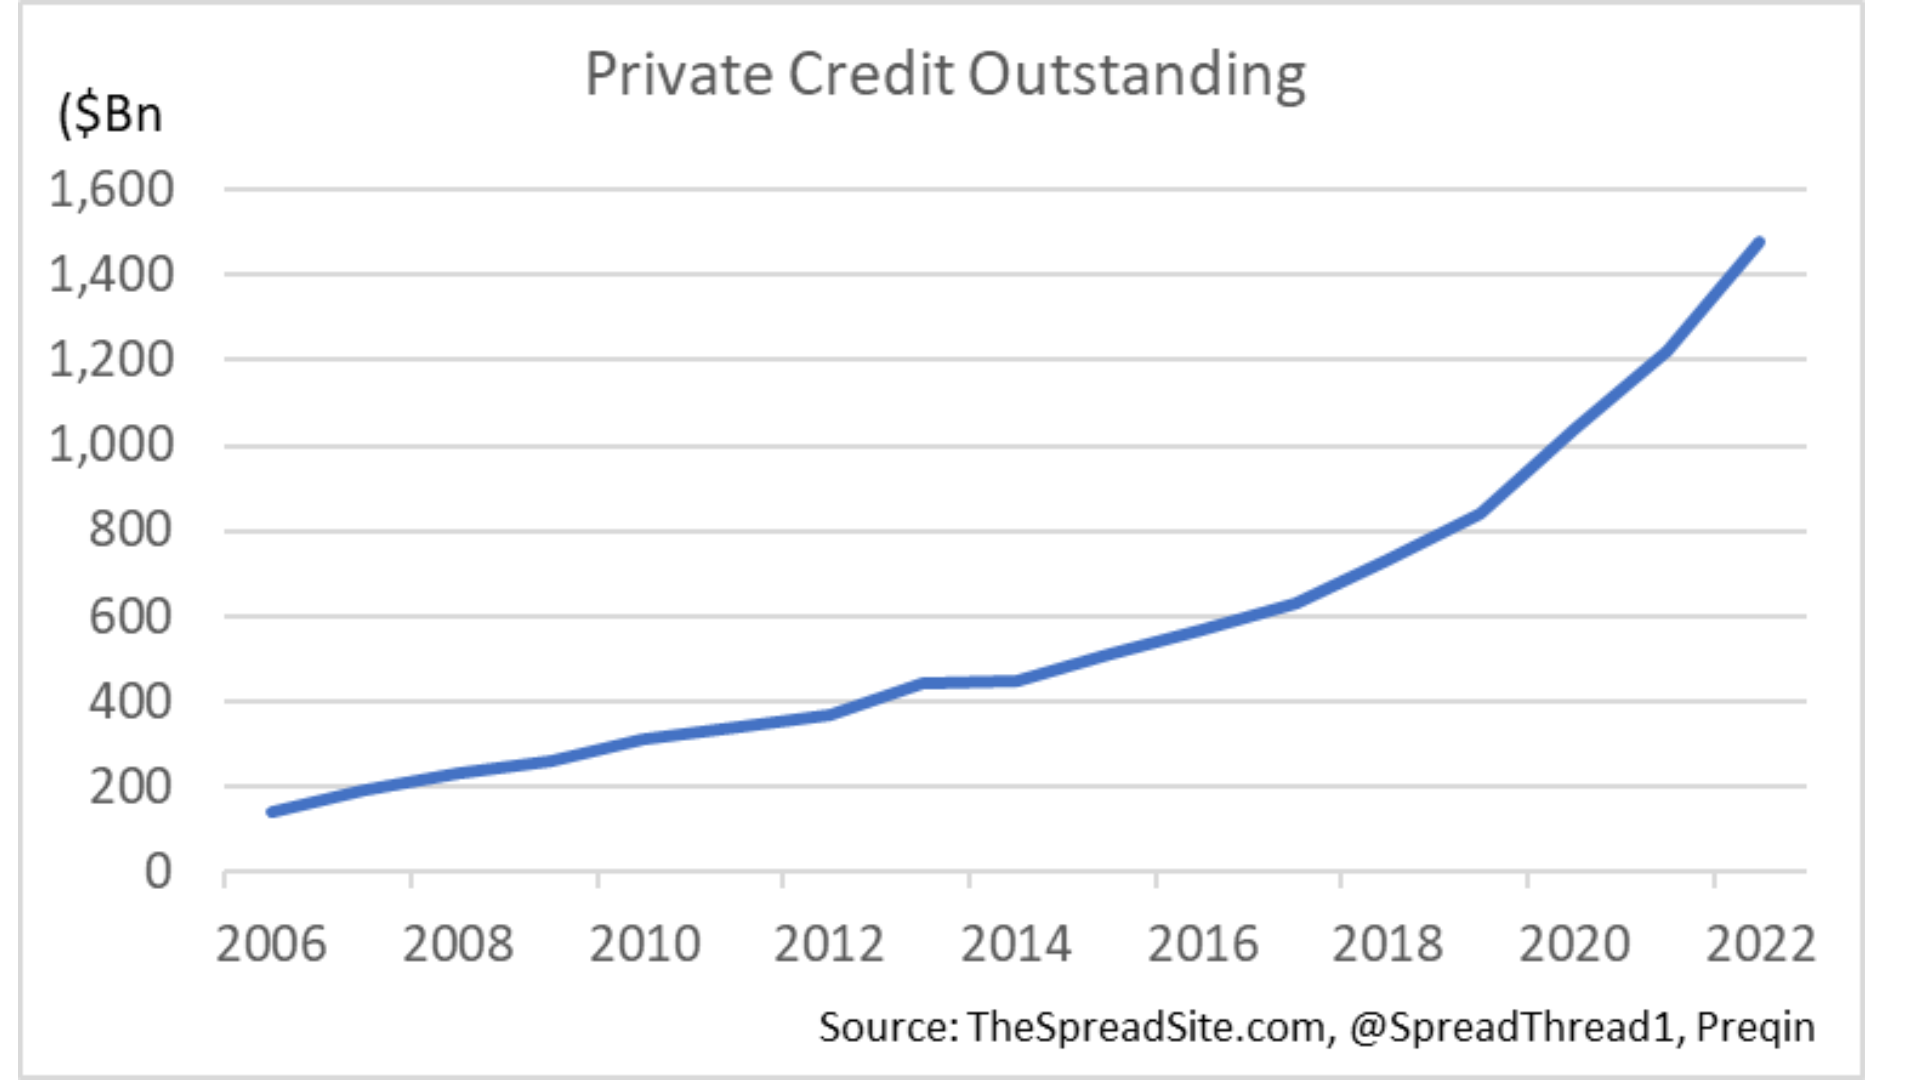
Private credit covers various strategies, but simplifying, refers to a loan made directly to a company from a non-bank lender. Credit spreads in the direct lending market tend to be wider, borrower size is often smaller, and covenants are often tighter. But in exchange for a better yield and structure, the lender gives up liquidity, relative to the broadly syndicated loan market. The private credit market has seen explosive growth over the past decade, taking share from banks, and is now roughly as large as the high yield bond and broadly syndicated leveraged loan markets.
Credit Default Swaps
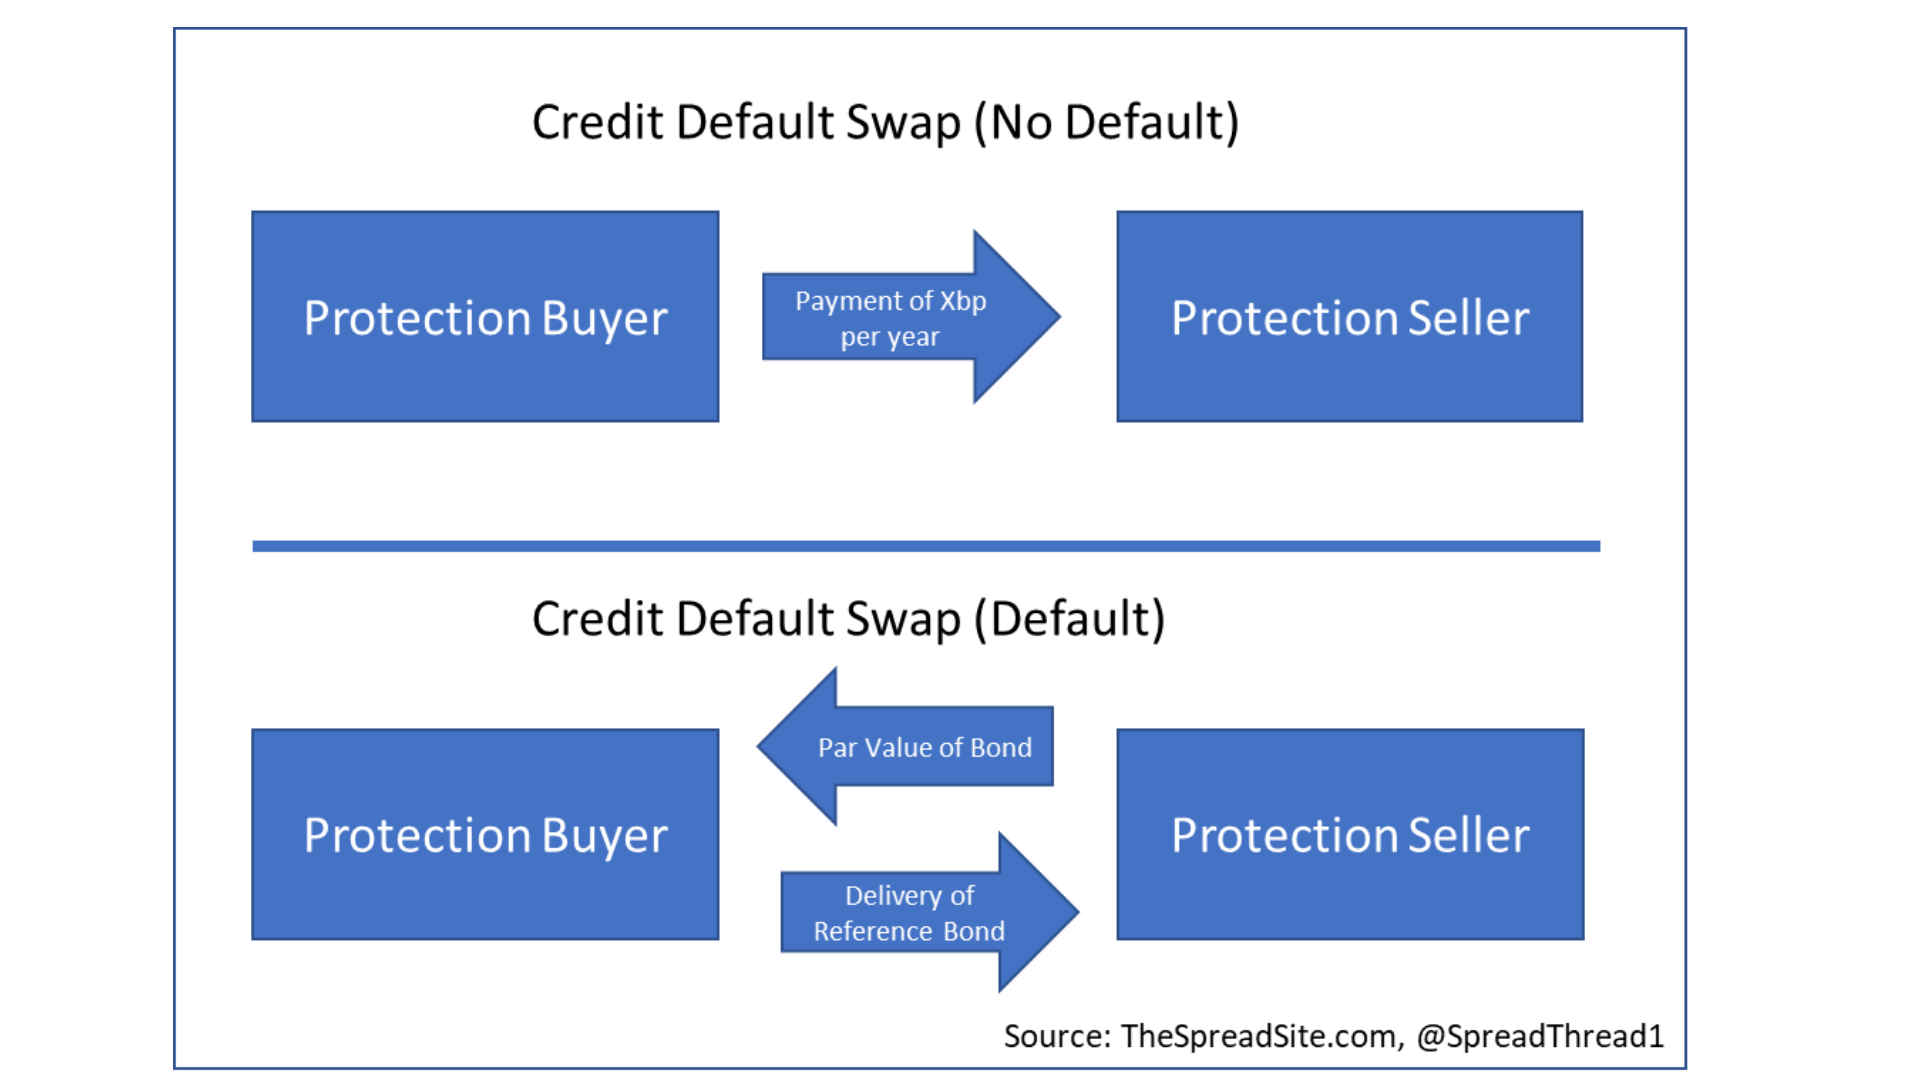
The sections above discuss the underlying corporate bond and loan markets. Credit default swaps (CDS) are derivatives on those various credit markets. In short, a CDS contract is similar to insurance on a debt instrument or portfolio of debt instruments. The buyer of protection pays a premium to the seller of protection over the life of the contract, assuming the underlying reference entity does not default. That premium will be higher for riskier companies, and lower for safer companies.
If the entity has a “credit event” (typically a bankruptcy or failure to pay) before the maturity date, the protection seller compensates the buyer for the loss, which equals the difference between the notional and the recovery value of the defaulted bond. This can include the protection buyer delivering the protection seller a defaulted bond and receiving the par value of the bond, or the protection seller delivering the difference between the par value of the underlying bond and the post default recovery rate. The Exhibit below provides a high-level example of these cashflows.
The benefits of the CDS market are 1) it allows investors to transfer or hedge credit exposure, 2) it represents a pureplay on credit with minimal interest rate exposure, 3) it can be more liquid than underlying cash bonds, and 4) it allows investors to control for maturity.
CDS can take on various forms:
- Single name CDS references individual corporates or sovereigns.
- CDS can also reference a custom portfolio of credits.
- CDS Indices are standardized portfolios that provide investors liquid ways to trade credit risk.
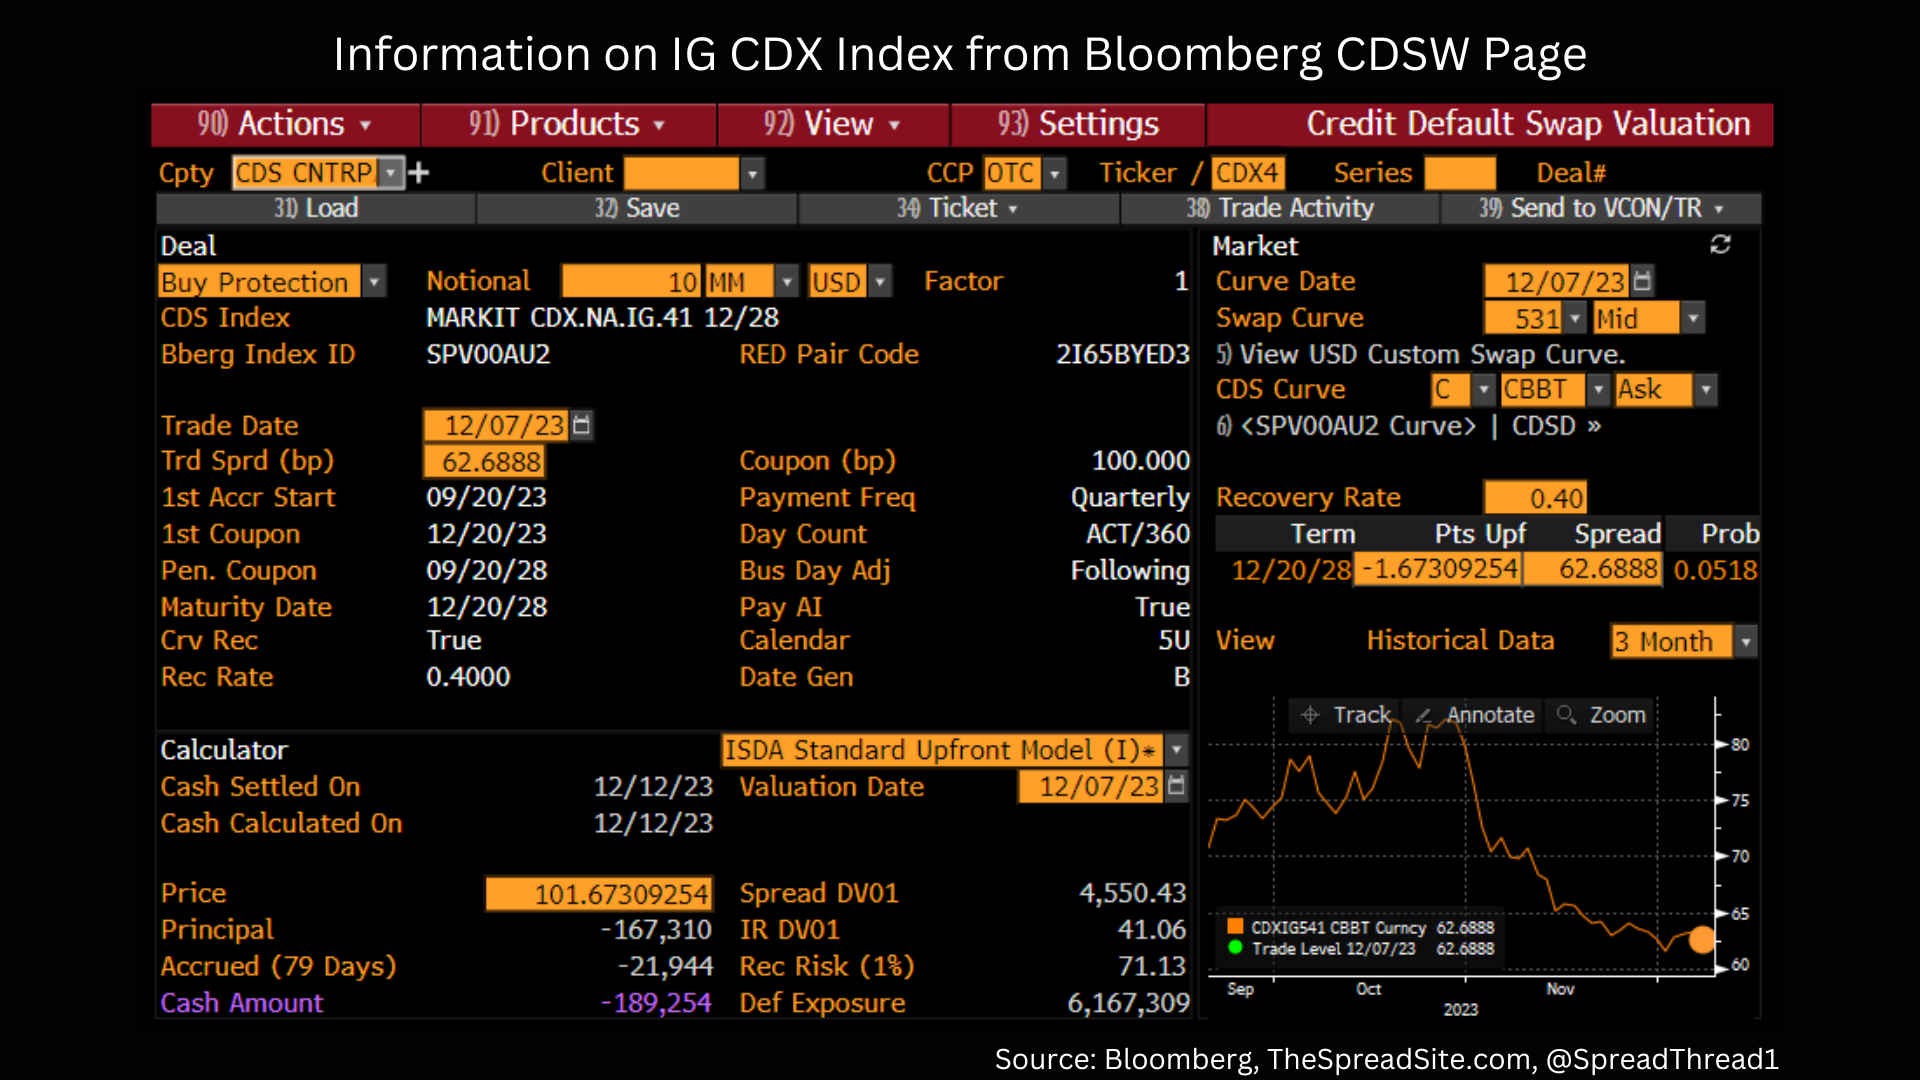
The Investment Grade CDX Index is comprised of 125 of the most liquid investment grade CDS. The High Yield CDX Index is comprised of 100 of the most liquid high yield CDS. The indices roll (new names added, old names drop out) on a semi-annual basis. Similar CDS indices exist across other regions (i.e., Europe, Asia, Emerging Markets) and markets (i.e., municipal, sovereign debt).
The CDSW page on Bloomberg provides useful information on CDS contracts. For example, based on a spread of 62bp for the IG index, the 5-year implied default rate is 5.18%. This means if 5.18% of the index defaults cumulatively over the next 5 years (with a 40% recovery rate) an investor will roughly break even based on the 62bp annual spread. This implied default rate can be approximated by: (Spread/ (1 – Recovery Rate)) x Duration.
Finally, the credit basis measures the difference between a CDS spread and the spread on the underlying cash bond (controlling for differences such as maturity). The credit basis can be a measure of the liquidity premium in the cash bond market. Dislocations in markets can create opportunities for sophisticated investors to put on basis trades.
Credit Analysis – Fundamentals, Capital Structure, Covenants
Analyzing corporate bonds and loans requires an understanding of the fundamentals of a company as well as the structure of the underlying debt instrument. Most simply, the analyst is trying to figure out the likelihood of default for the business in question as well as the recovery rate in the event of default. This analysis helps determine the appropriate compensation (i.e., credit spread) for owning the bond or loan. Fundamental credit analysis is a topic that we will dig into in more detail in future primers. In this high-level credit overview, we provide a few basics to get started.
First, we start with a few credit metrics that are useful in evaluating the risk of a company. Each measure can be calculated in many different ways.
- Leverage: Total debt/ EBITDA (earnings before interest, taxes, depreciation and amortization) - measures a company’s total debt in relation to its earnings. Analysts will also look at Net Leverage, which subtracts cash from total debt in the numerator of the ratio above.
- Interest Coverage: EBITDA/ Interest Expense – measures a company’s ability to pay interest on its outstanding debt.
- Cash/Debt: Measures how easily a company could pay off its outstanding debt with cash on hand.
- EV/EBITDA: Measures a company’s enterprise value (EV) relative to its EBITDA, and is a commonly used valuation measure. When compared to leverage (Total Debt/EBITDA), EV/EBITDA indicates how much equity cushion is available beneath the debt.
- Capex/EBITDA: Indicates the capital intensity of a business.
- EBITDA Margin: EBITDA/Total Revenue – helps compare the profitability across similar businesses.
- Total Liquidity - A measure to gauge the risk in rolling over (i.e., re-financing) bonds and loans that are maturing in the next few years and includes cash on the balance sheet as well as access to revolving credit facilities.
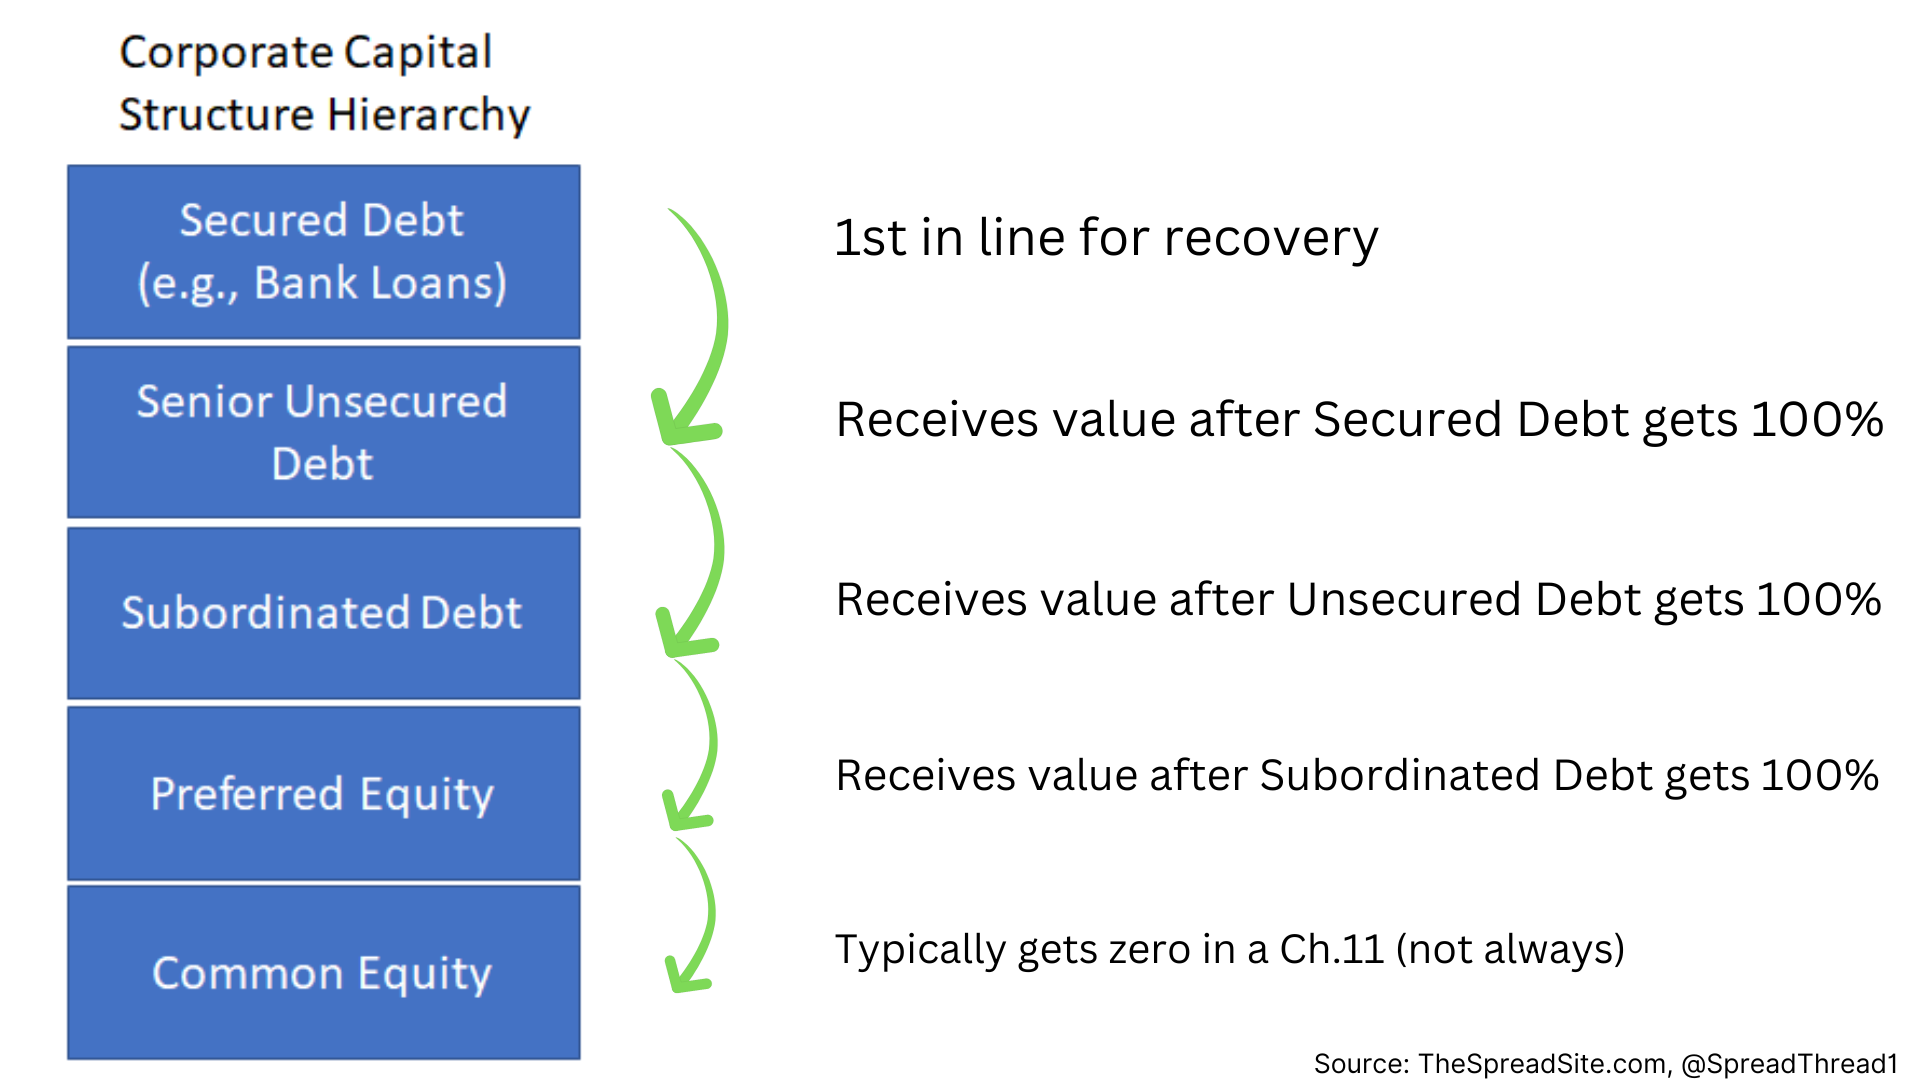
Next, we walk through the capital structure “waterfall” to better understand recovery rates (the amount received in bankruptcy by a debt instrument). The recovery rate comes from new debt, cash, equity or a combination. If you are an old creditor, recovery rate = new assets/debt claim. The term “waterfall” comes from the “Absolute Priority” rule in the US Bankruptcy Code where junior classes of creditors cannot receive value unless all senior classes are either paid in full or vote to accept a restructuring plan. So value flows down, like a waterfall, with secured debt (i.e., bank loans) on the top, followed by unsecured debt, then subordinated debt, and lastly the various classes of equity.
If there is insufficient value in the restructured company, subordinated tranches suffer any shortfall. While simple in theory, absolute priority is complex and arguments are made about what new debt & equity is worth, seniority of claims etc. Settlements are common between classes. The exhibit below shows a general capital structure hierarchy.
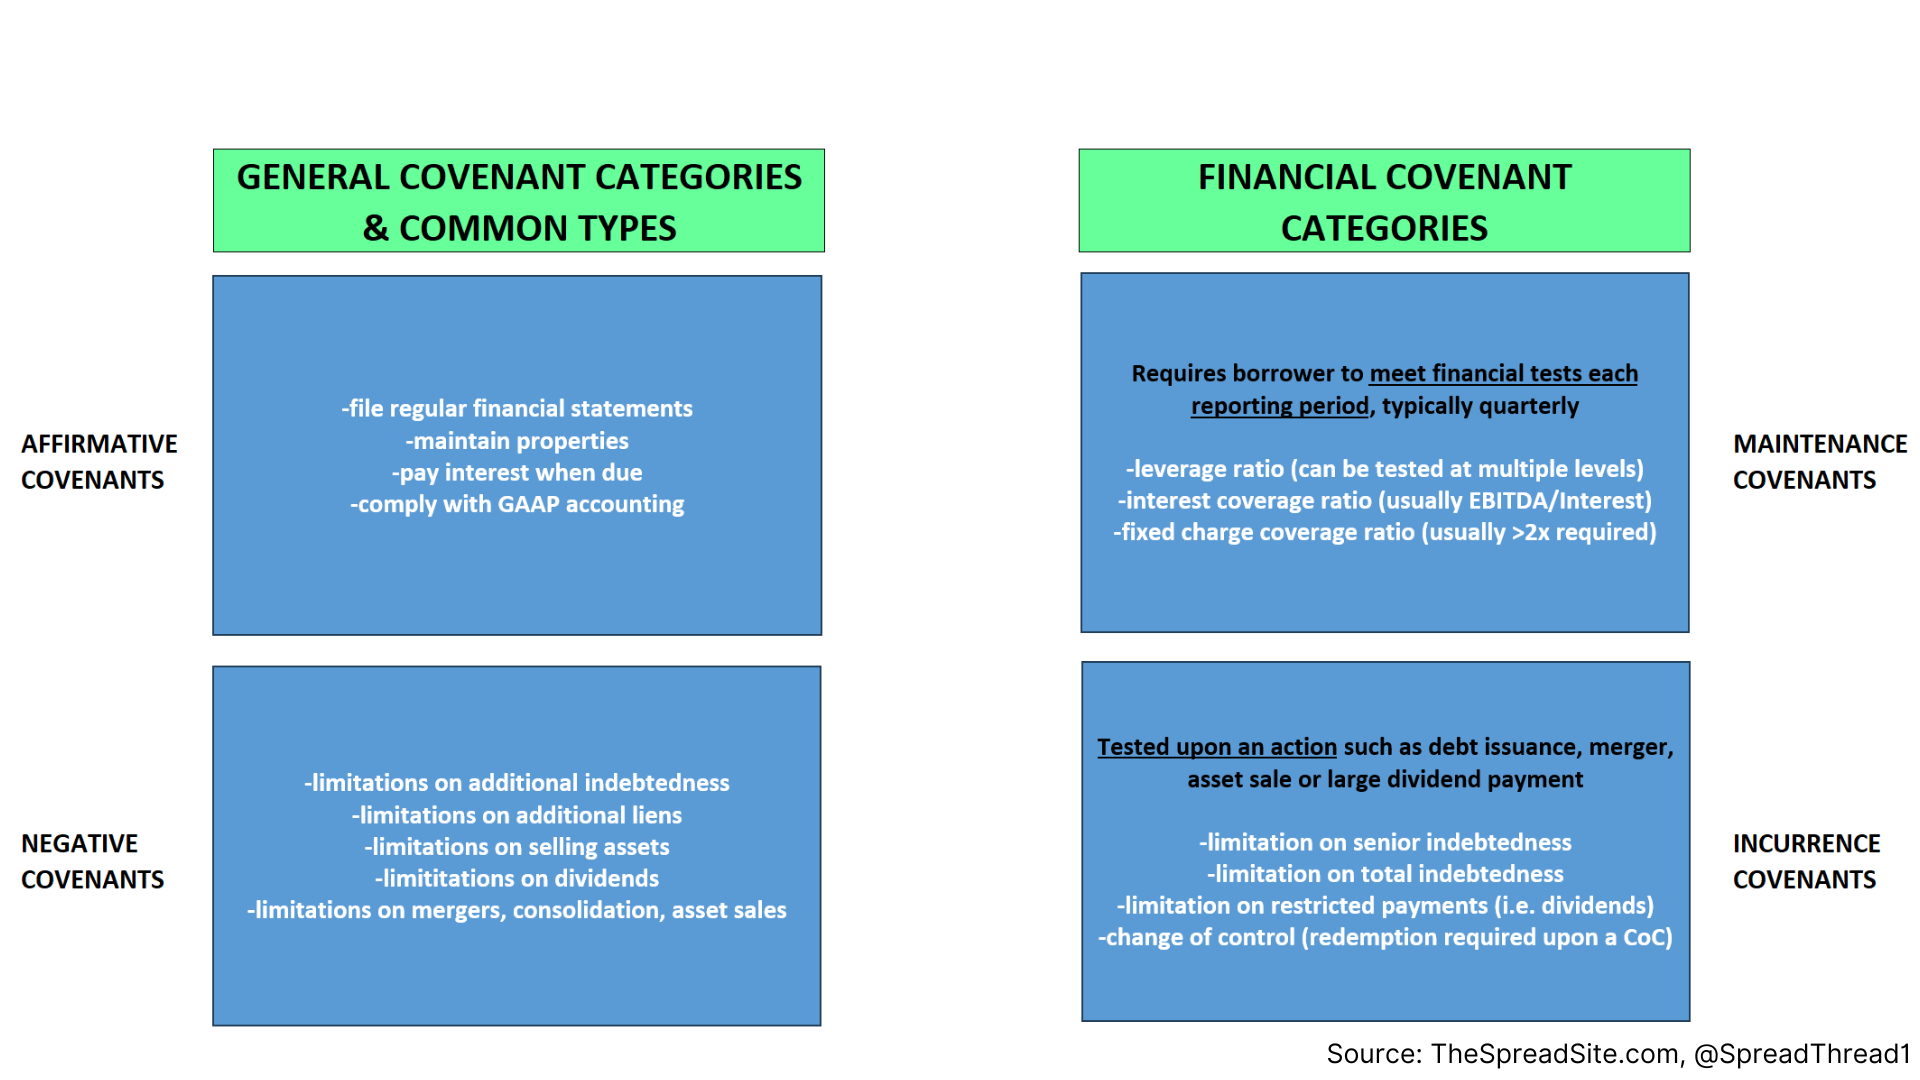
Finally, we walk through covenants, which are legal agreements between creditors and lenders that dictate what a company can/can’t do with leverage, allocation of cash flow and corporate actions (mergers or asset sales). Covenants are found in lengthy documents governing each piece of debt. For a bond, this is an “Indenture” and for loans a “Credit Agreement.” As a lender, you want restrictions on a company’s ability to worsen your seniority or dilute your claim on assets & cash flow. Covenants can be split into “Affirmative” (what a company must do) and “Negative” (what a company can’t do). Additionally, financial covenants are broken down into “Maintenance” (must stay within) and “Incurrence” (can’t go beyond post corporate action).
Covenants are negotiated prior to debt issuance, but after the fact, everything is open to legal arguments & lawsuits. This is why you see debt investors fight with each other and the company over what they can/cannot do within the capital structure post debt issuance. Conditions in the credit market also dictate generally tighter or looser covenants. In a frothy market, companies can get away with more flexibility in their credit documents. Further, the stronger a company’s credit rating, the looser covenants tend to be (on average).
A “Cov-lite” loan generally refers to the absence of maintenance covenants. They became a regular feature of most broadly syndicated loans post-crisis, consistent with generally weaker credit protection as investors reached for yield.
Credit Technicals – Supply and Demand
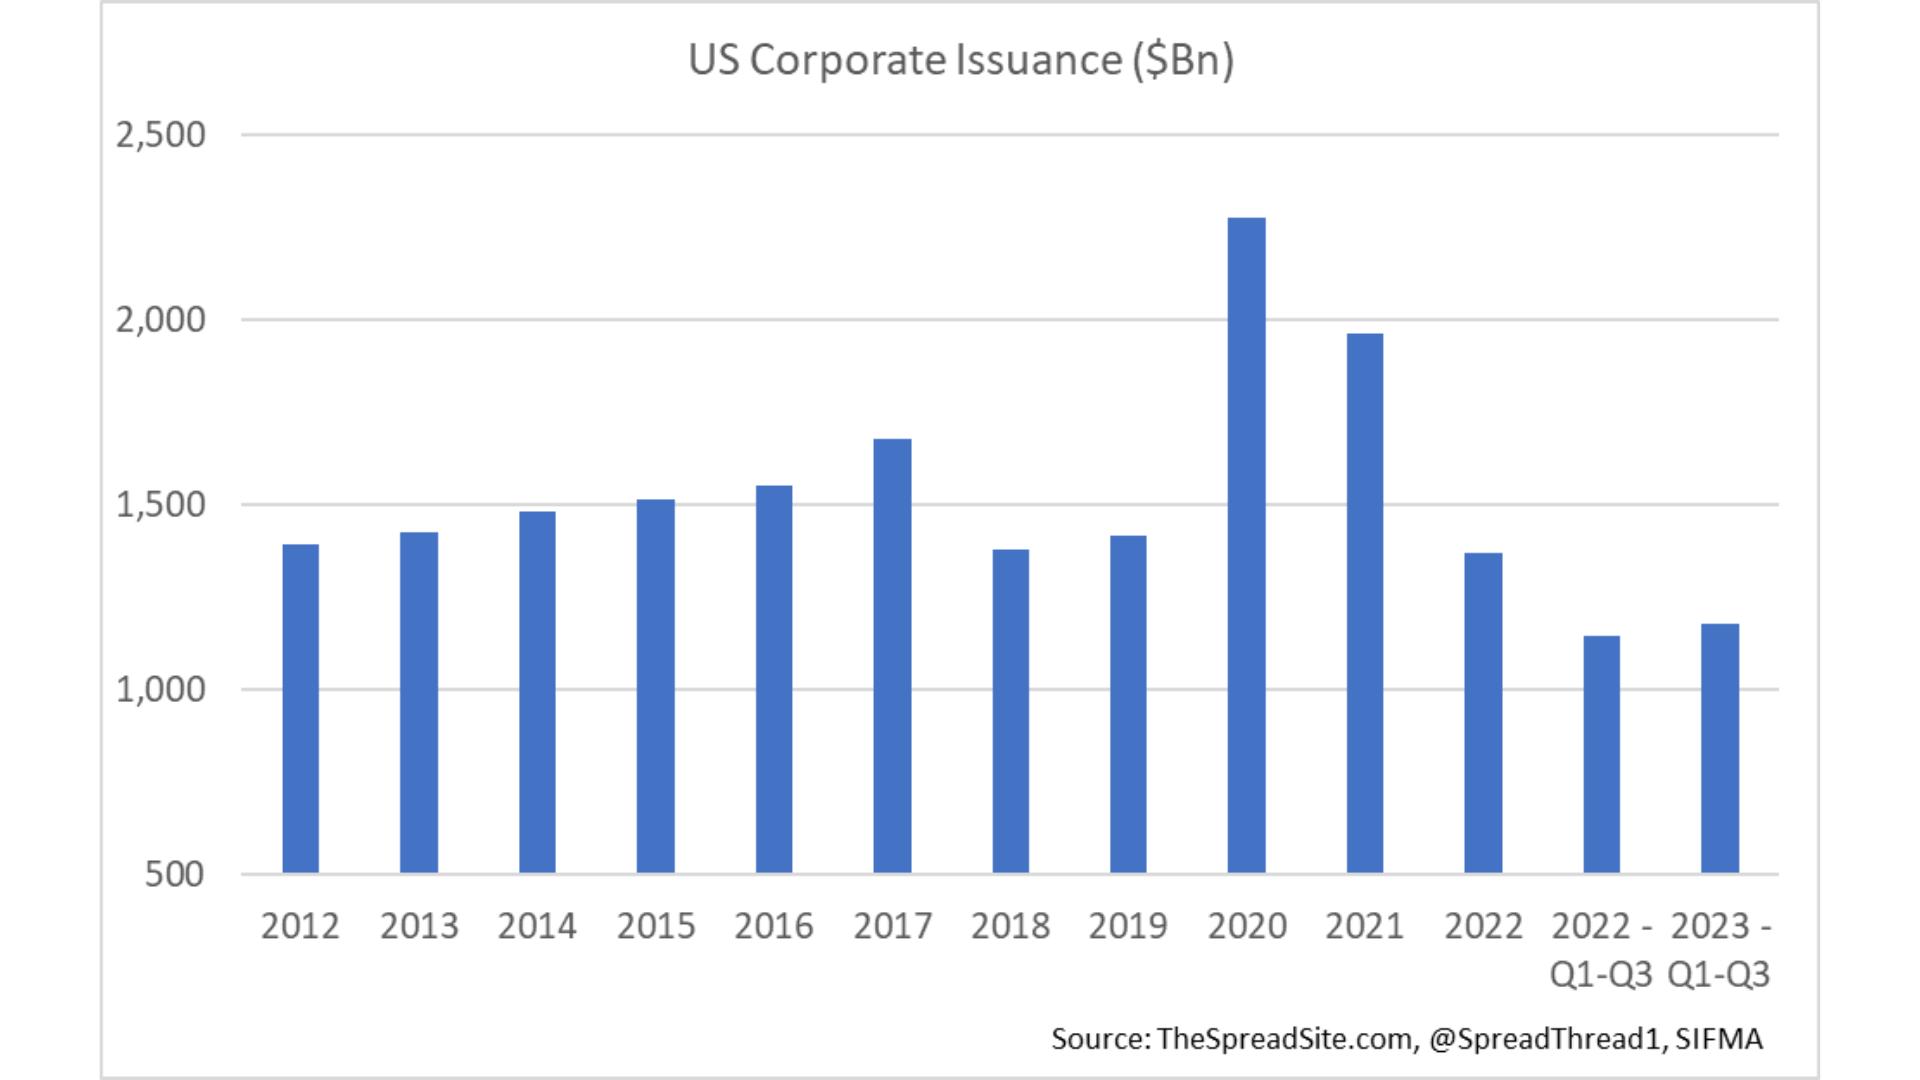
Companies issue bonds for various reasons, and those bonds must get absorbed by credit investors. Greater credit supply should pressure spreads wider, all-else-equal. However, in reality, companies tend to issue more bonds in friendlier credit environments. When markets are volatile and there is less demand for risky credit, companies tend to issue less. As a result, somewhat counterintuitively, spreads are often tight in years when supply is elevated, like 2021, and spreads are often wide in years when supply is low, like in 2022. The chart below shows annual gross corporate credit issuance historically.
The following are common use-of proceeds, or why companies issue debt:
- Refinancing is when a company is issuing new bonds or loans to paydown old debt.
- M&A is when a company issues debt to acquire or merge with another business. A leveraged buyout (LBO) is a type of M&A where a company is purchased often by a private equity (PE) firm, typically increasing the leverage of the underlying business.
- Recapitalizations are bonds issued to buyback stock or pay dividends.
- General corporate purposes (GCP) is often a catch-all phrase – debt issued to finance a company’s operations.
Various sources of demand are available to absorb the supply.
- Maturing or called bonds/loans are when companies paydown debt as it comes due or because it is optimal to do so. Gross issuance less matured/called debt is equal to net issuance.
- Coupons are paid to investors which can be used to purchase new bonds. The investment grade market pays ~$320bn in coupons a year, and the high yield market pays ~100bn in coupons.
- Upgrades from HY to IG (“Rising Stars”) are a source of demand for the high yield market (and supply for IG) as the credit transitions from high yield to investment grade indices. Downgrades from IG to HY (“Fallen Angels”) are the reverse.
- Credit inflows are the most followed source of demand for credit markets. Periods of strong inflows naturally correlate with periods of spread tightening.
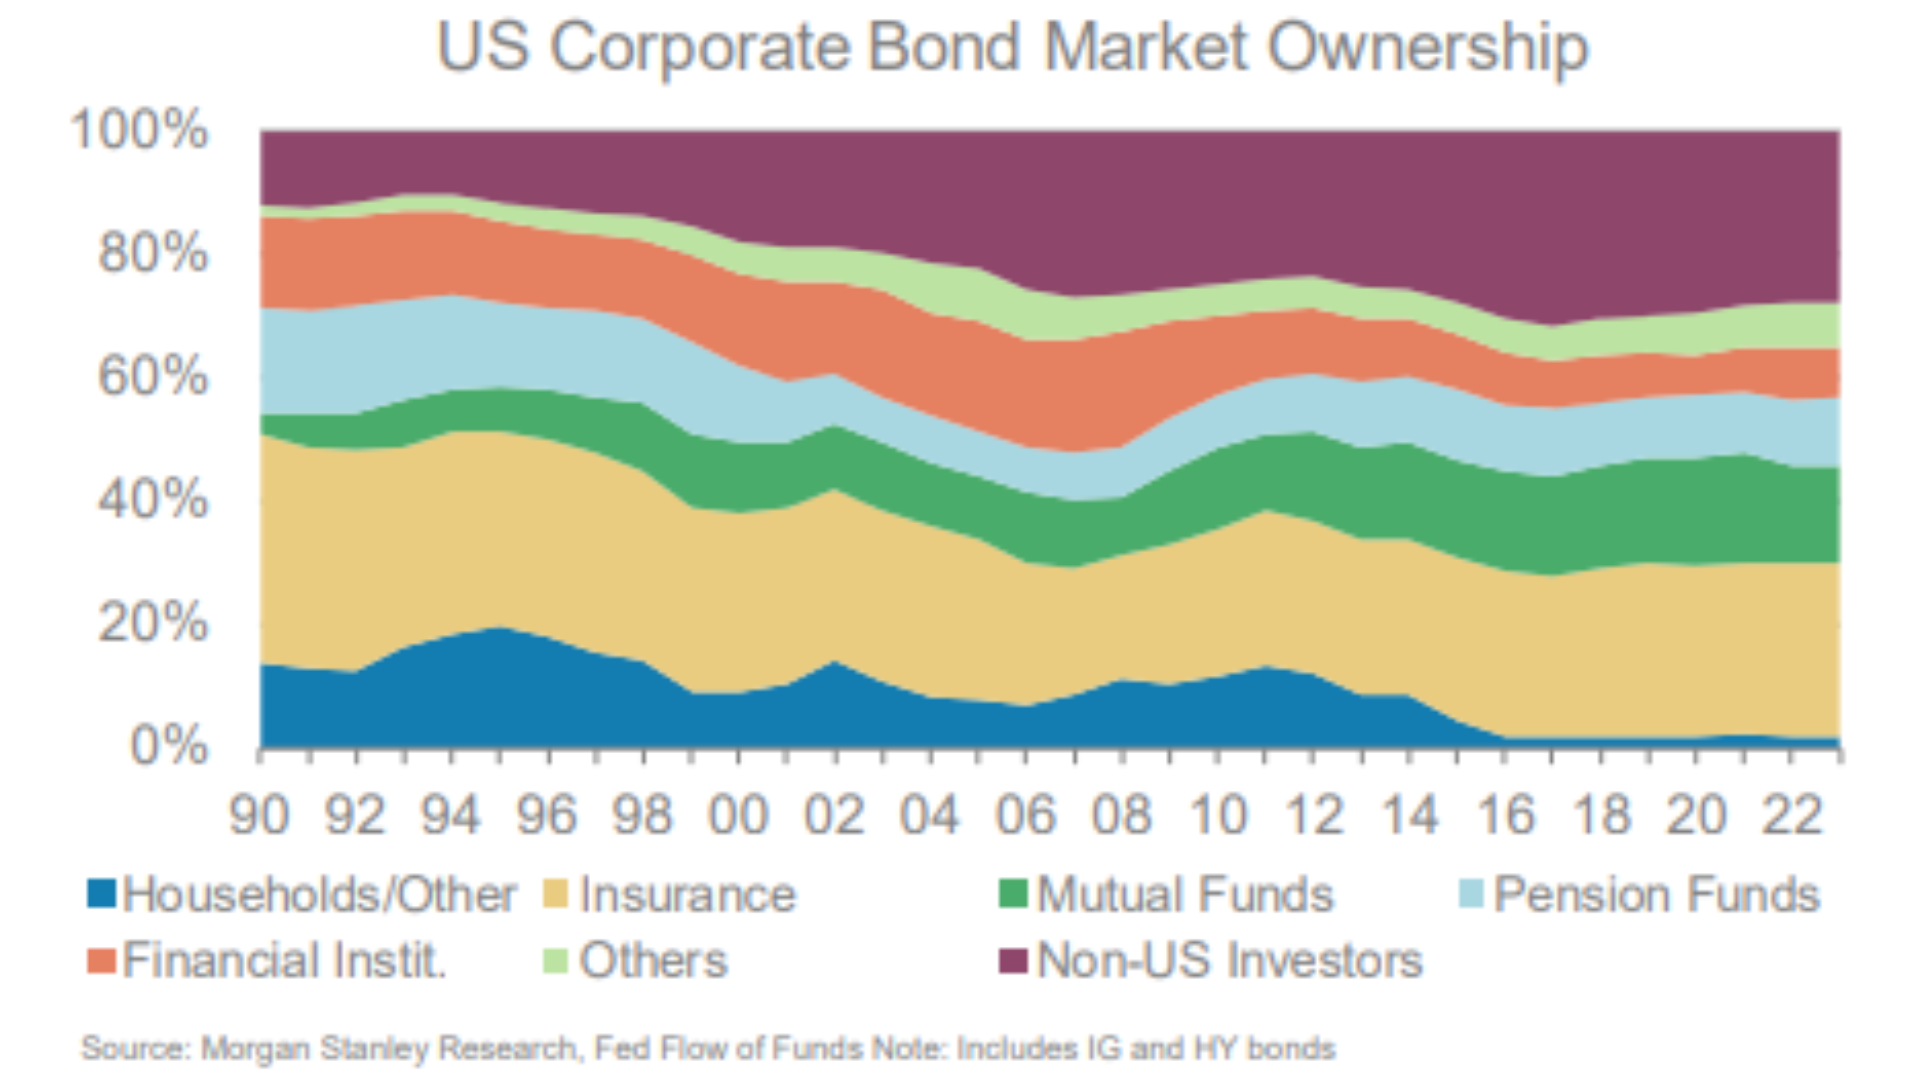
The Exhibit below shows the investor base for corporate credit markets. Insurance companies and non-US investors (which include large foreign institutions such as insurance companies and other money managers) are the largest owners of US corporate bonds. Mutual funds are the next largest investor type, followed by pension funds.
It is important to understand the motivations of various investor types and how they differ. For example, liability-driven investors (LDI) like pension funds buy long duration assets such as corporate bonds to match the payouts on their long-duration liabilities (i.e., payments to pensioners). These buyers care more about the yield on the underlying bonds (within a specific risk cohort) vs mutual fund investors who may care more about the volatility of that bond.
Finally, the buyer base of the investment grade, high yield, and leveraged loan markets differ to some extent, as discussed in the asset class sections above.
Credit ETFs
Lastly, there are several ways that investors can buy corporate credit such as:
- Buying individual bonds directly
- Credit/Income Mutual Funds
- Credit ETFs
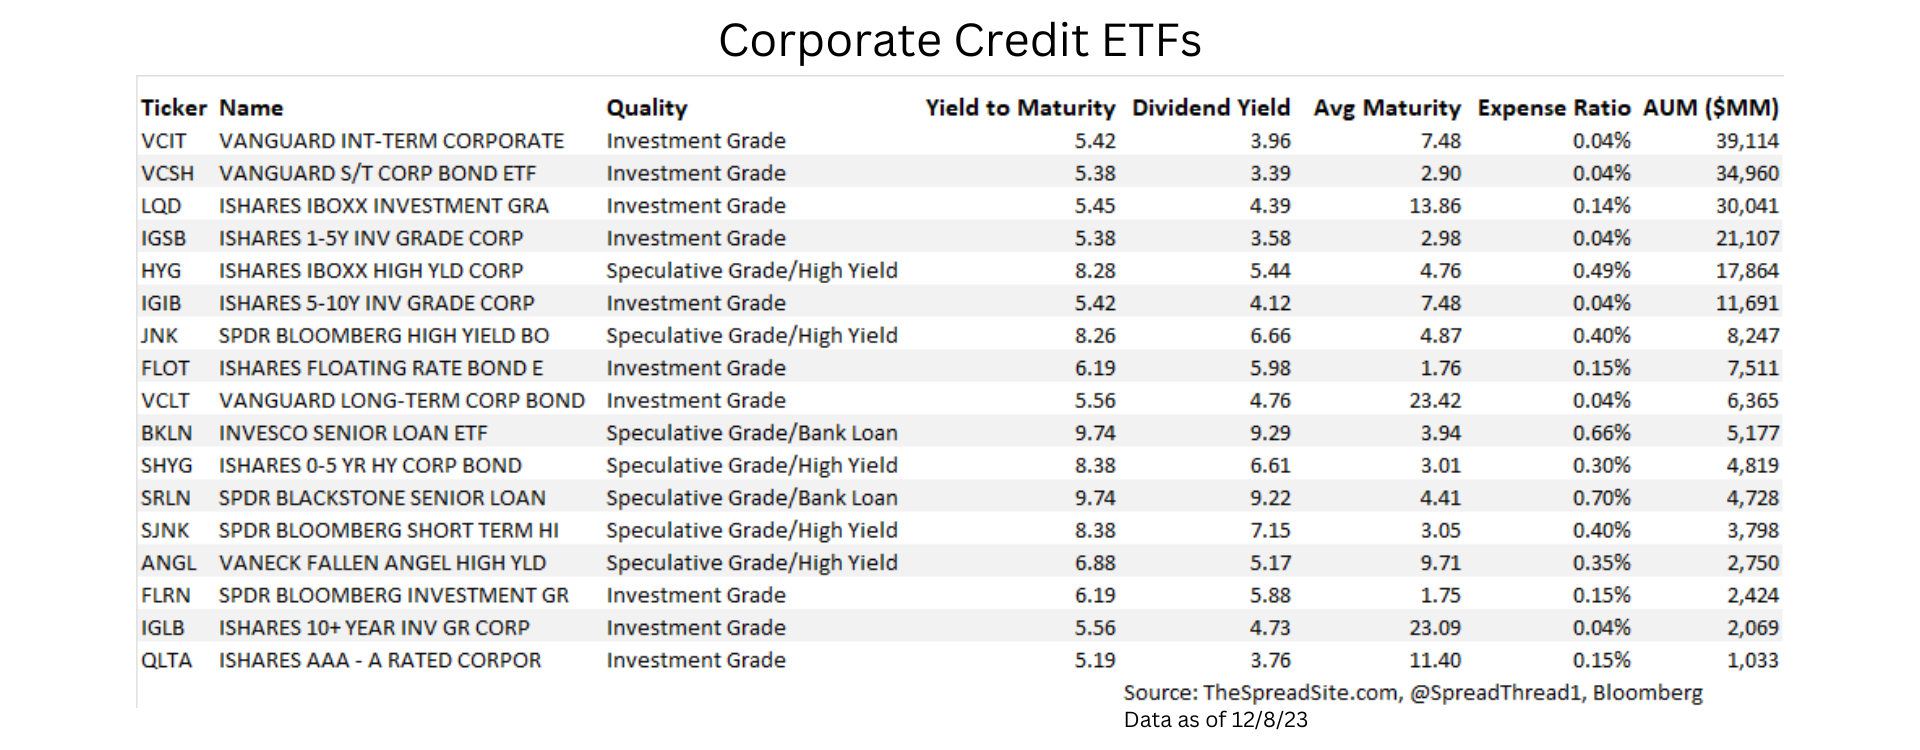
For those looking for intra-day liquidity and to trade a particular segment of credit markets (as opposed to individual companies) ETFs are a good option. We end with the table below that shows many of the largest credit ETFs across the investment grade, high yield and leveraged loan markets.
Disclosures
Please click here to see our standard Legal Disclosures
The Spread Site Research
Receive our latest publications directly to your inbox. Its Free!.
