
Everyone's Starting a Multifamily
SUMMARY
-
The current risk/reward for multifamily ("mFam") REITs is unattractive given our view that rent growth and vacancies will worsen, cap rates are too tight, headline risk for CRE in general is elevated, and higher fixed income yields mean better alternatives for yield-focused investors.
-
Macro headwinds include a significant amount of new supply under construction, operating cost inflation and much higher interest rates that are flowing through the sector. These headwinds will be more material for lower quality buildings and “retail” owners.
-
While we see downside for mFam REIT equities, credit risk within the sector will be limited given predominantly healthy IG balance sheets and significant access to credit (VRE excluded).
-
As a trade idea, we like going short AIRC + VRE paired with a long in EQR + MAA as a way to play high vs low quality (in our view) names in the sector.
INTRODUCTION
A large amount of multifamily supply is on the way. Rents within mFam REITs are up ~12% since 2021, interest rates are up 500bps over the same period with the full lagged impacts of rates yet to filter through the economy, in our view. The largest mFam REITs will be able to manage even a severe downturn, although NOI is certainly at risk. The bigger risk, in our view, is the relative expected return offered by the sector and we think you can generate superior risk adjusted returns elsewhere. We like high quality vs low quality names, specifically shorting AIRC + VRE and buying EQR + MAA.
Part 1: The Macro Picture
The focus of this report is on mFam REITs and not a deep dive on multifamily economics. However, we begin with a high-level overview of multifamily real estate, to set the stage, starting with supply/demand dynamics.
First on supply, the chart below shows 1mm units of US apartment construction underway.
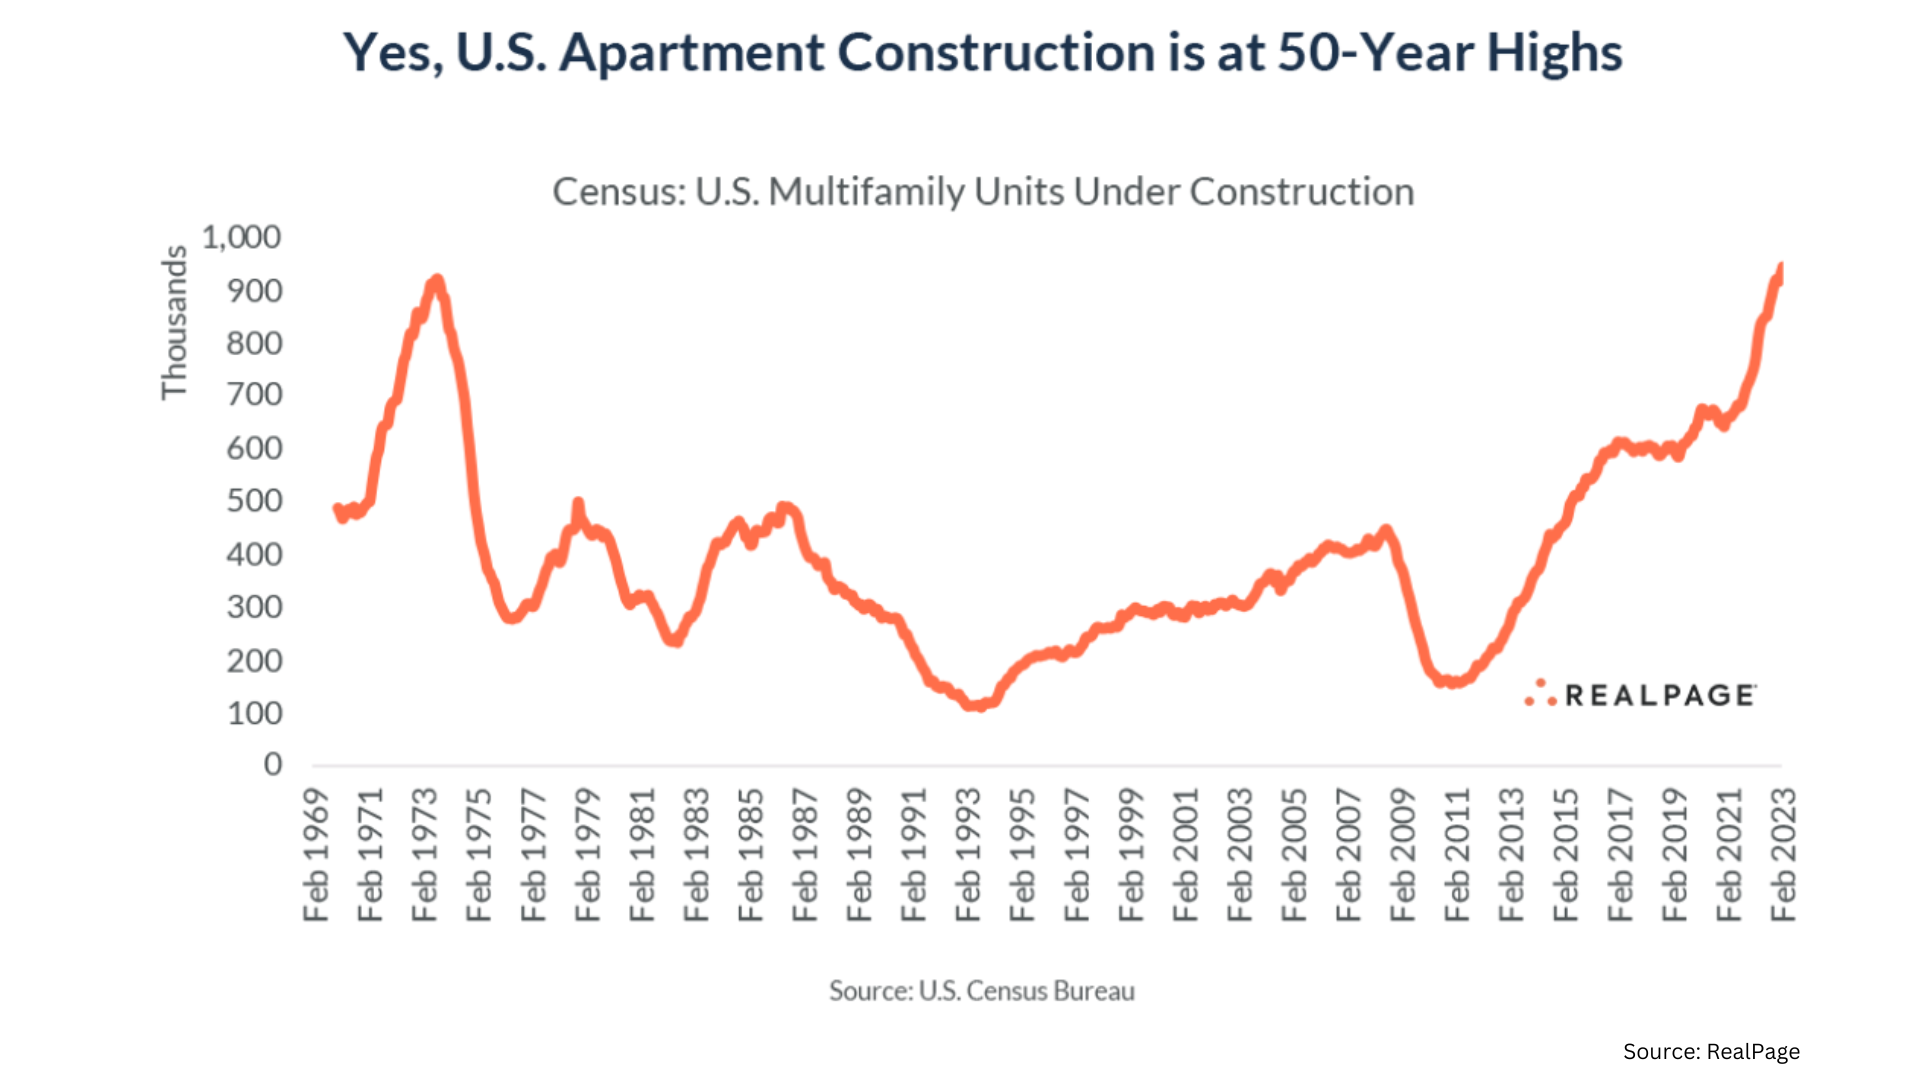
We can then compare this new construction to a total multifamily inventory (defined as buildings containing 5+ units) of 26.5mm total units, which we get from a Harvard JCHS report tabulating US Census data from 2021. So new construction as a percent of total inventory is ~3.8% (1 / 26.5 = 3.8%).
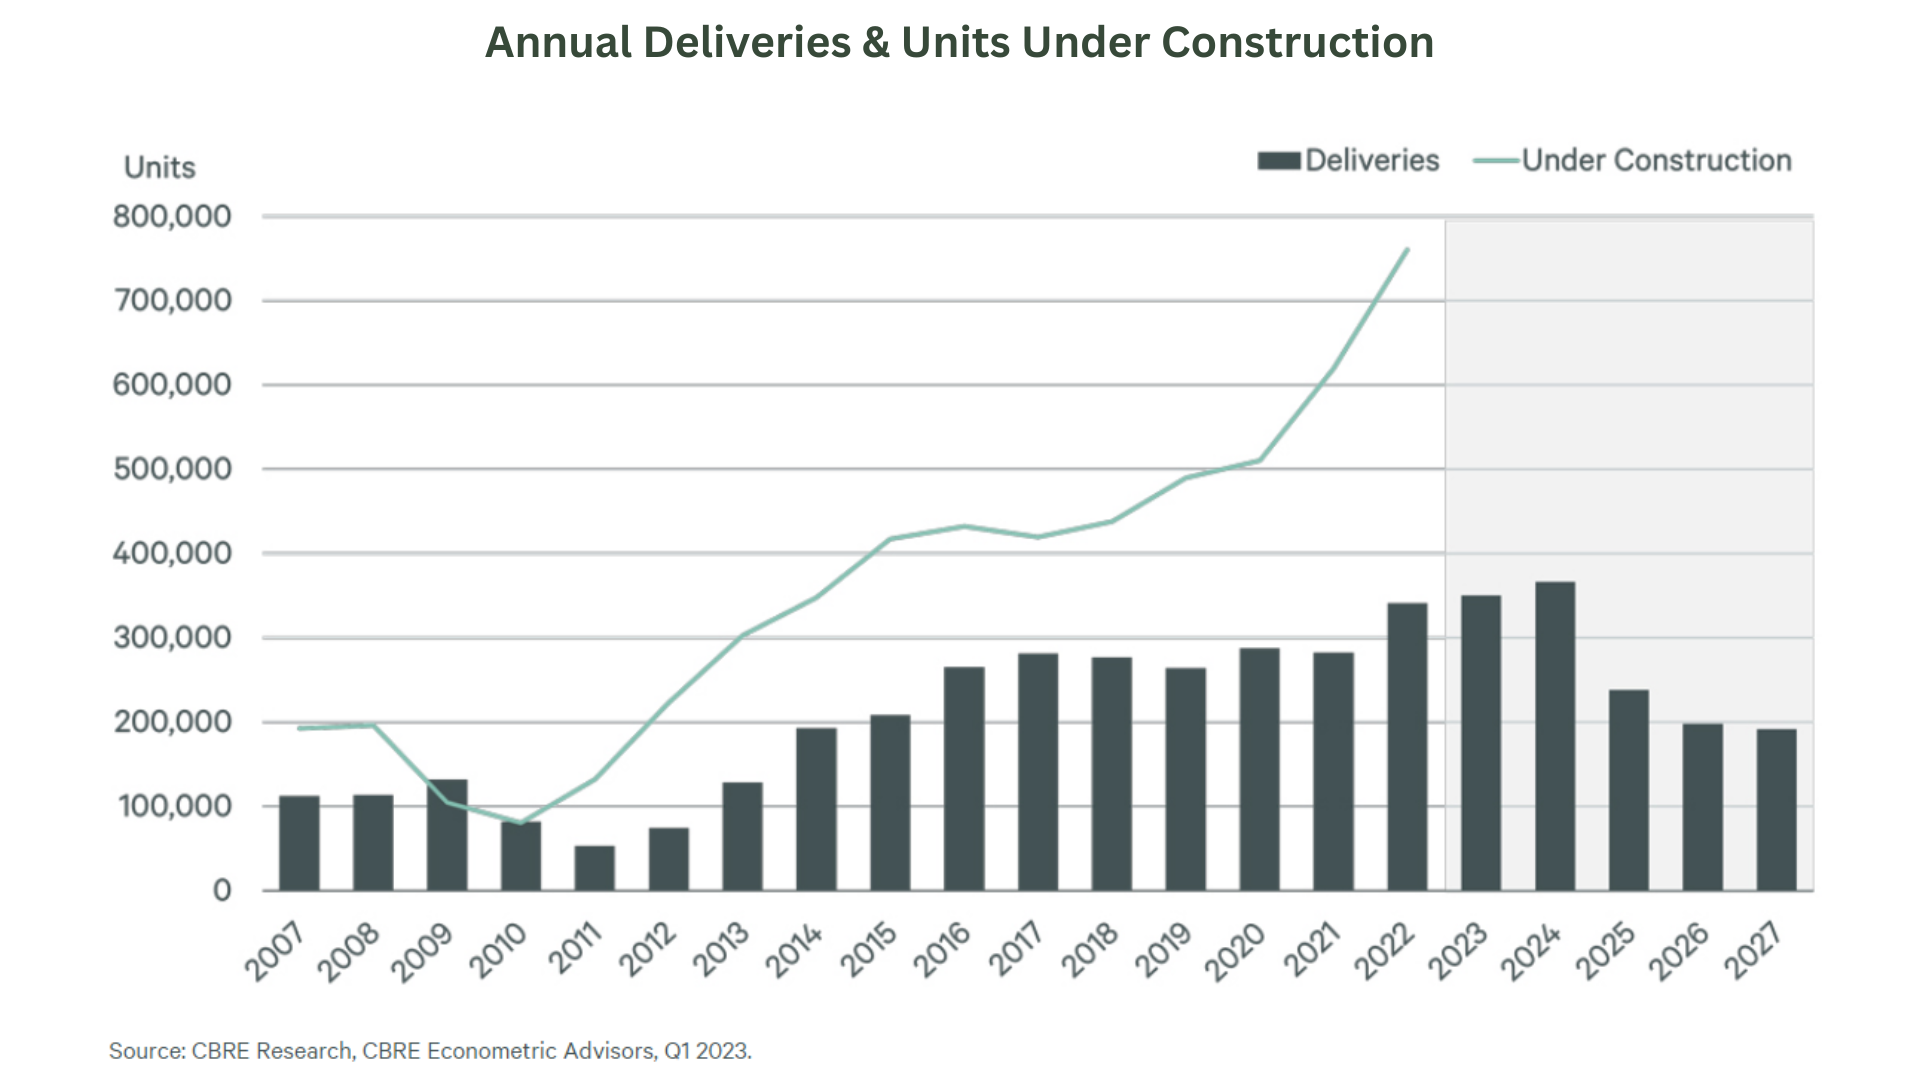
However, all this inventory won’t be delivered immediately or at the same time. Supply chain issues remain problematic and developers can slow progress depending on market conditions. Although in a high-rate environment we think supply chain will drive delivery schedules as developers won’t choose to delay construction given high capital costs. The chart below illustrates a delivery estimate from CBRE. They show roughly half of deliveries occurring in 2023 and the other half in 2024, although more recent construction estimates are 1mm vs their data showing ~800k.
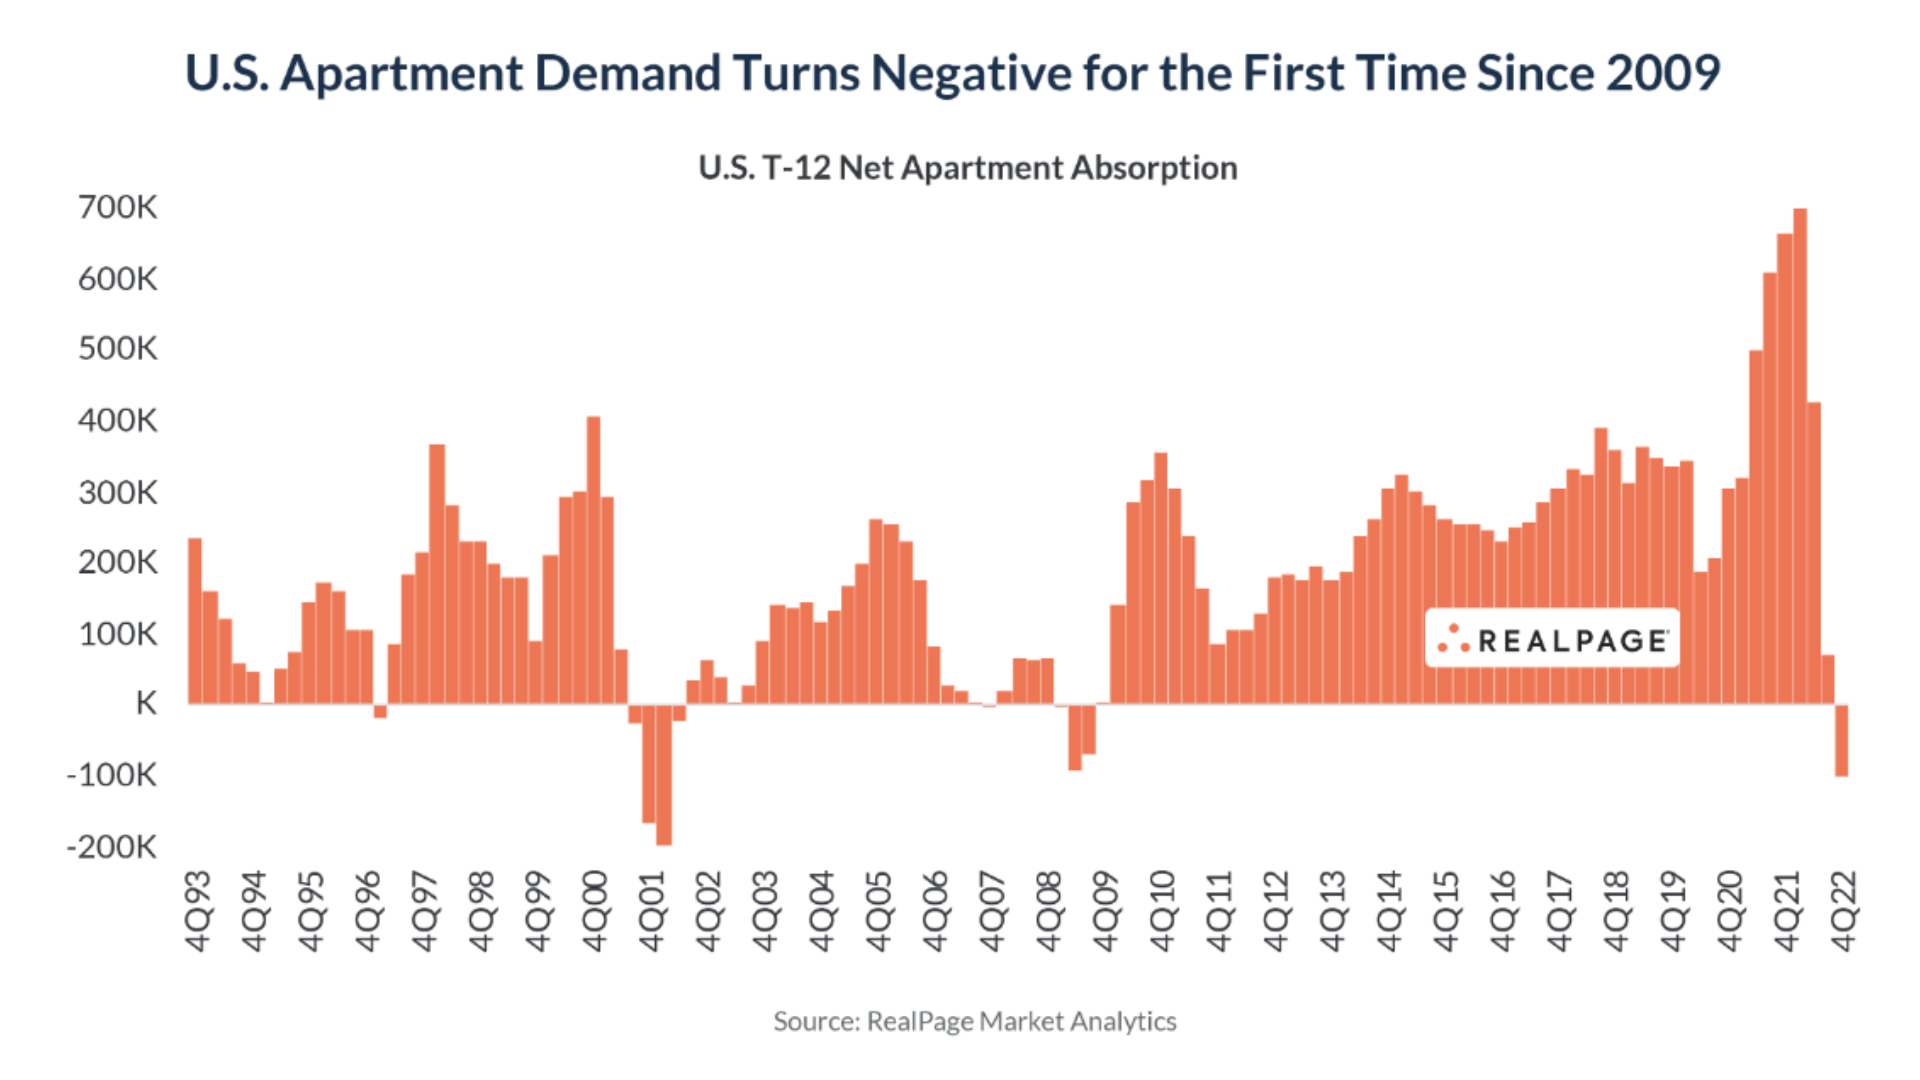
Next, we consider demand which was very strong in 2021, then slowed significantly and turned negative in 2022. 1Q23 showed a mild rebound to positive territory but remains below trend.
Net apartment demand as shown by RealPage below, will vary depending on household formation. And household formation varies depending on demographics and economic conditions. We will not attempt to forecast this metric but we think continued “payback” from the spike in 2021 is likely.
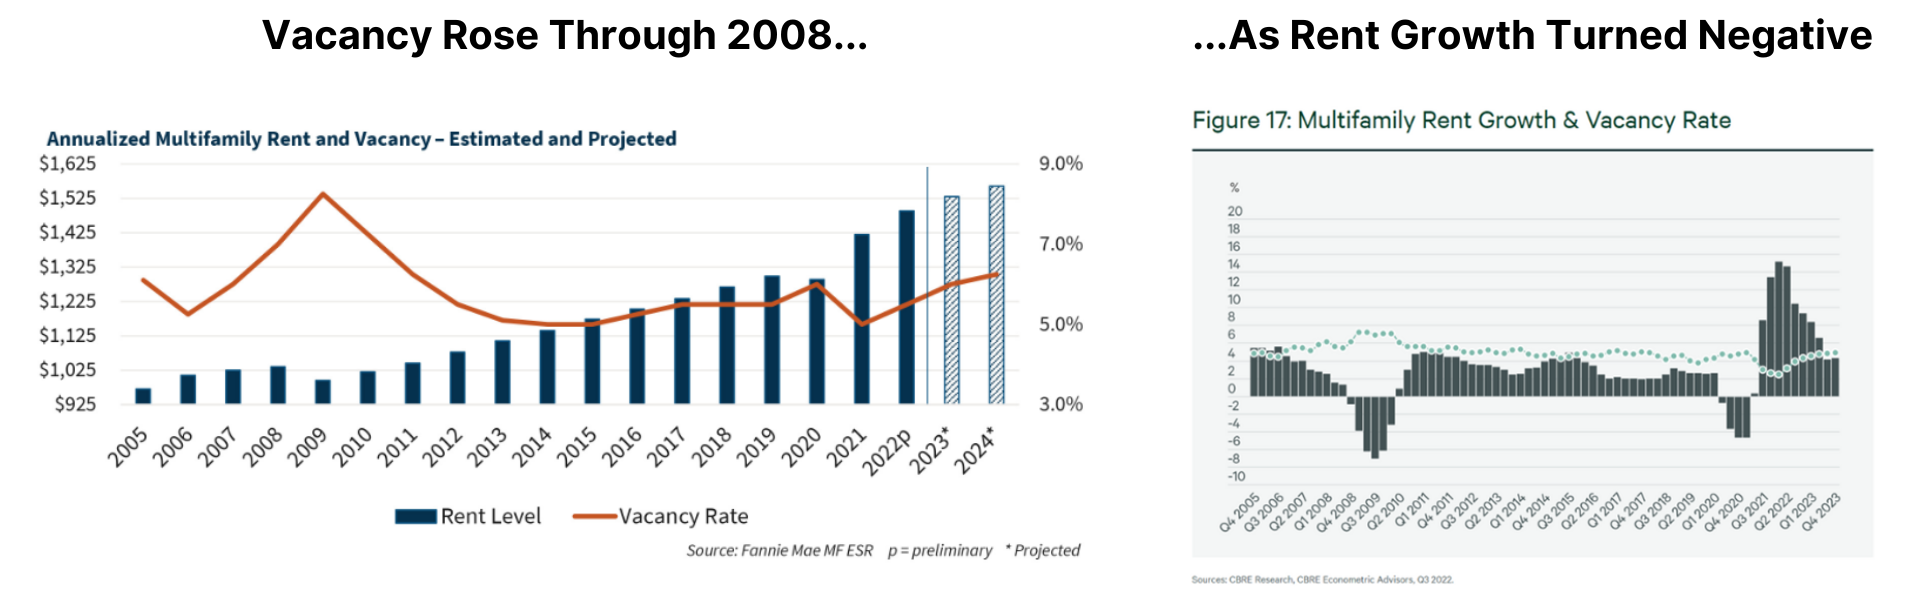
Finally, on vacancies, in a 'Severe Downside' scenario discussed in detail later in this report, we make the following assumptions. Vacancy rates were 5.5% as of 4Q22 (per Fannie Mae ) and we had ~1mm units of supply under construction. That new construction represents an increase to the overall inventory of 3.8%. If we then assume a below trend net absorption of 200k total for 2023 and 2024 (ave annual absorption is closer to 300k), we could see vacancies rise to 8.5% ((1mm new supply – 200k net absorption)/26.5mm)+5.5% = 8.5%.
Additionally, in this 'Severe Downside' scenario, using 2009 as a recent period when vacancies spiked and rents declined (“Investment Grade” buildings fared slightly better), we assume rents could decline 8%.
Part 2: The Credit Environment
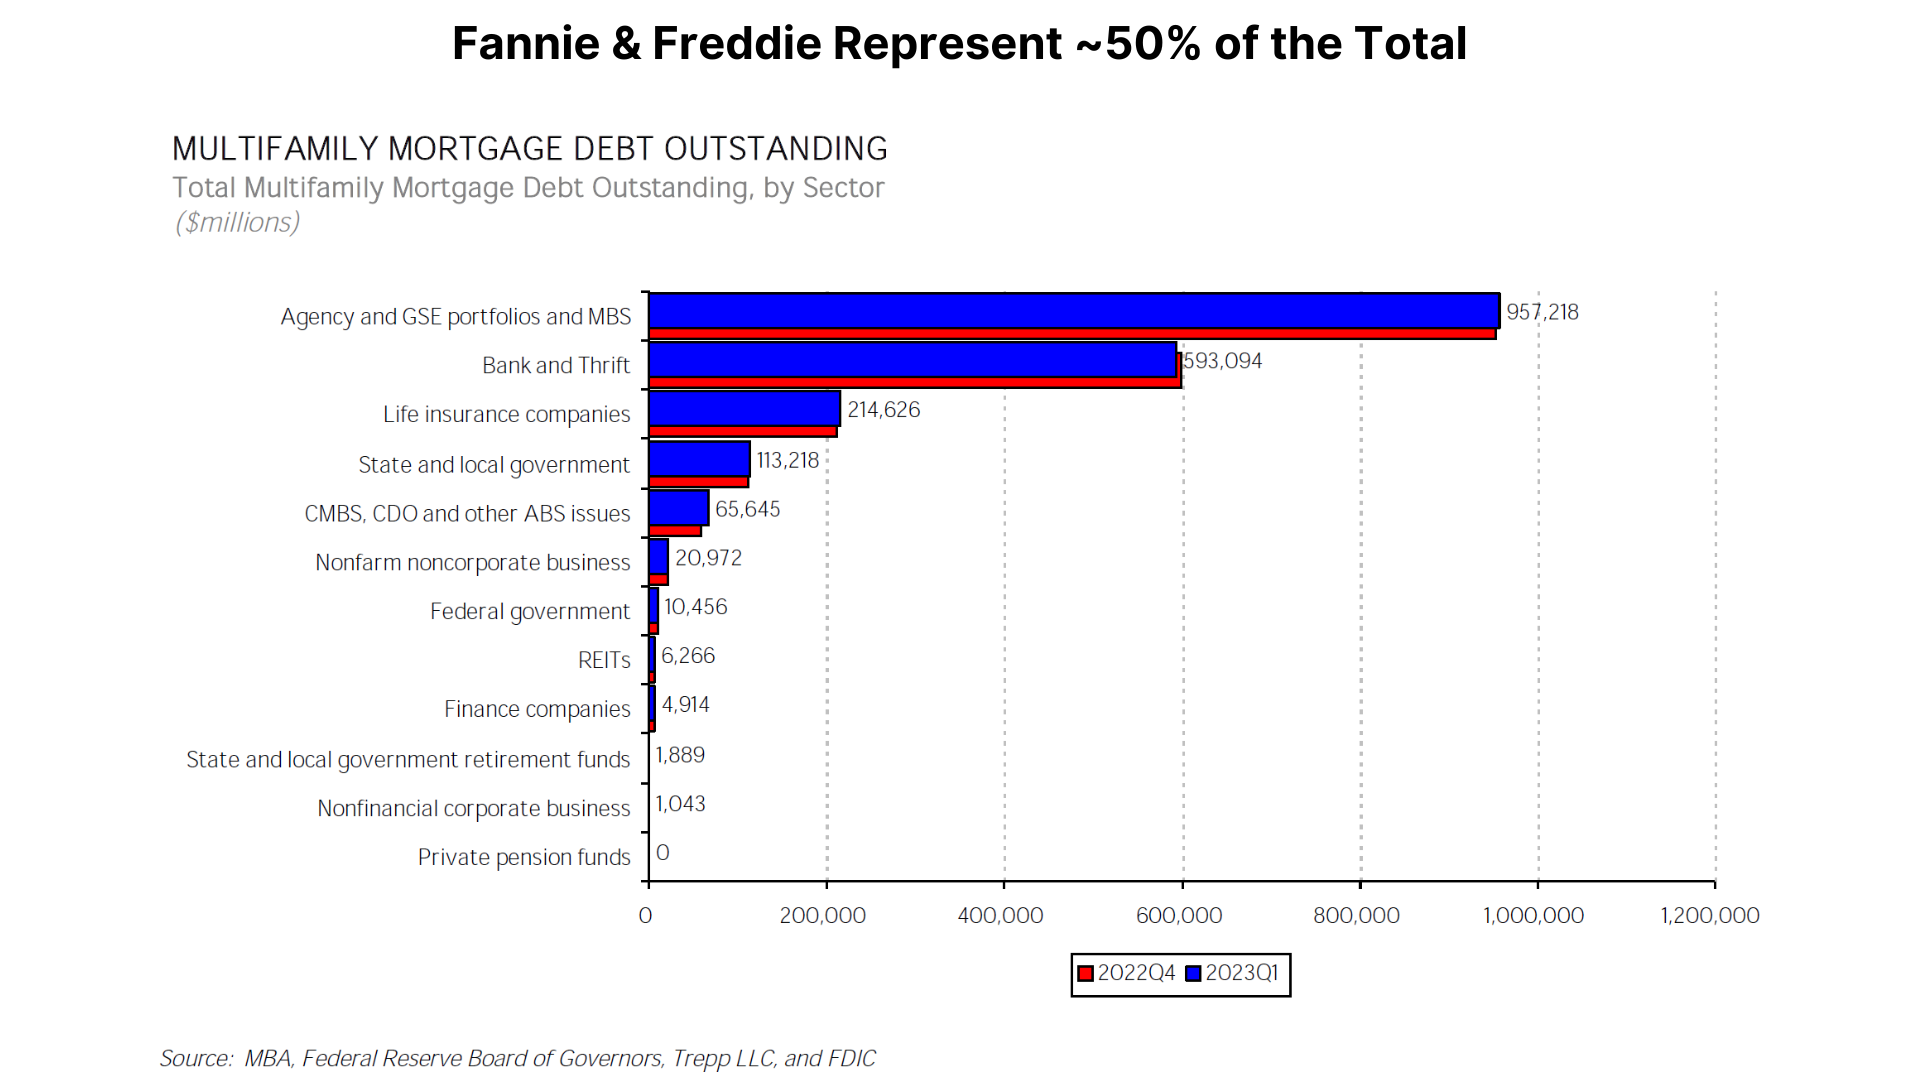
The overall multifamily mortgage market is about $2 trillion. The mFam REITs we evaluate in this report represent about $10b of secured debt, so a tiny fraction of the market. As we explain below, we see little credit risk at the mFam REIT level. However, we want to provide some detail to the overall multifamily mortgage market as these need to be separated.
Below we show a breakdown of where multifamily debt resides. About half, or $957b is agency debt (Fannie & Freddie). Historically, multifamily agency debt has experienced very low delinquencies and while this number has risen recently, it remains below 50bps.
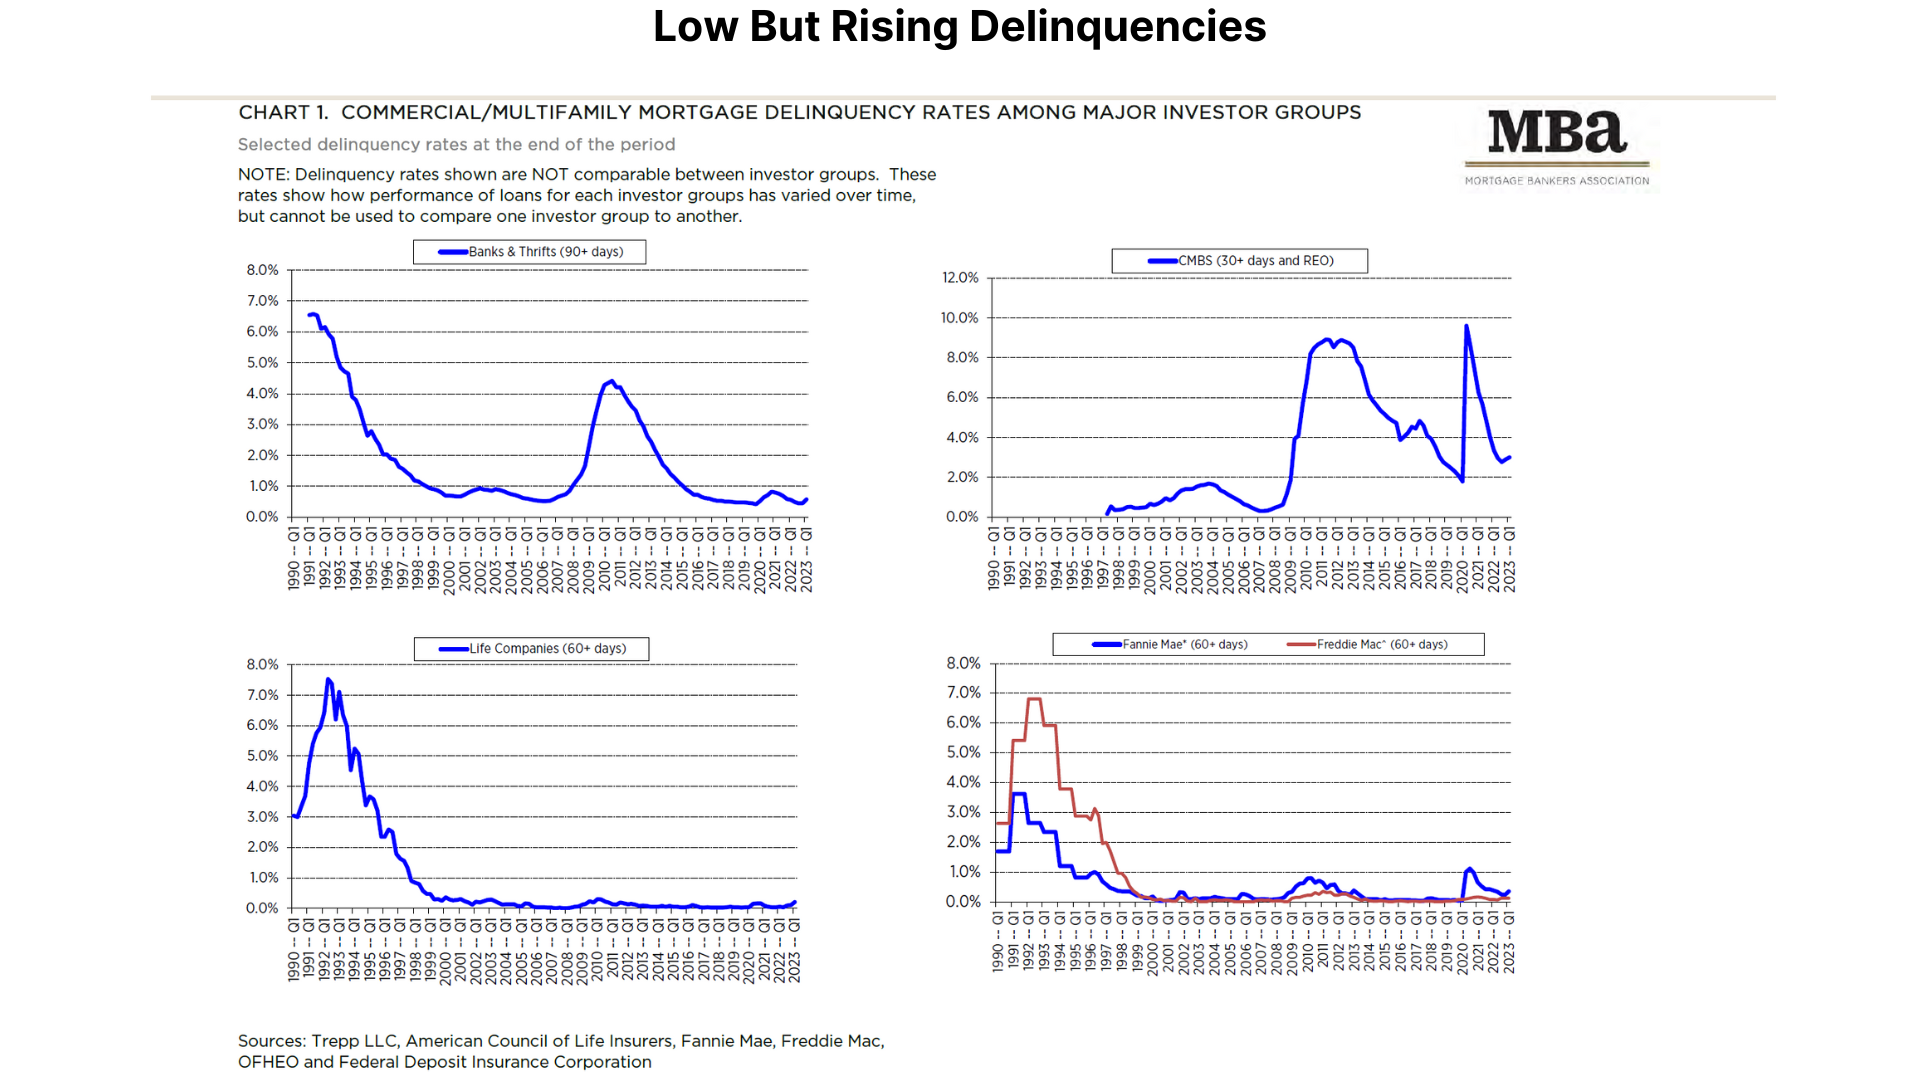
Delinquency rates for all categories of multifamily mortgages are shown below and while overall delinquencies remain extremely low, they are rising in some cases and most notably within CMBS.
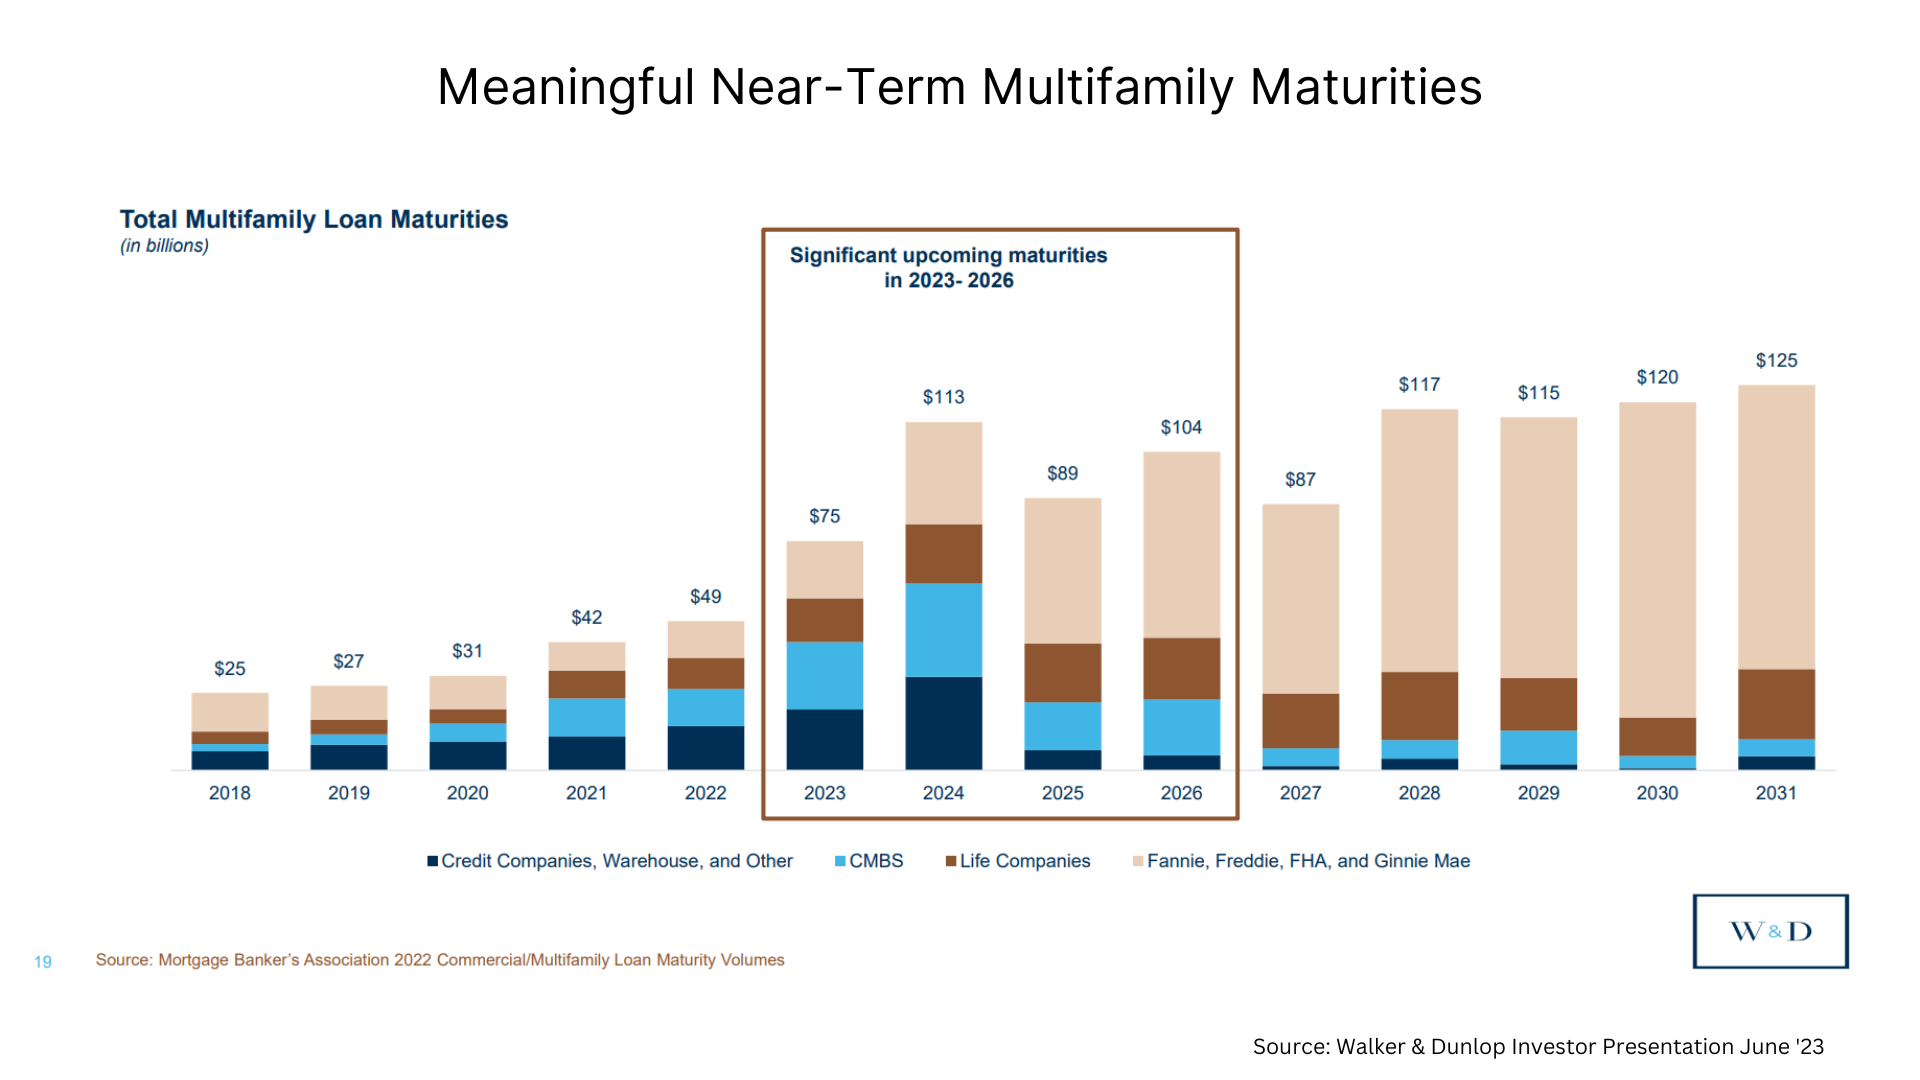
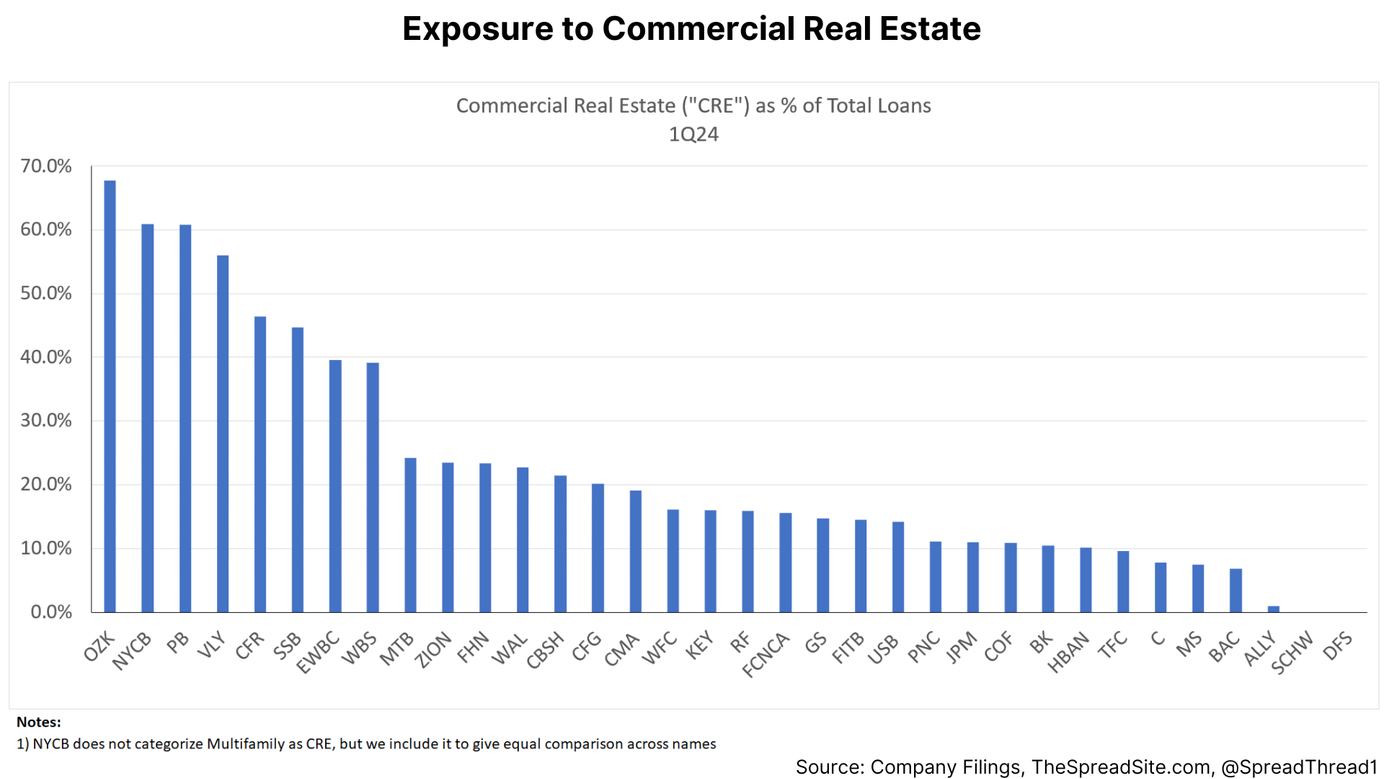
We also have the frequently cited “maturity wall” to contend with. Properties with high loan to values (“LTVs”) that are refinancing at rates ~2x higher than pre-2020 will face issues and cause delinquencies to continue rising. We also think lower quality buildings with higher financing rates and operating expense inflation will have limited cash flow for upkeep. Consequently, these buildings will have a difficult time competing against Class A properties that tend to be owned by large institutions like mFam REITs.
All of this means we are likely to have continued headline risk which will flow through the market and impact mFam REIT equities even if their underlying properties and liquidity is manageable.
Part 3: Multifamily REIT Comps & Geographic Breakdown
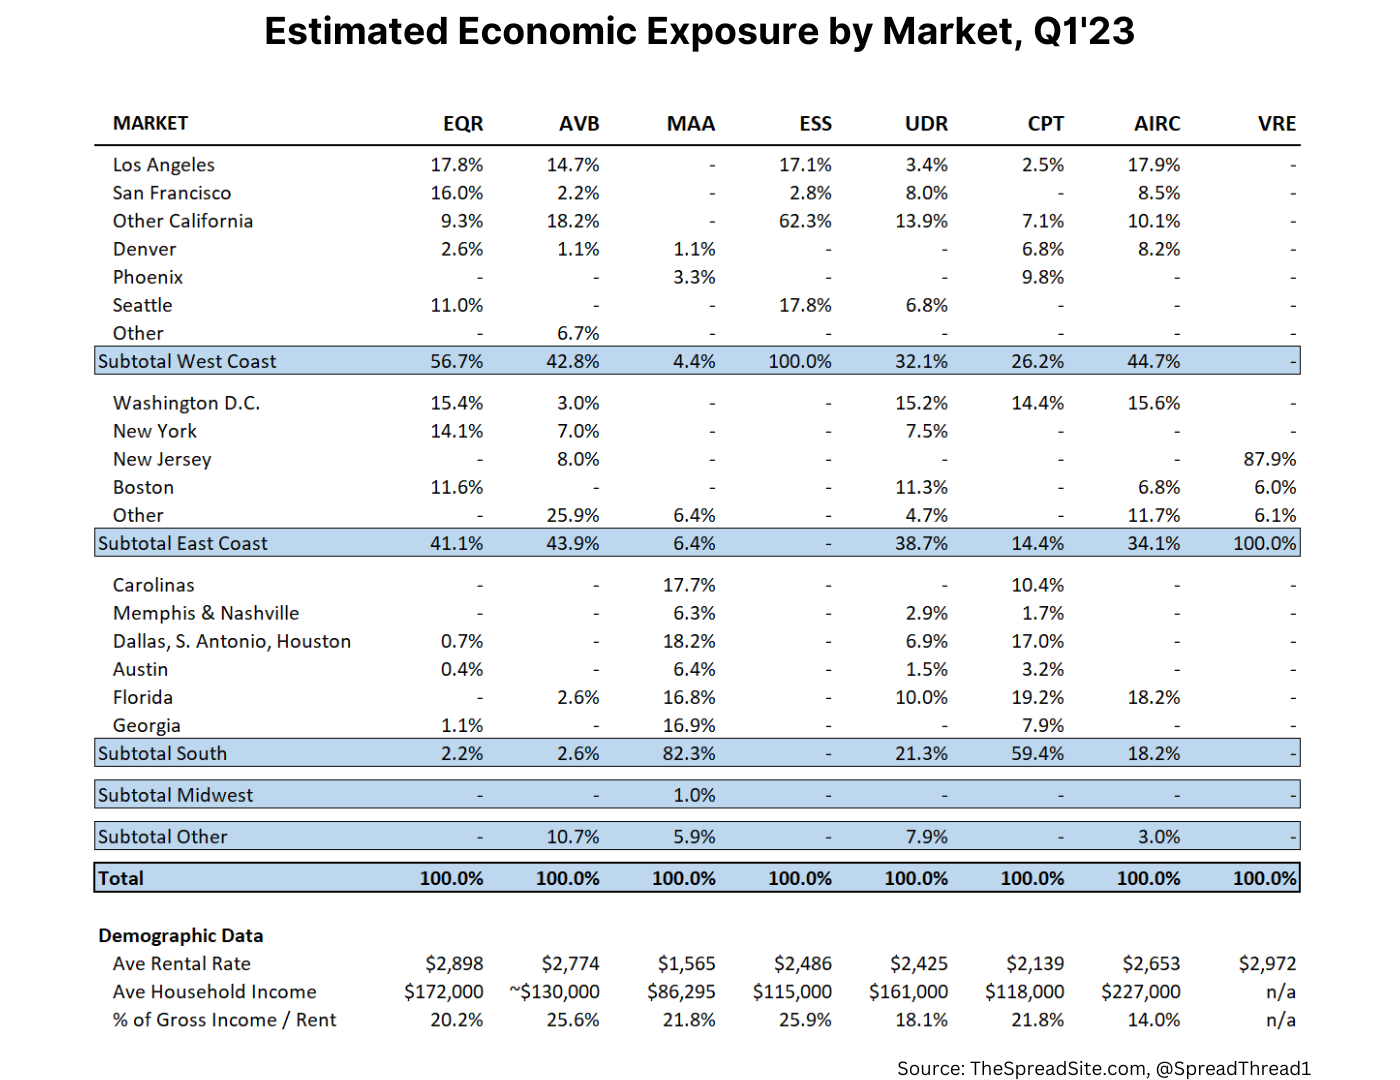
As with all real estate, location matters with every market facing unique fundamentals. Below we show geographic exposure and some demographic info for the group. The concentration is on the coasts and southern portion of the US. Average rents are within affordability metrics (below 30% of gross income is considered “affordable”), although we do note that this can change quickly if unemployment rises.
Before we discuss comparables data we need to mention a few items on our cap rate methodology as this is a primary valuation metric for real estate.
For those less familiar, a cap rate is defined as NOI / Enterprise Value and is a shorthand way to look at returns. The metric provides a static return estimate for real estate BEFORE accounting for any financing decisions. We show a simple NOI calculation below and provide significantly more detail on cap rates in our report titled Cap Rate Primer: Definitions, Calculations & Return Implications.
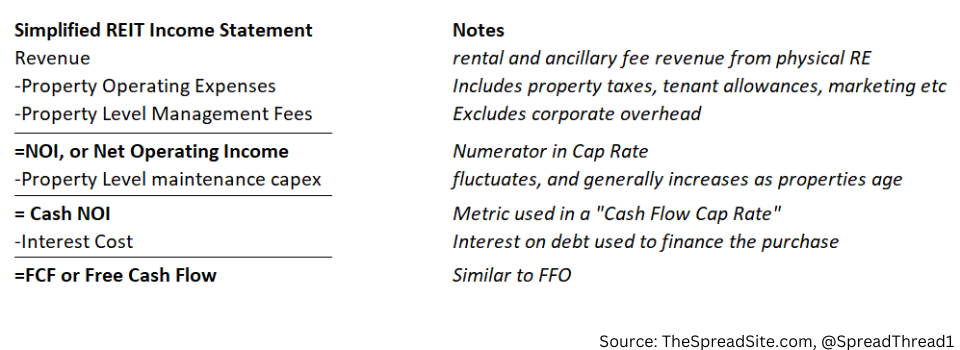
Cap rate metrics can differ depending on the source as there is discretion in the numerator and denominator. Our methodology is outlined below:
- ASSETS: All JVs, undeveloped land & other investments are valued separately. This value is included as an asset which increases per share value in the Enterprise Value calculation.
- LIABILITIES: Proportionate Debt includes any pro rata debt in off B/S JVs as a liability and reduces per share value in the Enterprise Value calculation. This is done because when allocating credit to JV assets we also have to account for associated debt (e.g., if a company owns 30% of a building with $1b of debt, the included proportionate debt would be $300mm).
- CAP RATE: The NOI number DOES NOT include NOI from JVs and other investments because the value is already being picked up in the “Development Assets, JVs & Co-Investments” column.
- LEVERAGE: The calculation uses EBITDAre (EBITDAre definition can be found here), which DOES include EBITDA from JVs and other investments, so Leverage = (Proportional Debt + Prefs – Cash) / EBITDAre.
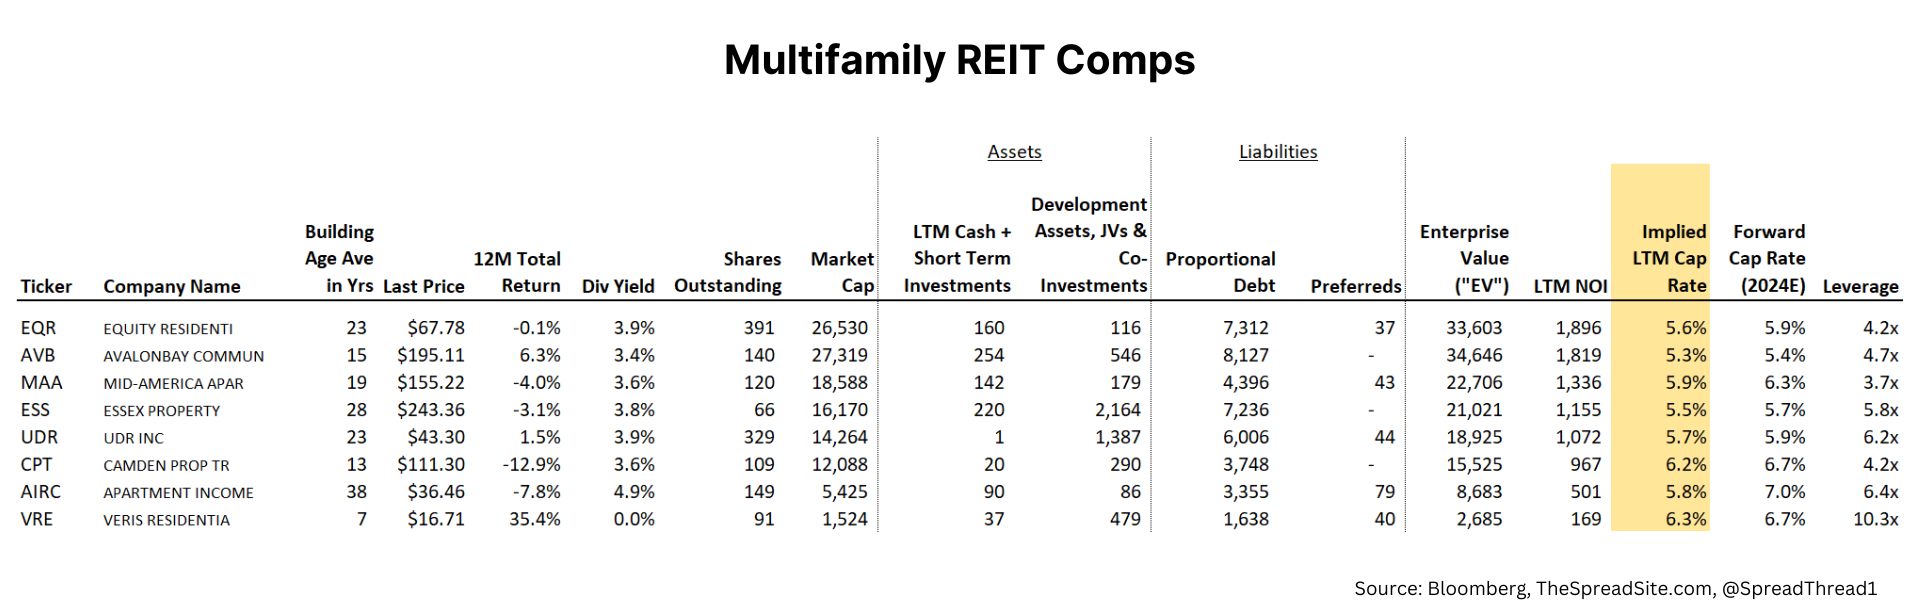
Take note of the implied LTM cap rates. These are quite low in our opinion, leaving these names priced for a very rosy environment. We discuss why in Part 4 below.
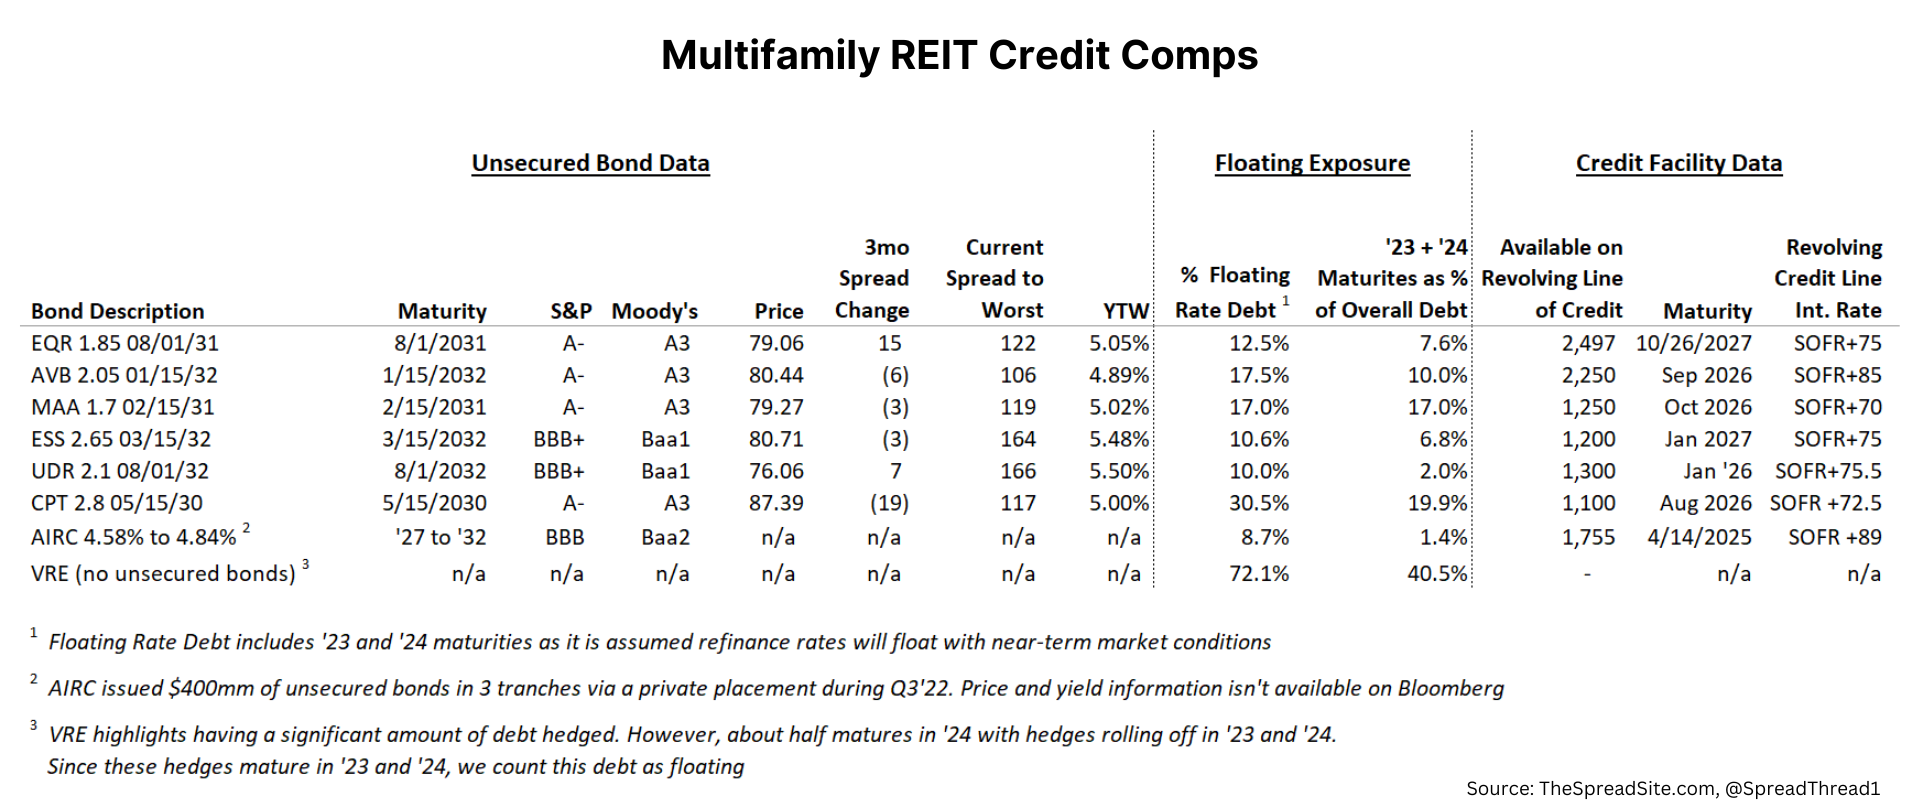
In contrast, we are much less worried about the debt issued by mFam REITs (VRE excluded). As you can see in the table below, the group is primarily IG rated with limited floating rate exposure (CPT & VRE are at the high end), manageable ’23 and ’24 debt maturities and significant access to lines of credit. Furthermore, most of their debt is unsecured with significant value in unencumbered properties that could access secured financing if the unsecured market gaps out.
As a pushback to our view on mFam REIT credit, some may point to the office sector where IG rated companies saw spreads blow out and yields approach high single digits. A big difference is that the office sector is arguably facing secular headwinds whereas multifamily, even in a severe downside, is still facing cyclical headwinds. The latter is vastly preferred as a creditor because companies have many levers they can pull before causing permanent impairment to their debt.
We mentioned in Part 2 the massive market for multifamily agency debt. We aren’t experts in the mortgage market and deal pricing differs depending on maturity, LTV, debt service coverage ratio, etc. But we think it is reasonable to assume the IG rated mFam REITs could access agency financing at 75 to 125bps over a risk-free benchmark. Not to say the cost of financing won’t go higher, but there is significant access to credit.
Part 4: Cap Rates and Expected Returns
As mentioned in Part 3, we believe cap rates are too low for mFam REITs. This is because:
- New supply (and possibly a weakening economy) are likely to impact rent growth
- High debt cost and operating expense inflation will impact free cash flow
- Higher fixed income yields are now competition for mFam REITs, all while the sector likely won’t experience the same interest rate tailwind it has over the past two decades.
To begin with, mFam REITs are now approaching a negative leverage scenario where the cost of debt becomes higher than cap rates. This will vary with each company’s cost of capital and cap rate, but leverage no longer carries the same benefit we saw before 2020 when financing rates for properties were ~3%.
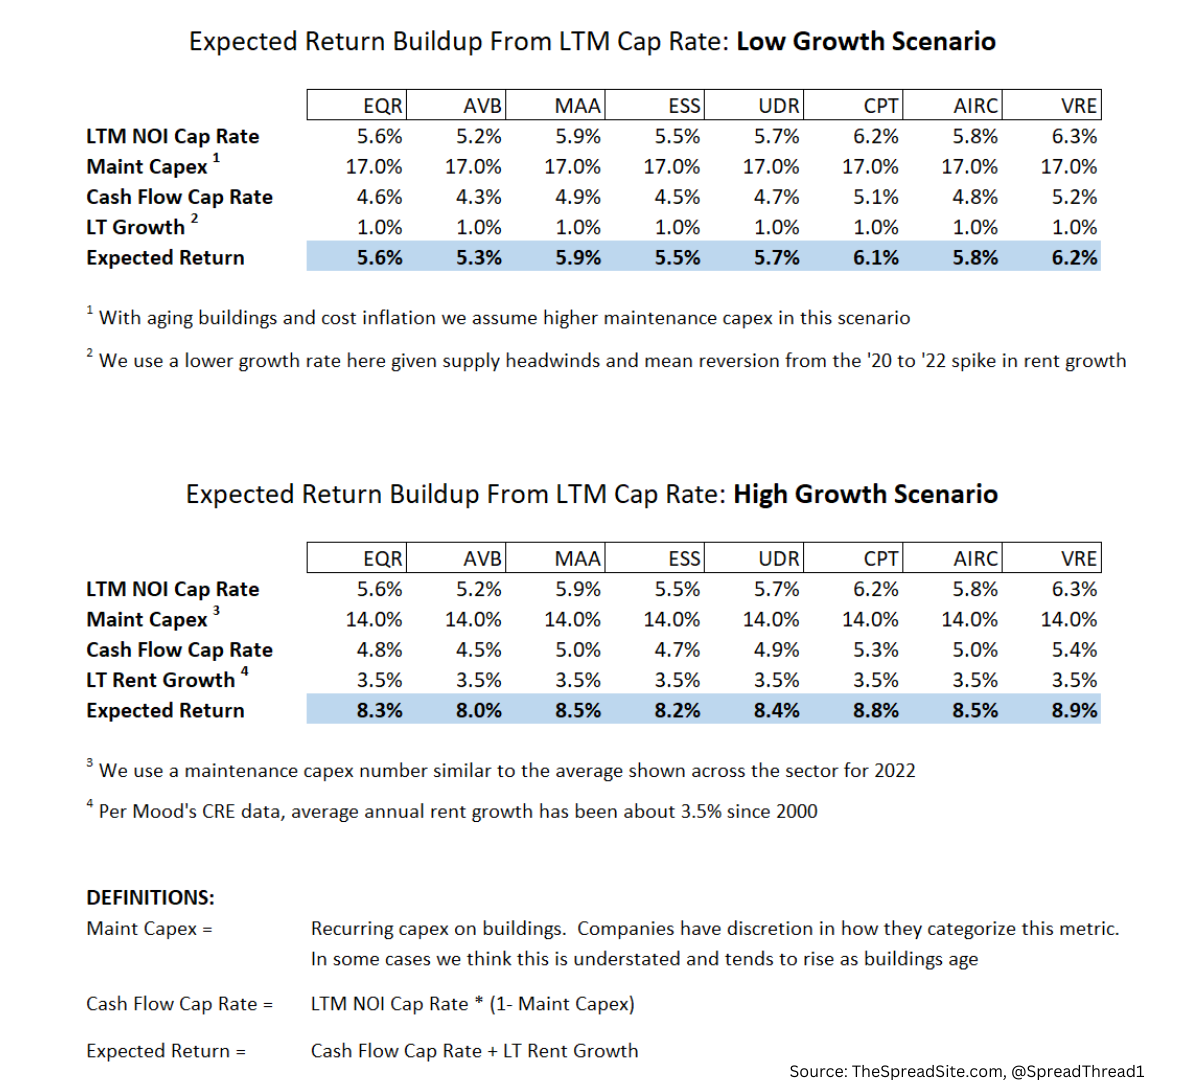
Our expected return analysis below is a way to tie a starting cap rate with equity returns and assumes the asset was purchased with zero debt (as cap rates exclude interest cost). So a high cost interest rate environment will further eat into expected returns shown below and is another reason we argue current cap rates should be higher.
It is important to note that the analysis below incorporates more of a long-term view on rent growth. We use 1% in our “low growth” scenario where we assume the combination of significant supply and a payback from strength seen in 2021 would drive below-trend growth. Our “high growth” scenario assumes rent growth similar to what we saw over the past 20 years.
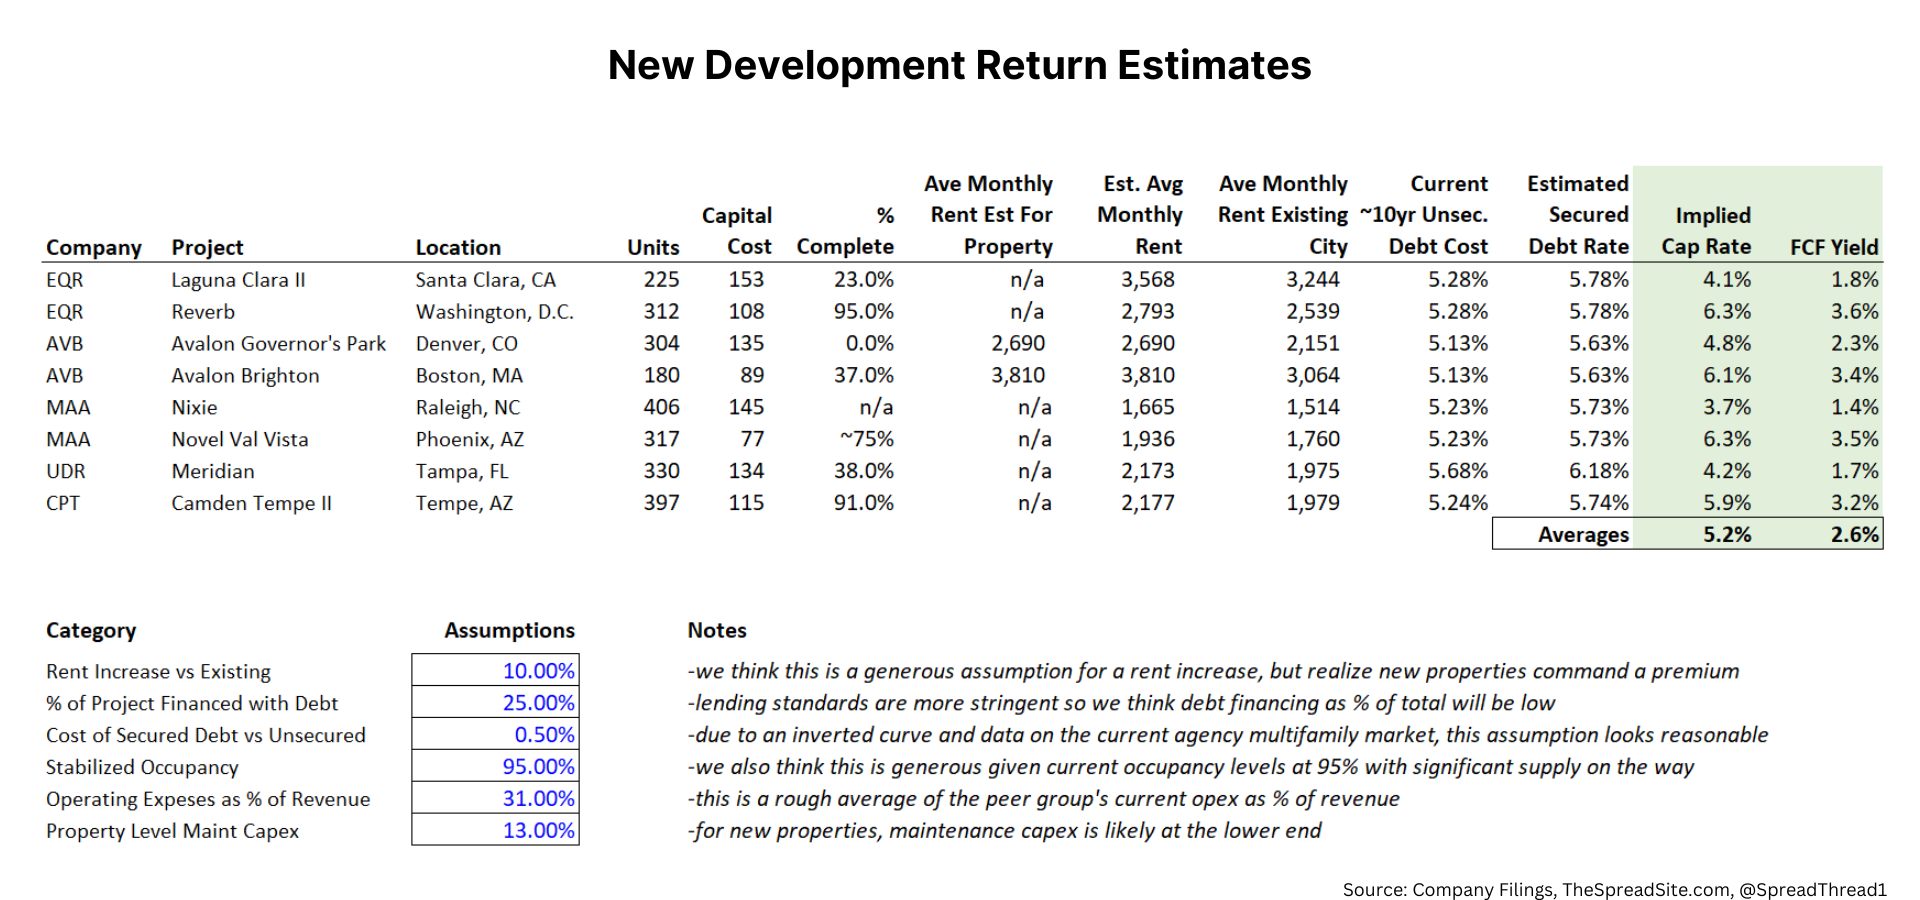
With operating expense cost inflation and higher interest rates, FCF and dividend growth within mFam could lag rent growth. Numerous stories in the media discuss apartment building owners being unable to cover operating expenses + financing costs. We don’t think the situation is overly dire within mFam REITs, but we do think development returns could be weak. In other words, headline rent growth could mask lagging growth in NOI and FCF.
As an example, we take a few development properties mentioned in filings. With some assumptions, we estimate cap rates and FCF for these buildings. This is a “guesstimate” at best, but even being generous with rents in respective markets, cap rates and FCF yields look low.
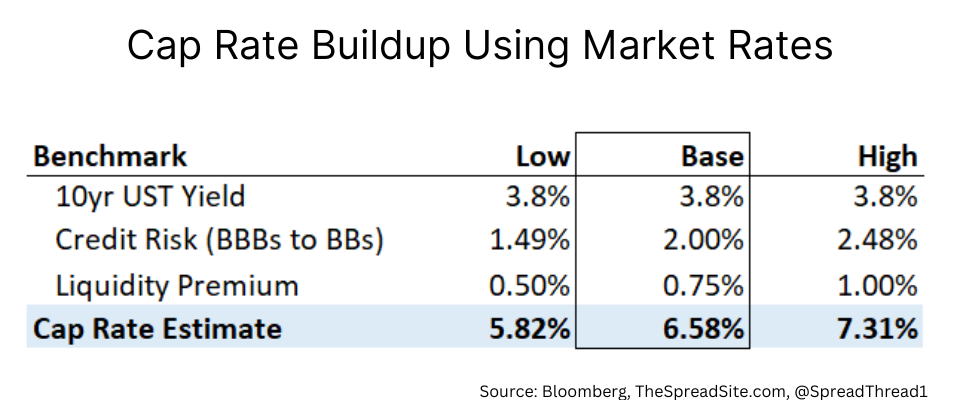
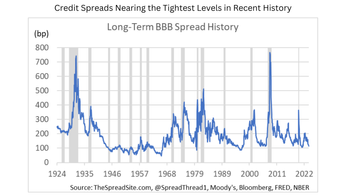
Since predicting long-term growth for apartment rents is uncertain, we also look at where cap rates arguably should be based on credit markets. This buildup takes the current 10Y UST yield, adds a credit spread, and then adds a liquidity premium. The credit spread depends on the inherent riskiness of the tenant base. We use a range of BBBs to BBs.
Our bottom line is that cap rates are low vs fair value, macro risks for the sector are rising, and fixed income yields have also risen. As a result, in the ‘low growth’ scenario outlined above, IG credit is likely better risk/reward at a 5.35% yield (lower beta, more sector diversification) vs current mFam REIT cap rates. In the ‘high growth’ scenario, mFam returns would be better, but in that case, yield products like REITs could underperform for a period of time as rates likely continued to rise.
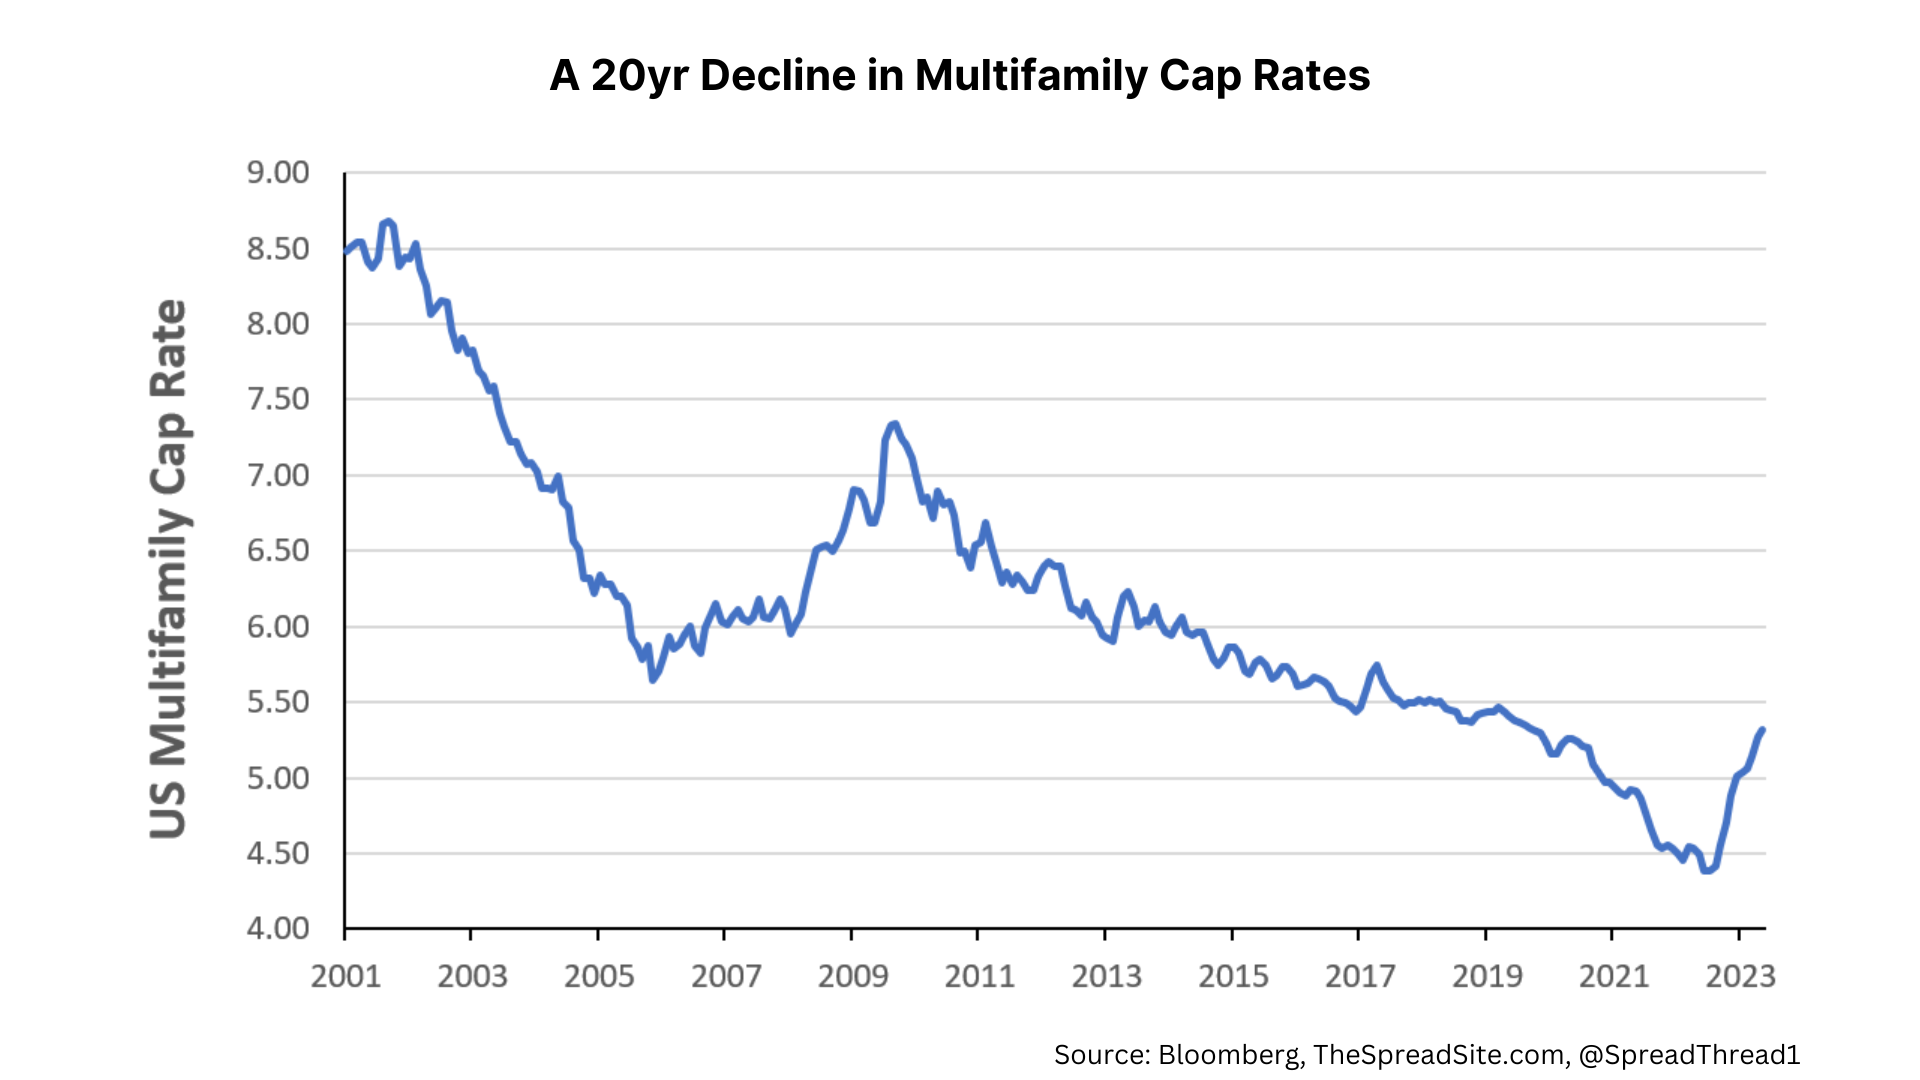
Also remember that mFam REITs had a massive tailwind from falling Treasury yields for a long period of time. For example, from 2000-2019, the 10Y went from 6.6% to 1.9%, a decline of 467bps. Apartment cap rates over this same period went from 8.5% to 5.2%, a decline of 330bps.
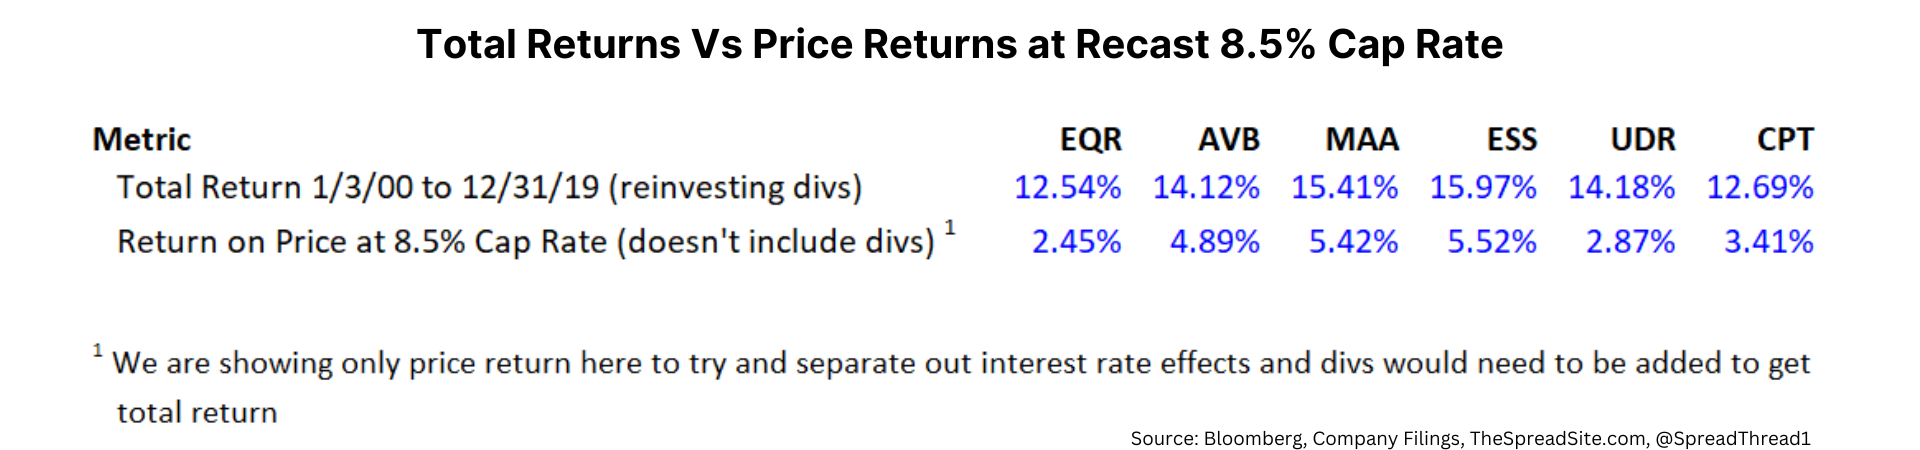
In the Exhibit below, we show mFam REIT total returns over this period outright (excluding VRE and AIRC because of restructuring impacting their data), and the total return solely based on price if you adjusted valuation at 12/31/19 to an 8.5% cap rate. This is an extreme oversimplification, but we use it to show just how much of a tailwind falling rates were to the sector.
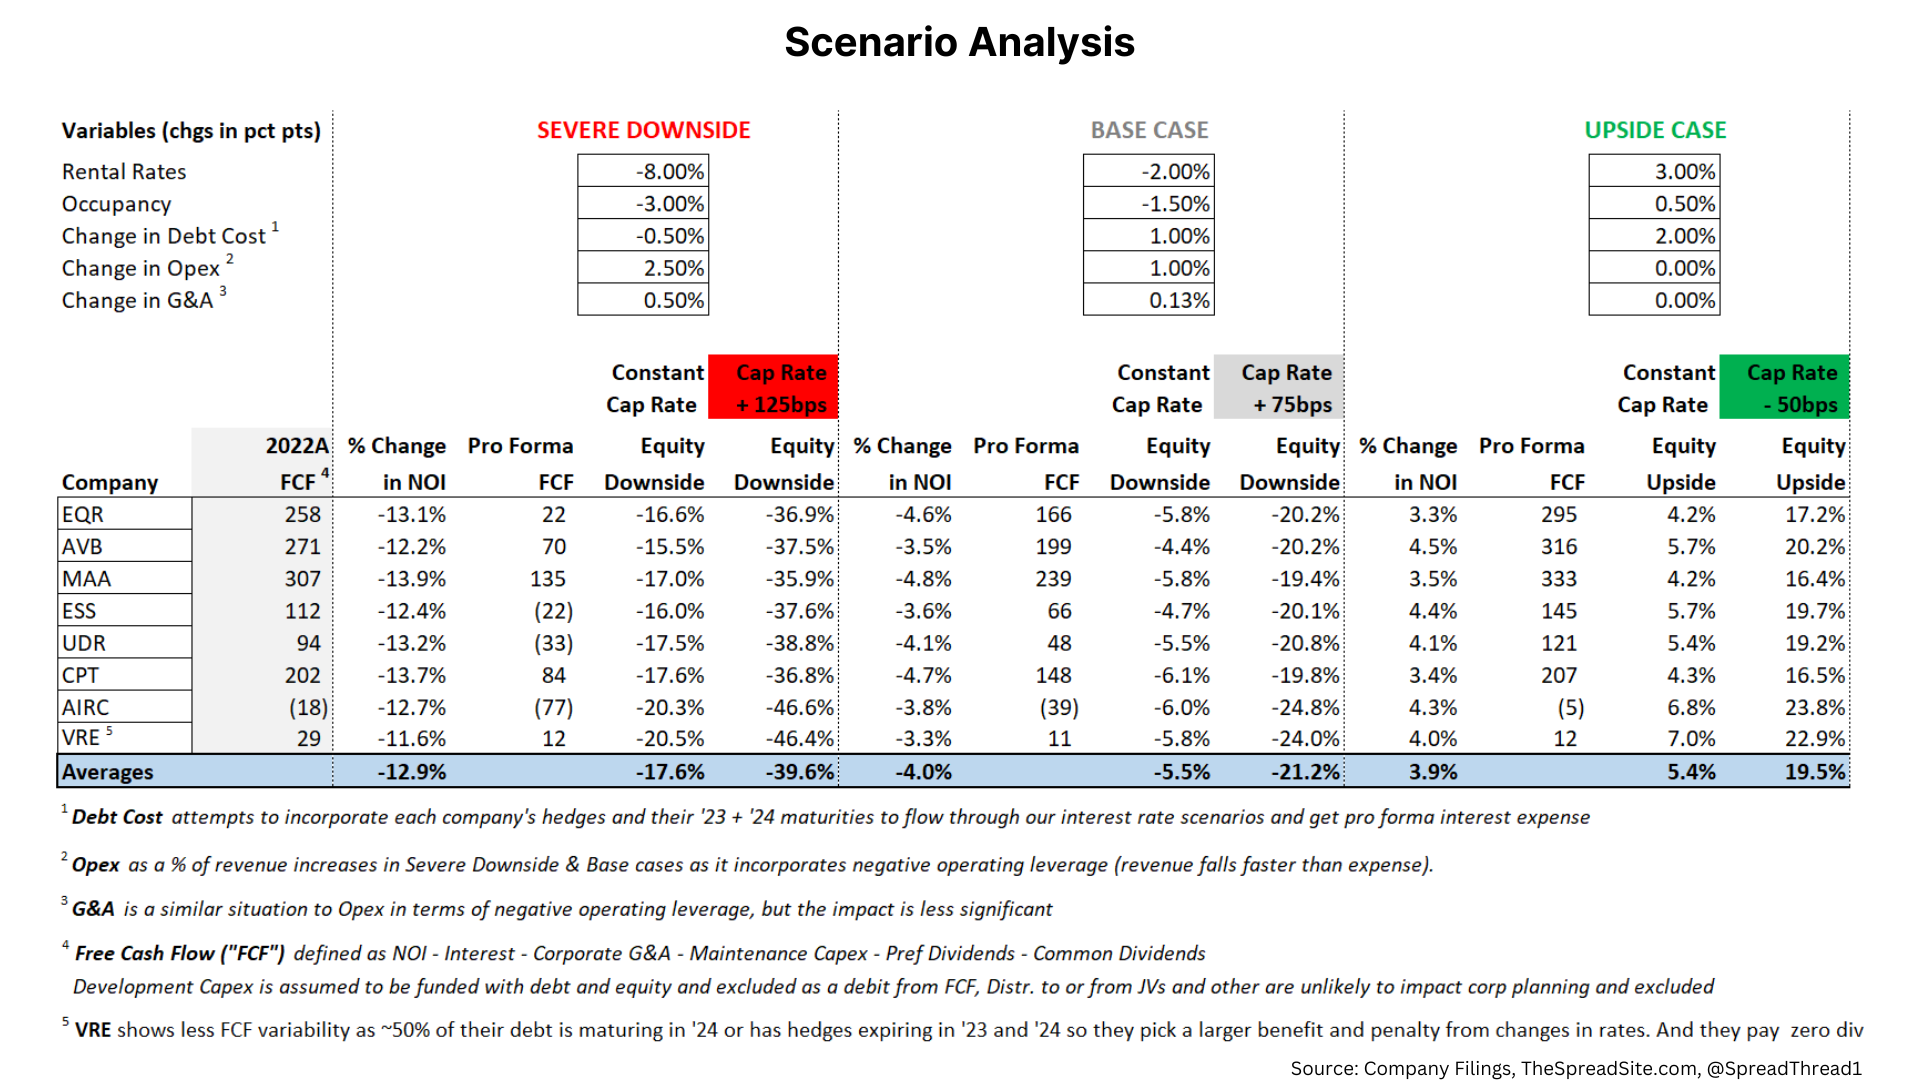
Part 5: Multifamily REIT Scenario Analysis
Putting it all together below, we show three scenarios where we flow through our assumptions to see the resulting NOI and FCF. We then look at where equity prices could go depending on pro forma NOI and a cap rate assumption. Generally, cap rates will widen or tighten based on sector fundamentals so we think it is important to show the impact if cap rates change in addition to NOI.
As a sidenote: In our scenarios we show interest rates +200bps in the 'Upside Case' and down 50bps in our 'Severe Downside.' mFAM REITs, on average, have debt costs ~3.5%. So their debt financing is mainly pre-2020. Consequently, even in a 'Severe Downside,' falling interest rates would likely have a muted impact.
If we are wrong and fundamentals improve, we think upside is muted. Granted, rent growth could be higher than 3% and cap rates could tighten more than 50bps, we just think this is unlikely.
We’ve tried to make the point that mFam REITs should compete with other yield products and have to contend with supply and valuation headwinds. Both could cause downside to the equity. However, aside from AIRC where we could see a dividend cut in a severe downside, the other names should be fine with regards to dividend stability (VRE doesn’t currently pay a dividend).
If a downturn was prolonged, we would likely see development get pushed out and possibly dividend cuts. But given retail ownership and the stigma associated, we think they would cut as a last resort.
Looking at their debt, we don’t see any issues in interest payment capacity even in a 'Severe Downside.' Spreads would certainly widen out, but we see limited default risk. However, as the table below shows, weighting the various scenarios, the equity risk/reward is poor, in our view.
Part 6: Trade Idea
A trade idea we like is getting short lower quality paired with higher quality longs to help offset the negative carry. For example, short AIRC + VRE paired with a long in EQR and MAA.
- Combining EQR+ MAA provides geographic diversification. Furthermore, these names have limited development pipelines, solid IG cap structures with modest leverage and should be able to cover their dividend in a 'Severe Downside.'
- On the short side, AIRC’s dividend could be at risk in a 'Severe Downside' and leverage is elevated at 6.4x. VRE is finalizing a restructuring where they transitioned from office + mFam to a mFam pure-play. However, they still have ~10x leverage, zero dividend yield, high floating rate exposure and ~88% geographic exposure to one market (NJ).
Disclosures
Please click here to see our standard legal disclosures
The Spread Site Research
Receive our latest publications directly to your inbox. Its Free!.


