Cap Rate Primer: Definitions, Calculations & Return Implications
Summary
- Capitalization Rates, or Cap Rates, are frequently used by real estate investors as a valuation tool. Simply, the formula is Net Operating Income / Property Value. This measure is used to compare across individual properties and/or sectors such as REITs. We break down both the numerator (Net Operating Income) and denominator (Property Value) and show how to calculate each.
- Cap Rates are also used to estimate a long-term return when purchasing a real estate asset. And we show the relationship between Cap Rates and returns.
- Credit markets have a significant impact on where Cap Rates “should" be and we illustrate the key components impacting Cap Rates from a macro perspective.
- In the appendix, we walk through an example of how to calculate a Cap Rate for a publicly traded REIT as there is more nuance involved given REITs typically hold a portfolio of assets.
What Is A Cap Rate?
A Cap Rate is a useful way to compare valuations across real estate. Generally, Cap Rates are quoted as a single percentage without additional descriptive information. The formula is simply NOI/Property Price.
“NOI” is defined as Net Operating Income (we break this down further below) and is calculated from an income statement.
“Property Price” or “Property Value” is defined as the total value of the property, or the amount paid to acquire the real estate asset. For example, assume you have a house and based on current market conditions, this house would sell for $500k and has $300k remaining on a mortgage. If a buyer was interested in purchasing this house, the Property Price used in the denominator is $500k. In other words, the way a property is financed does not matter. What matters is the total amount paid to purchase the property. This is the number used in the denominator.
The reason debt finance does not matter is that Cap Rates are used to compare across properties on an apples-to-apples basis, while financing decisions will vary depending on the investor.
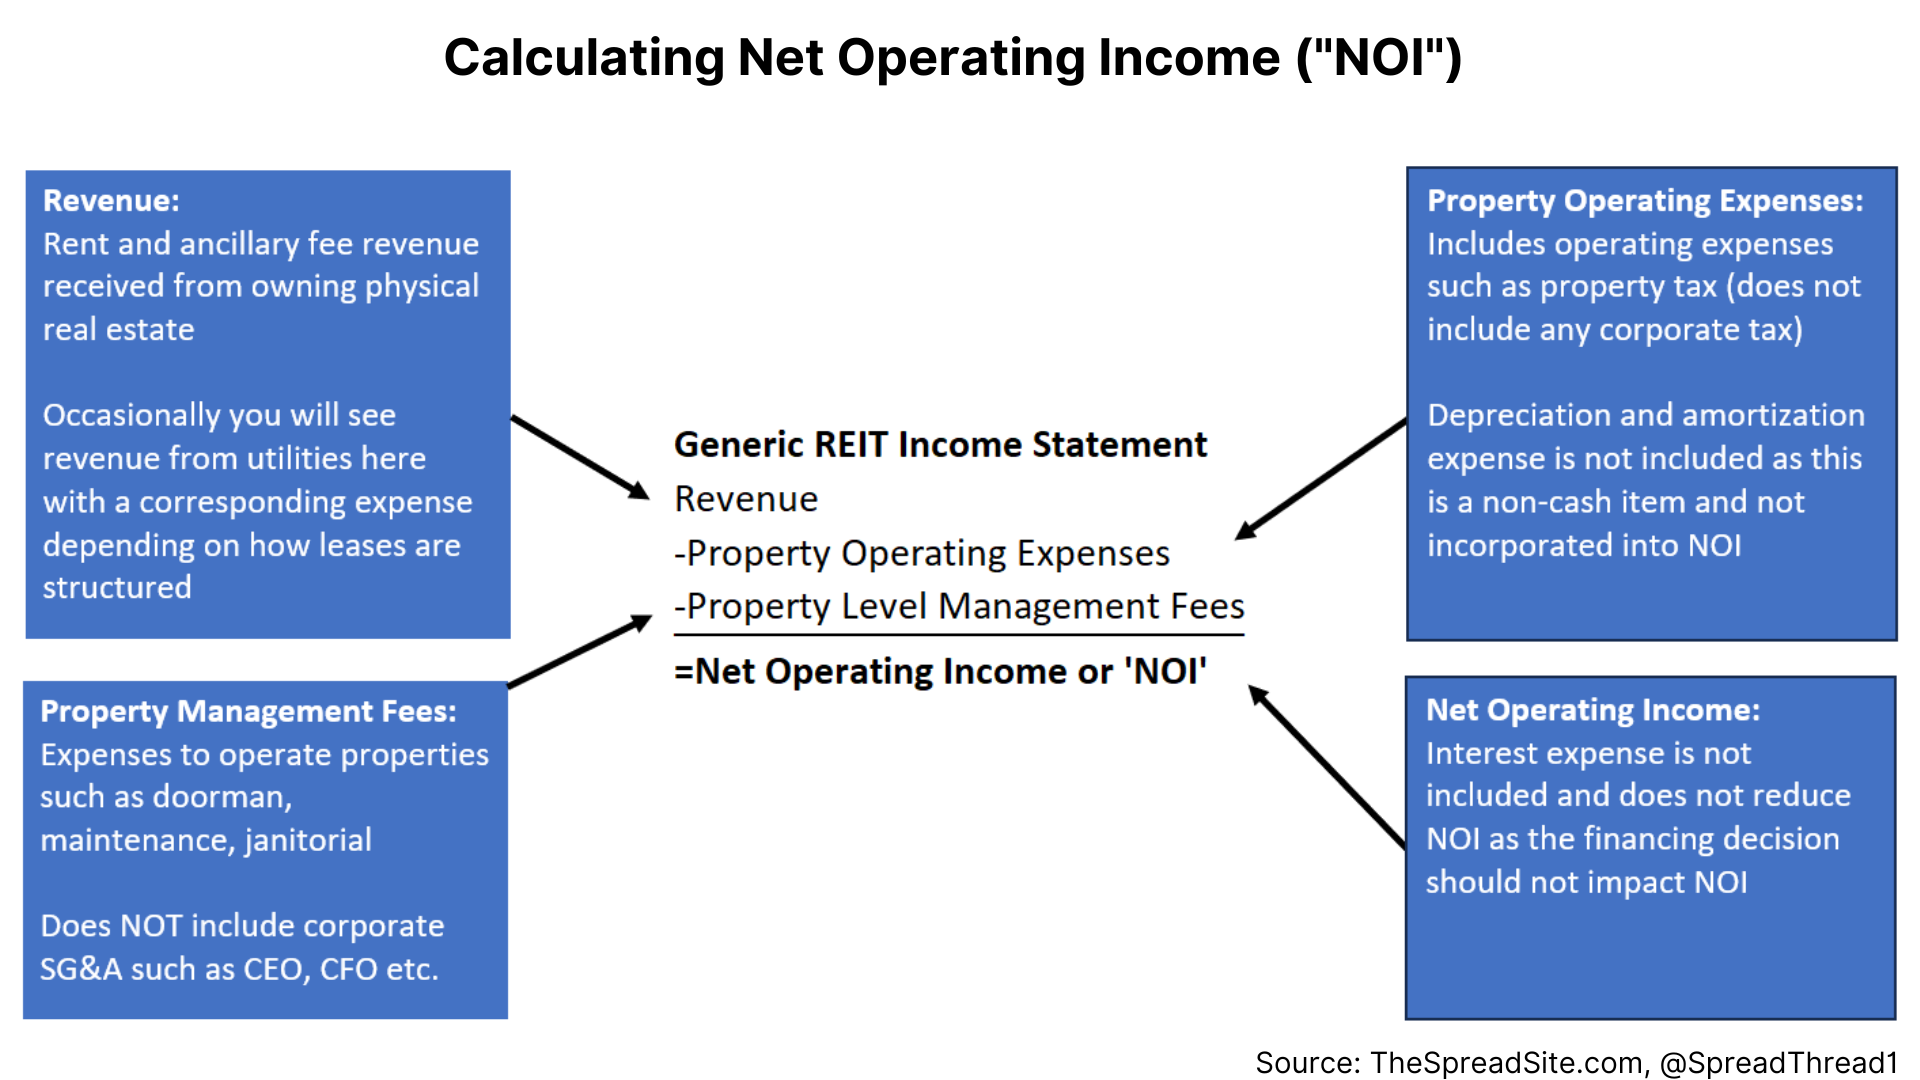
In order to break down Net Operating Income or “NOI” we use the example below. At a high level, this is net rental income after deducting property level operating expenses and management fees. Any interest cost from debt or mortgage financing on the property is not included in NOI because we are solely looking at the property, not the financing decision.
The example above primarily explains the calculation behind NOI. We can now go one step further and calculate NOI with actual numbers and show the entire Cap Rate formula. Furthermore, we illustrate the changes in Property Value as both NOI and Cap Rate change.
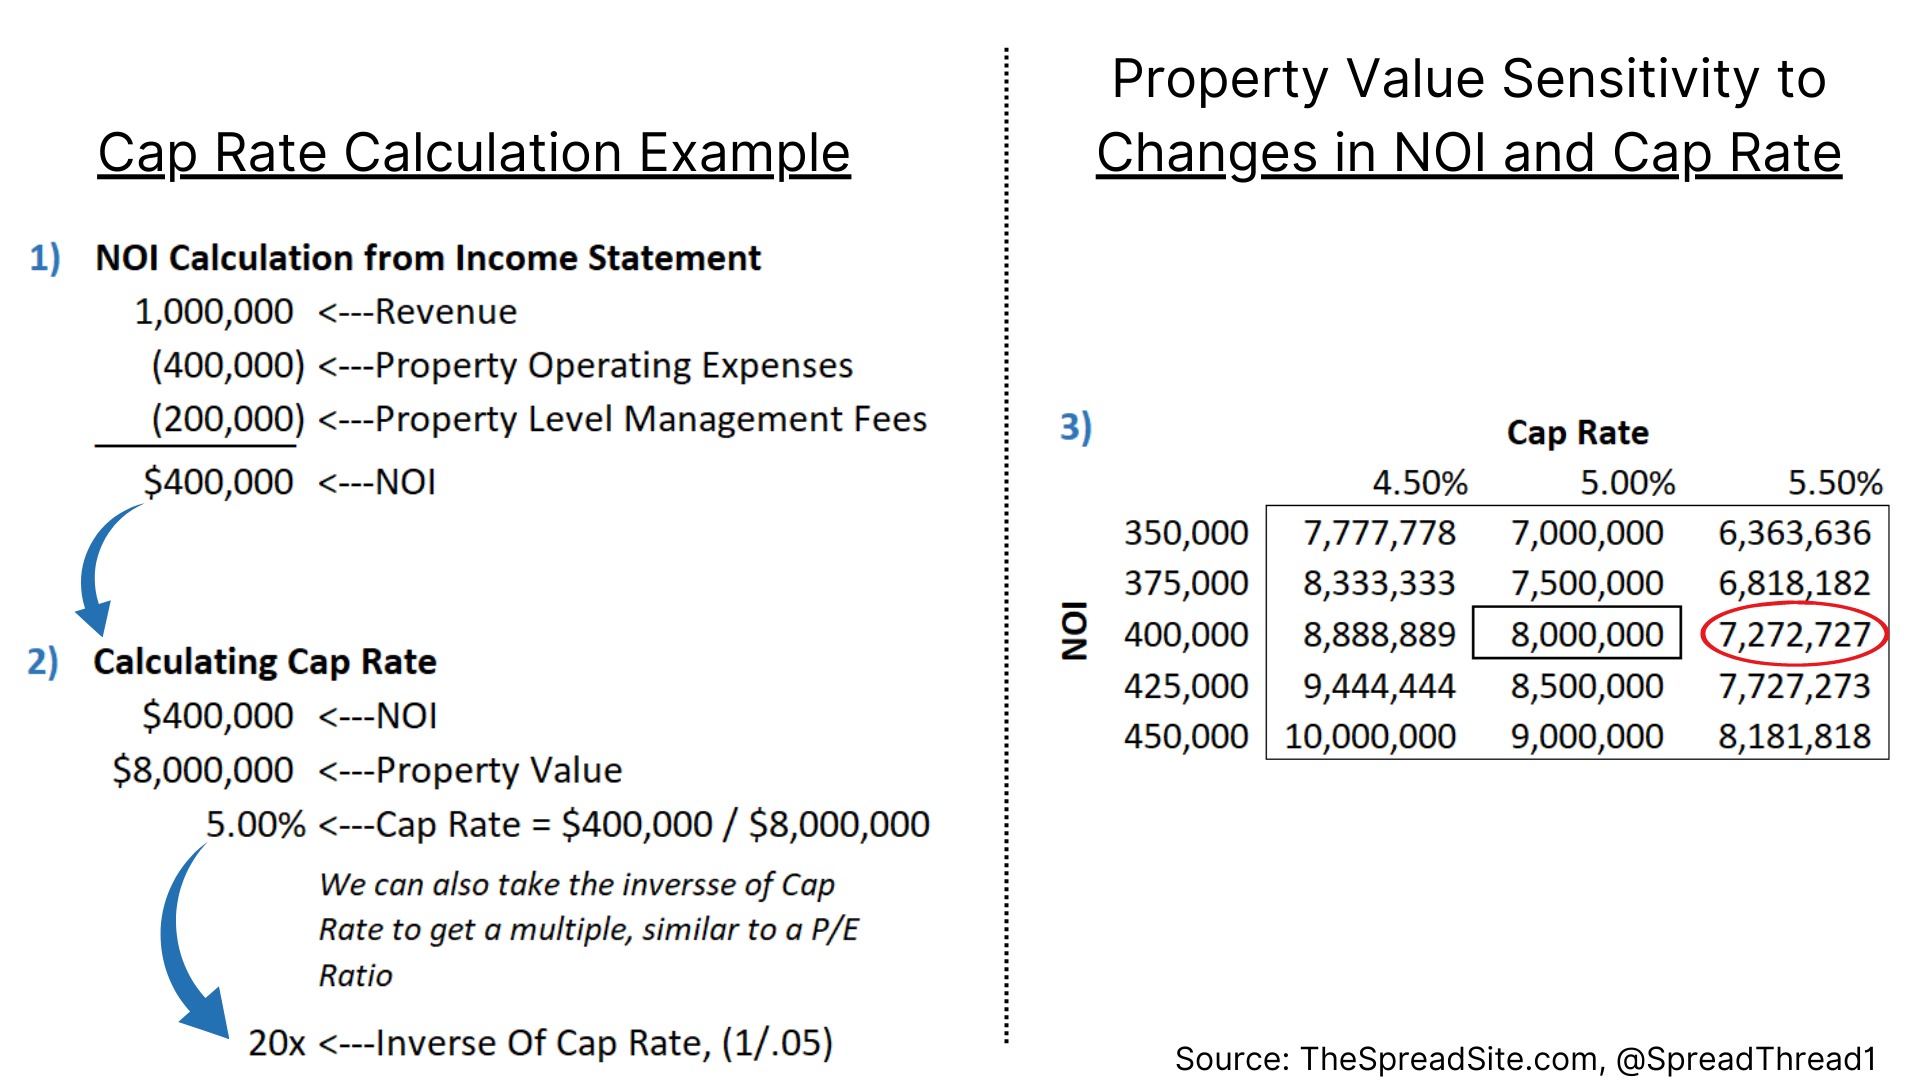
In this example, we calculate an NOI of $400,000 and assume we are purchasing a property for $8mm, resulting in a Cap Rate of 5%.
On the right side of the above diagram, we turn this calculation around to show an appropriate price for our example property. As Cap Rate and NOI fluctuates, so does the resulting Property Value. If the NOI is $400k, but we think a more realistic Cap Rate for the asset is 5.5%, we would be willing to pay $7.27mm and not $8mm.
Why Are Cap Rates Used?
As mentioned, a Cap Rate is a valuation metric used for assessing real estate and allows for equal comparison across properties.
Cap Rates can also be used as a starting point to measure a long-term return. Our return calculation below is a shorthand estimate and sometimes described as “Expected Return.” However, as we show later in this report, our shorthand method is very similar to an Internal Rate of Return (“IRR”), whereas we believe Expected Return more accurately describes a probably-weighted return estimate.
For our shorthand method, we just need to estimate a maintenance capex number as a percent of NOI and a long-term growth rate. Different property types have different metrics for each, but we can use these additional metrics along with a Cap Rate to get a long-term return estimate.
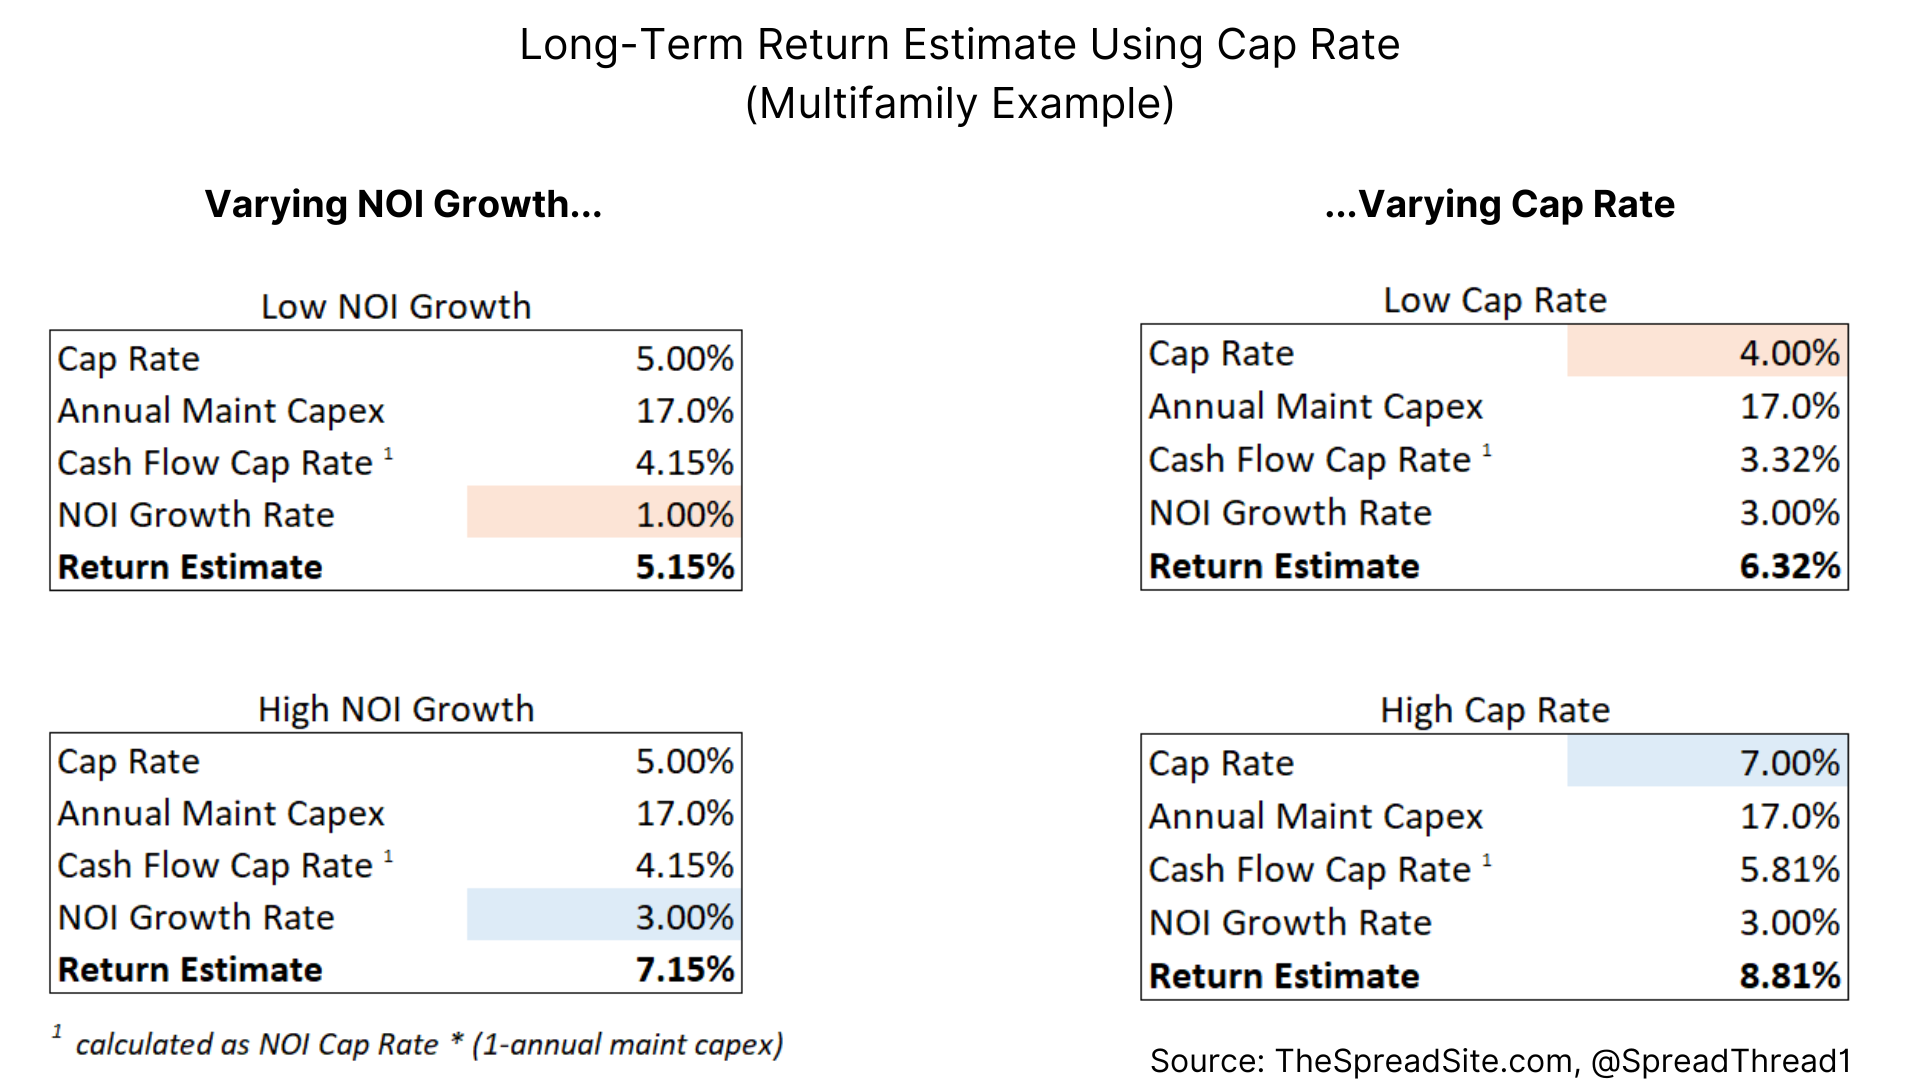
Our assumptions on maintenance capex as a % of NOI are taken from a research paper titled "What Should Stabilized Multifamily Cap Rates Be", and summarized below:
- Multifamily 17% (used in the above example)
- Office 33%
- Industrial 31%
- Retail 36%
These maintenance capex numbers are historical averages. They serve as a guide (differences can occur within sectors and properties) and indicate that as capital intensity and property age increases, so too should the Cap Rate, as less NOI is being returned as free cash flow.
The growth rate assumption for NOI is much more dependent on the view of the prospective buyer. While there is historical data available (we recommend CBRE and JLL as good resources), current macro trends play a huge role so history may not be a good predictor of the future. As we discuss in our report titled "Everyone's Starting a Multifamily", supply could dampen long-term growth rates. For office, work-from-home headwinds make NOI growth predictions difficult and likely very different from the past.
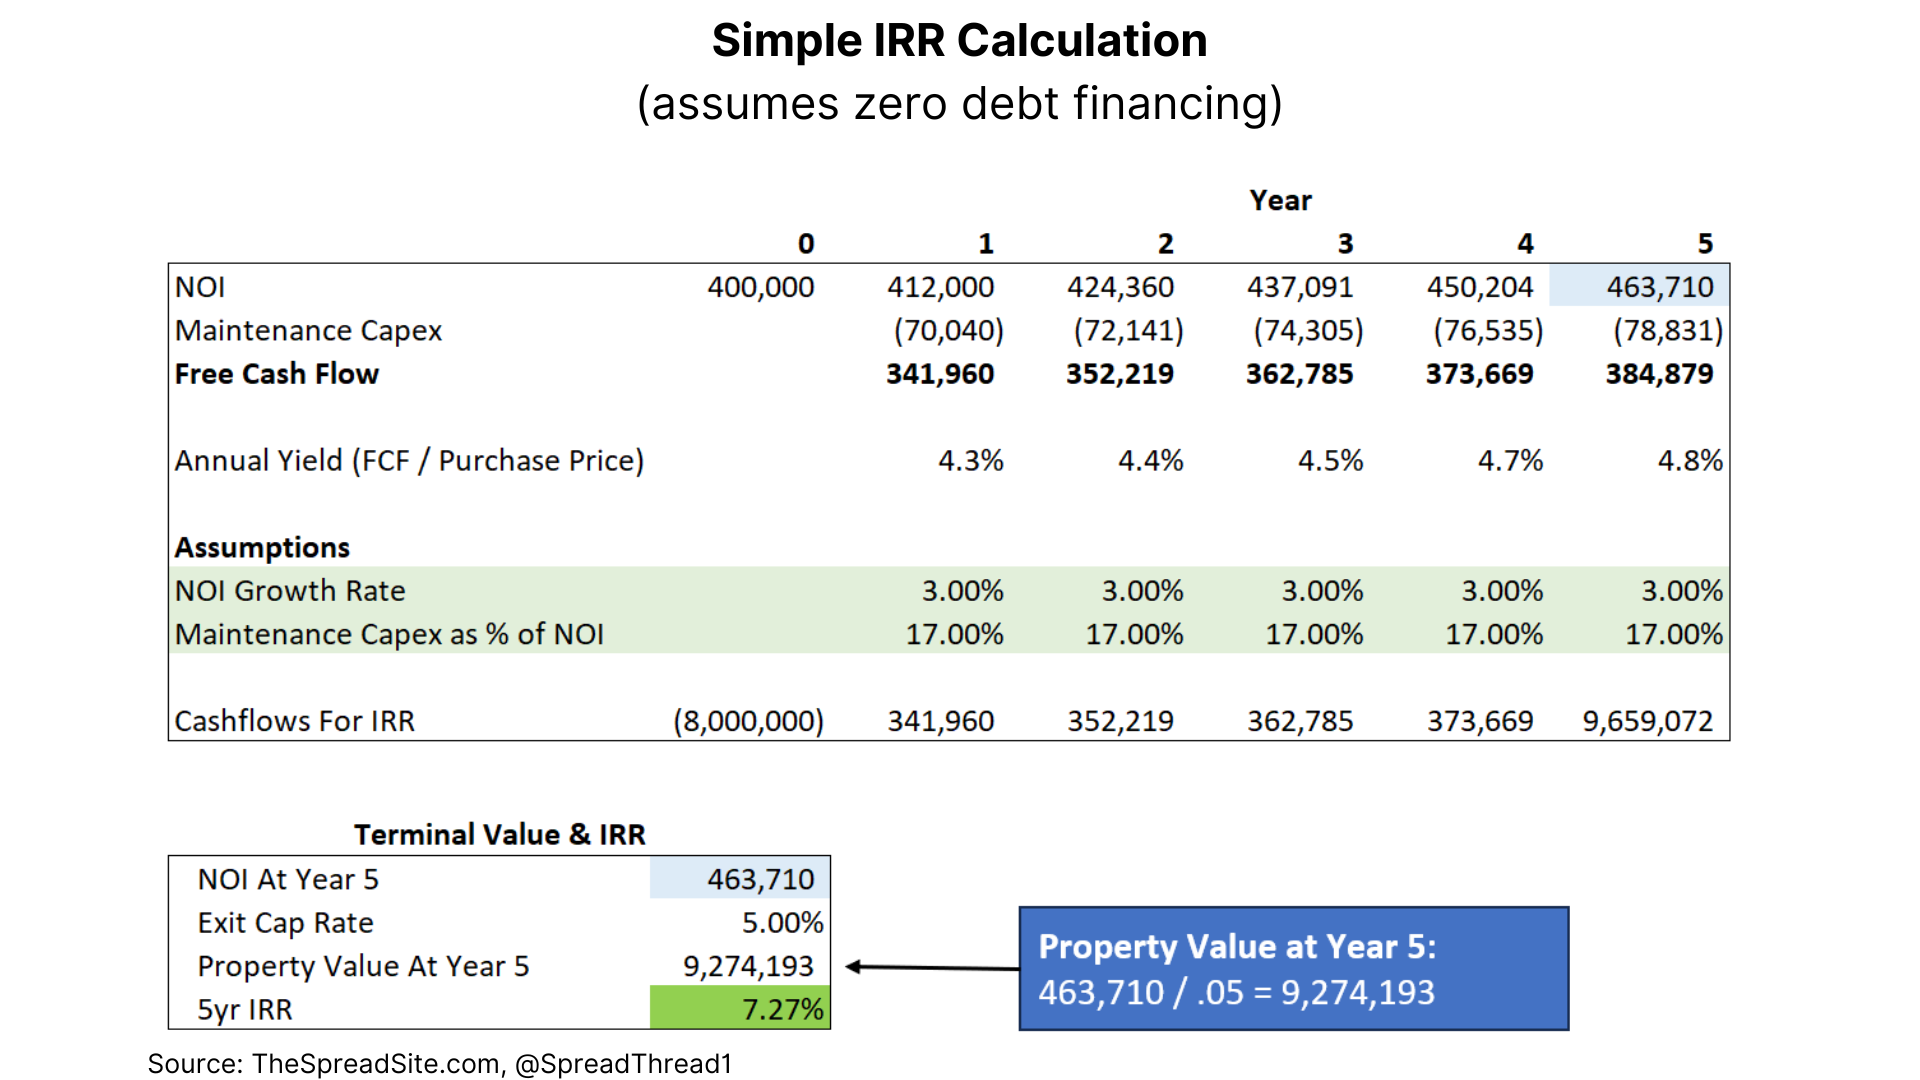
The shorthand return calculation we show above is a useful way to take a Cap Rate and estimate a return. It also gets very close to an IRR calculation, which we show below. In this example (using a 3% NOI growth assumption), we assume the property is purchased without any debt financing, a $400k NOI and a 5% Cap Rate. At the end of a five-year holding period, the property is sold at a 5% Cap Rate. The resulting IRR is 7.27%, which is very close to the 7.15% shorthand calculation shown above.
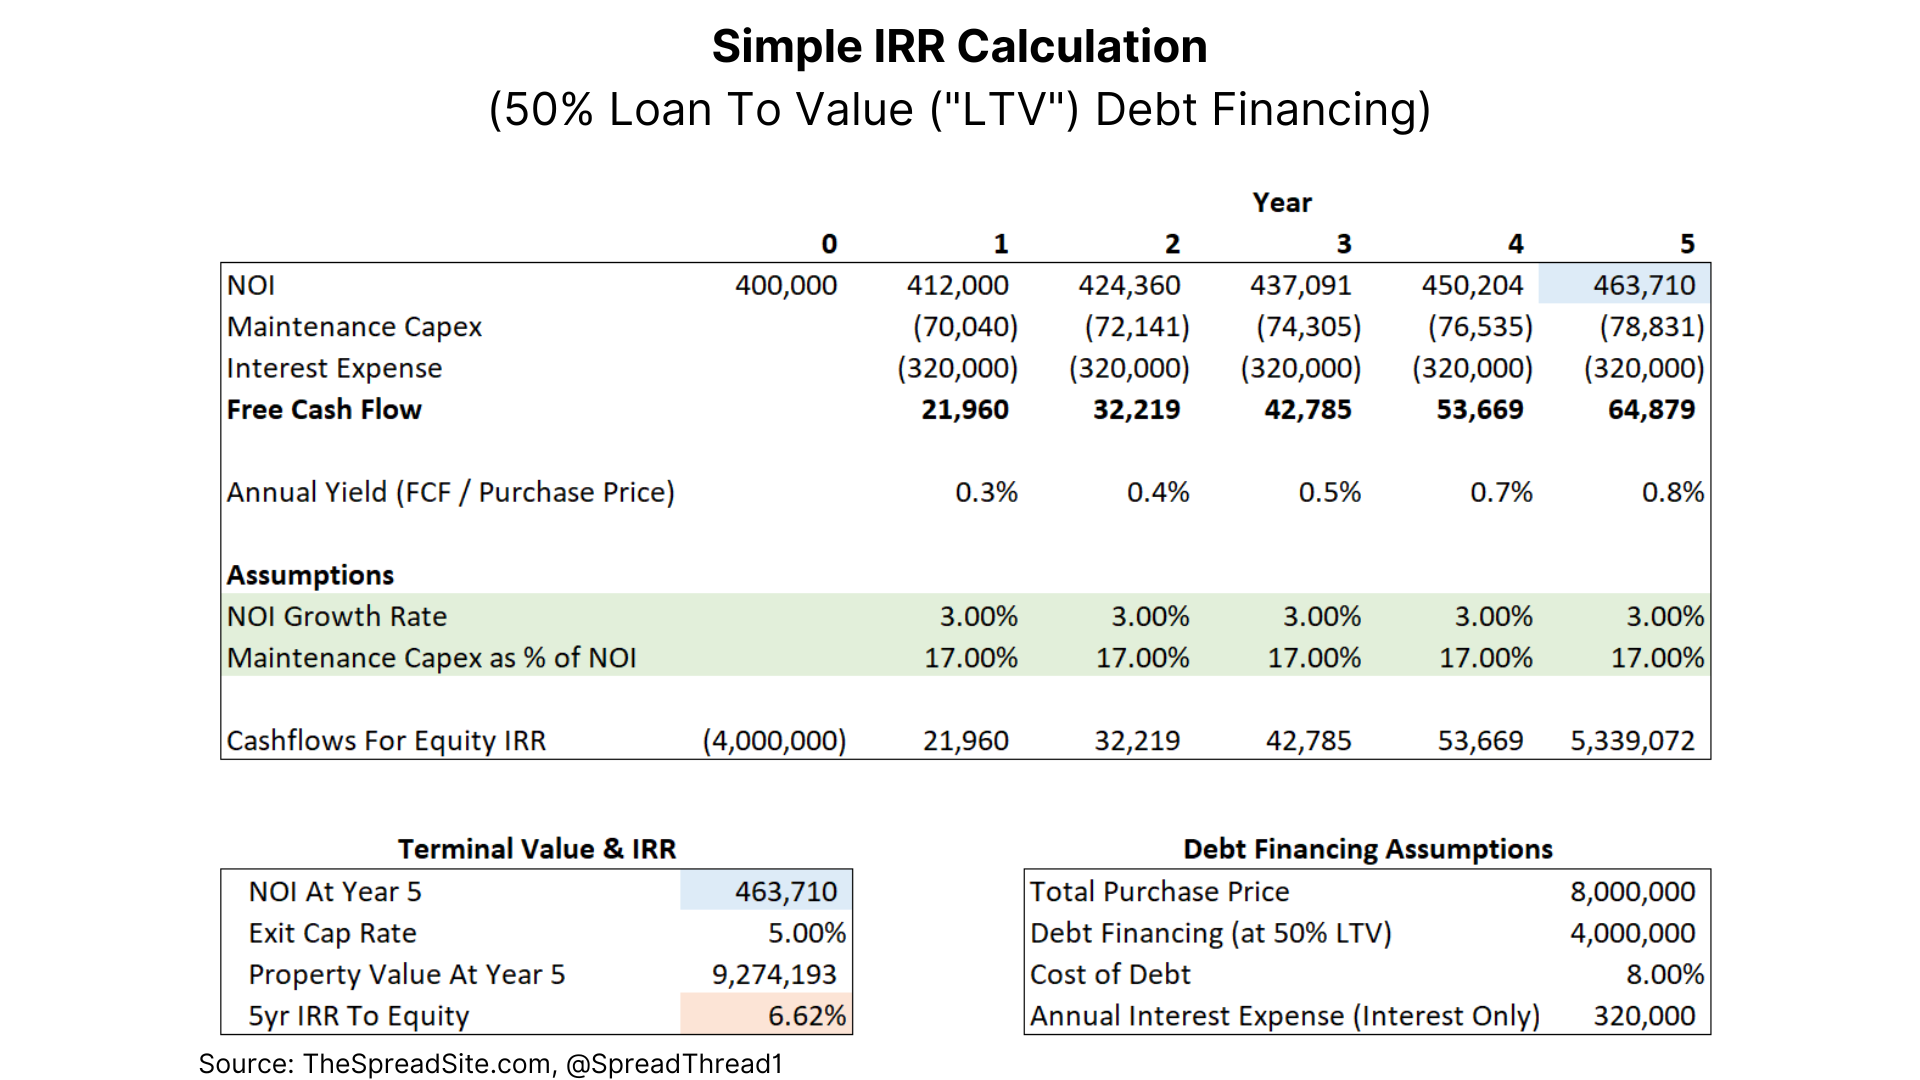
Our example above assumes zero debt financing. However, a major problem impacting real estate investors currently is “negative leverage” whereby the cost of debt financing is above the Cap Rate. In the example below, we show the impact of borrowing at 8.0% to finance 50% of the purchase price. Historically, leverage would help equity returns, but in this simple example the IRR goes from 7.27% down to 6.62% and free cash flow becomes almost non-existent.
Our IRR examples are static in terms of rent growth and margin. Often investors look to add value to properties they purchase and describe the Cap Rate when the property is acquired as the “Going In Cap Rate.” This simply means the investor expects to increase the NOI through margin improvement, rent price increases, or a combination. And if sucessful, an investor can typically sell an improved property for a lower Cap Rate (or higher multiple) as compared to the Cap Rate when initially purchased.
What Is The "Right" Cap Rate?
Unfortunately, there is no correct answer here. Many assumptions go into where Cap Rates 'should' be across sectors and companies. Macro factors such as economic growth, supply/demand within a sector or geographic market, and credit spreads all play a role.
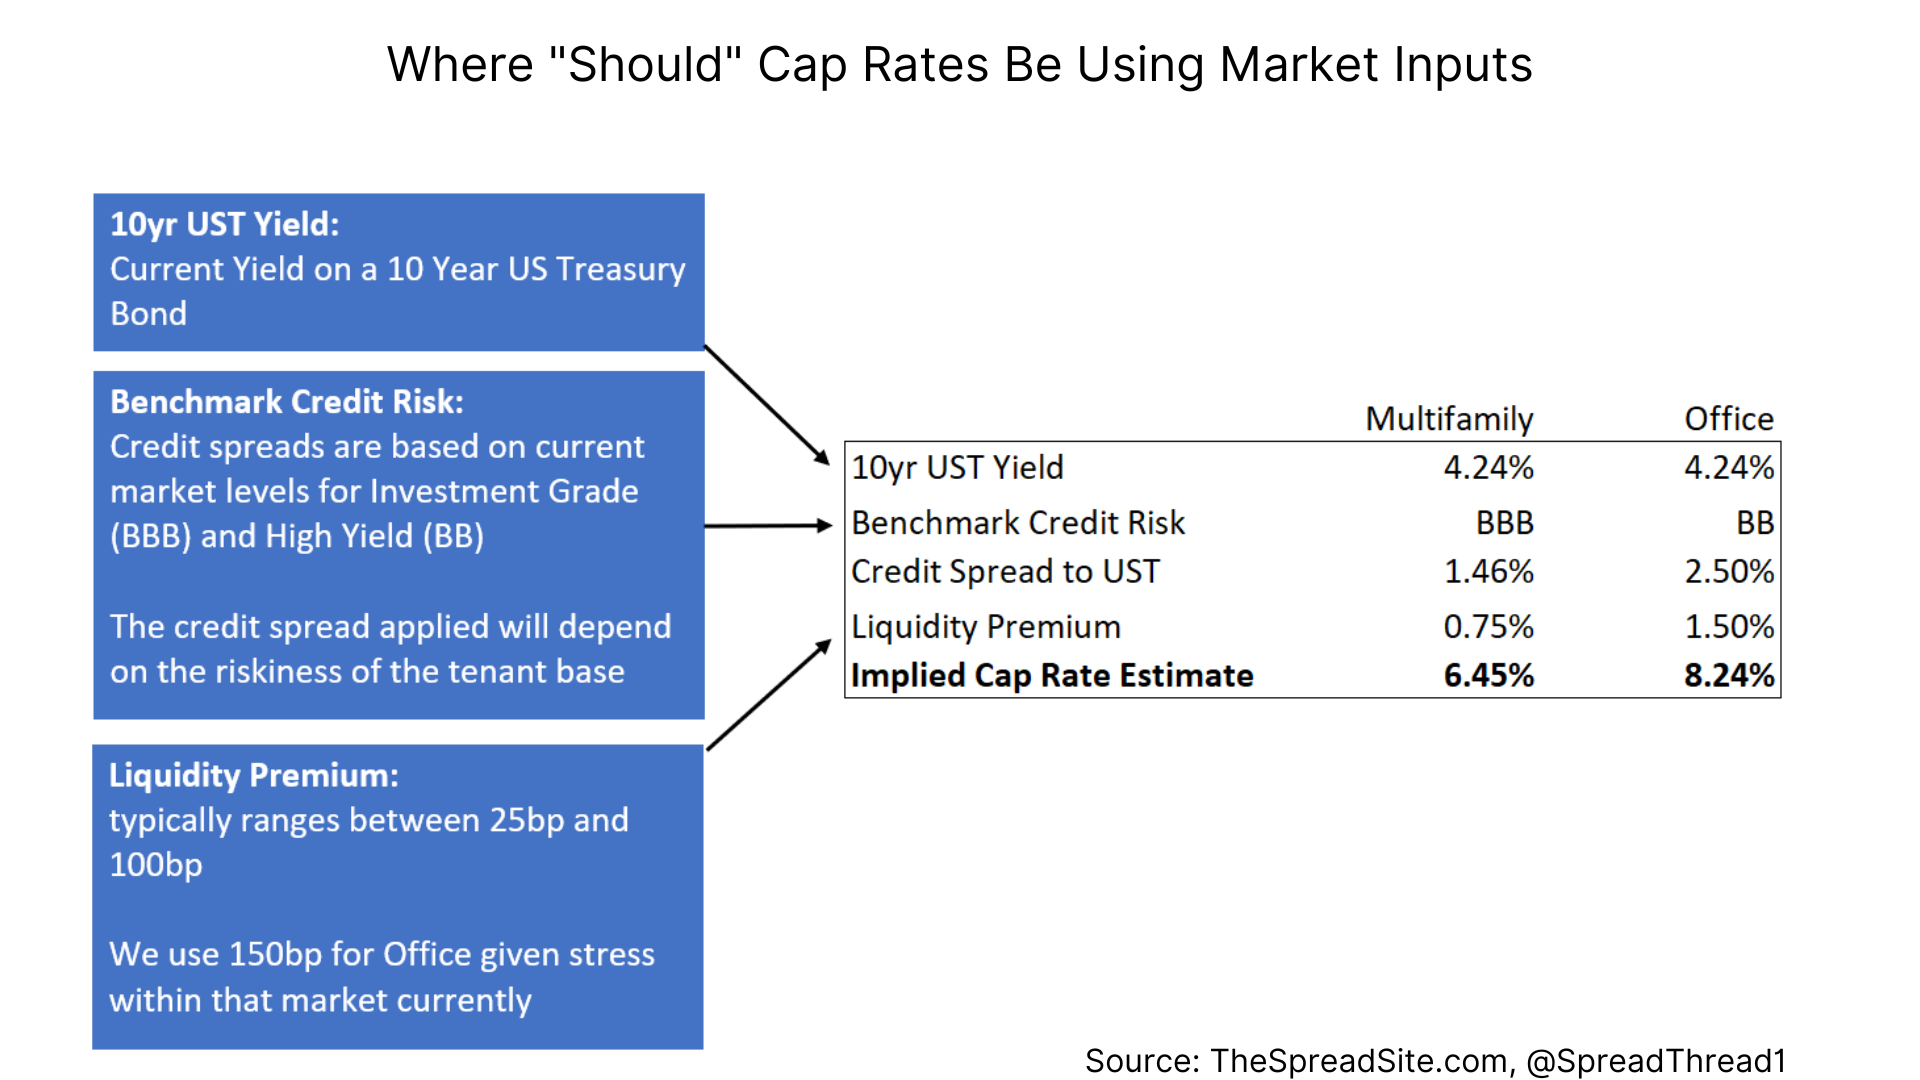
We can, however, use market inputs to put goalposts around Cap Rates. In the example below, we use market yields as a starting point for where Cap Rates 'should' be for two different sectors, multifamily and office. As you can see, the two variables include a credit spread and a liquidity premium (the 10yr UST Yield is simply an input at a spot price).
The higher quality your base of tenants, the lower the credit spread, typically. Historically, if an office property had long-term leases with a blue-chip roster of companies as lessees, the assumed credit spread (or riskiness of the property’s cash flows) was very low. Given the turmoil within the office sector, this is no longer the case for most buildings.
Multifamily was historically seen as riskier than high quality office as tenants typically have one-year leases and they can be broken easier than an office tenant.
However, in the current market environment this has flipped with more risk and less liquidity within office.
We are not saying the credit spreads or liquidity premiums above are definitely correct - this is just an example to show how they impact a market implied Cap Rate.
Going one step further, if we want to use the market implied Cap Rates to estimate long-term returns, we can do so using the short hand return calculation discussed above.

These shorthand measures provide some goalposts on where cap rates 'should' be, and will vary depending on individual assumptions.
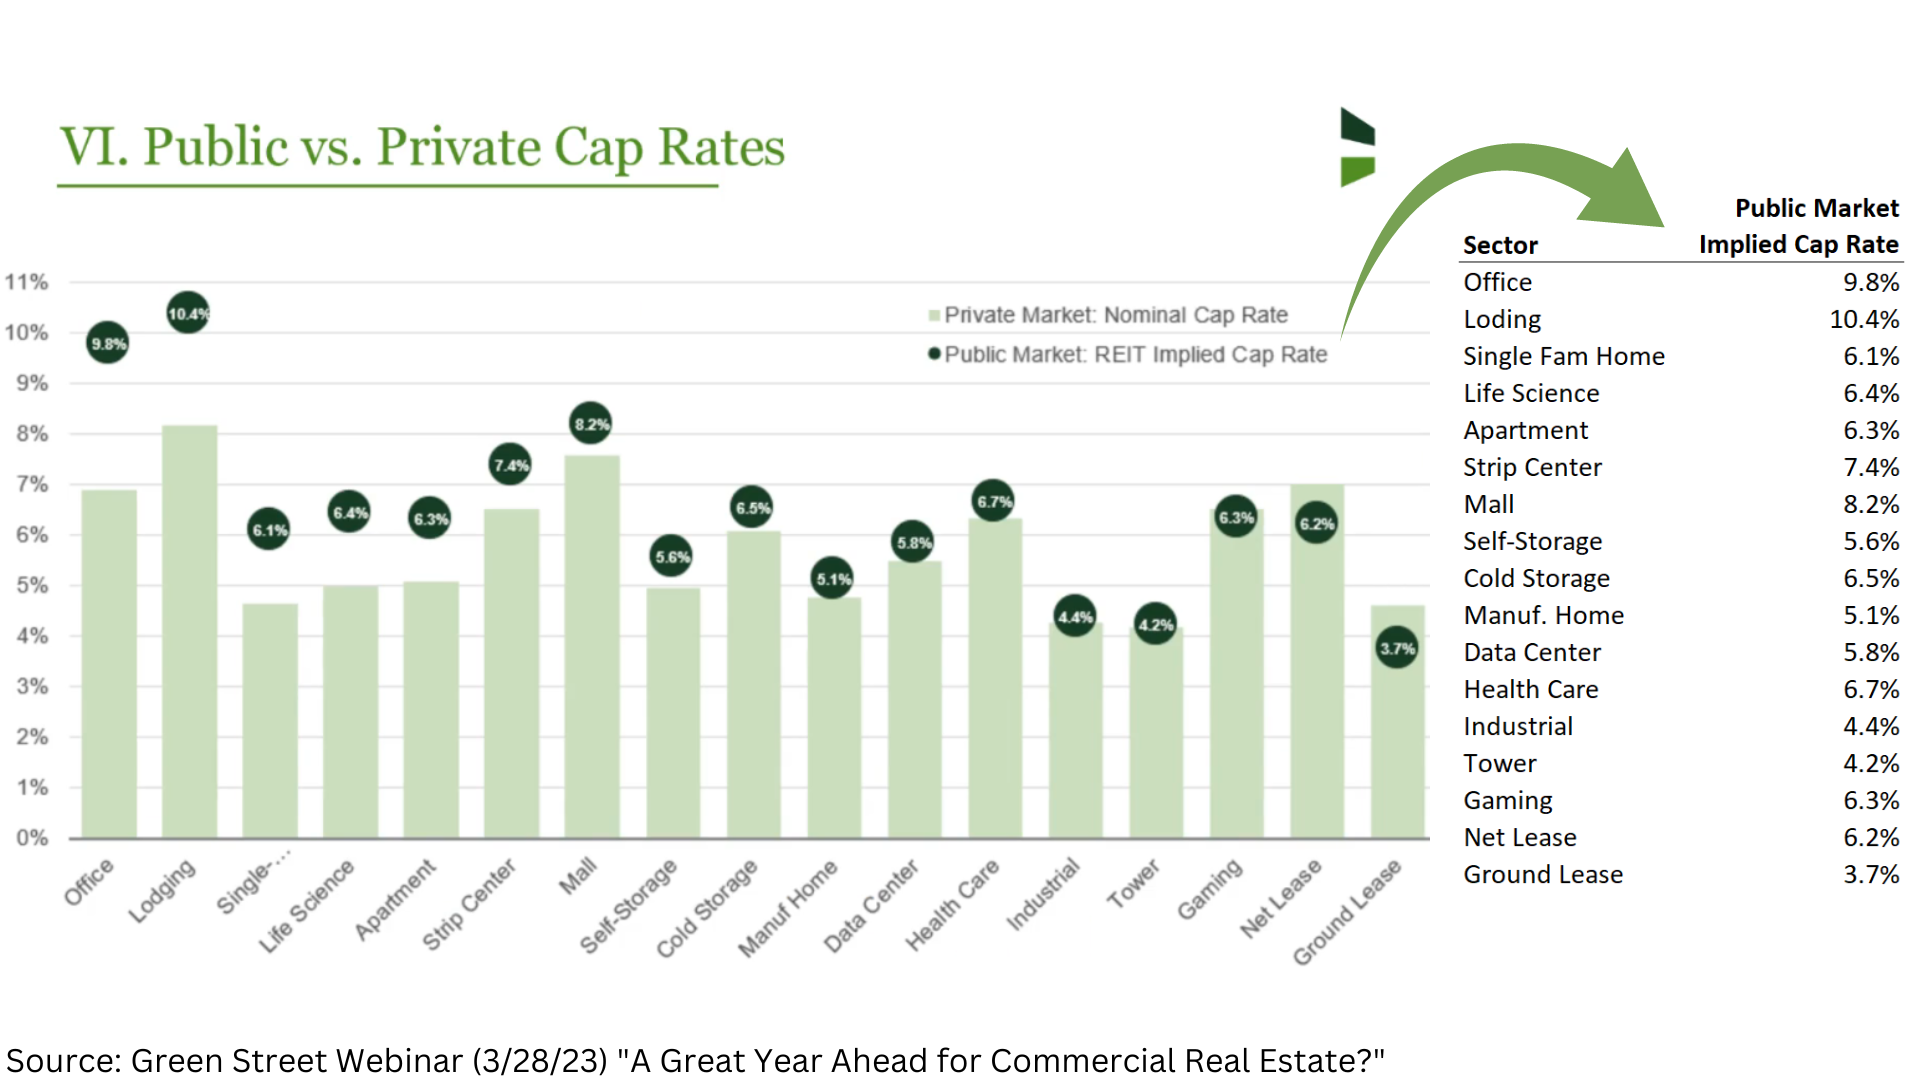
But public and private market Cap Rates can diverge from these values. As we show below, these are Cap Rate estimates for public and private real estate assets by sector from Green Street Advisors. As you can see, Cap Rates for the publicly traded office sector are above the market implied level whereas the private market for office is significantly below.
So, while there will never be a ‘right’ Cap Rate, there are specific variables that can be analyzed when figuring out whether Cap Rates are rich or cheap. And these inputs can help determinate an appropriate price to pay for a real estate asset and the estimated long-term return.
Appendix
Calculating Cap Rates for Publicly-Listed REITs
This is another area where opinions and calculations vary significantly. Some market participants choose to look at last twelve months (“LTM”) NOI as their numerator, while others like to use a forward estimate of NOI. We prefer to show both.
In terms of the denominator (Property Value), there is more nuance. Simplistically, the property value would be Enterprise Value (market cap + debt outstanding + preferred stock – cash). However, REITs frequently have joint ventures, undeveloped land, and properties being developed that need to be included.
Our preferred method is to value all joint ventures, undeveloped land and development separately and include this category as an asset that increases Enterprise Value. And this value is at the company’s ownership share.
Additionally, we must account for any liabilities associated with these assets. This amount, also at the company’s ownership share is included as a liability and reduces enterprise value. We show an example below for Essex Property Trust (“ESS”).
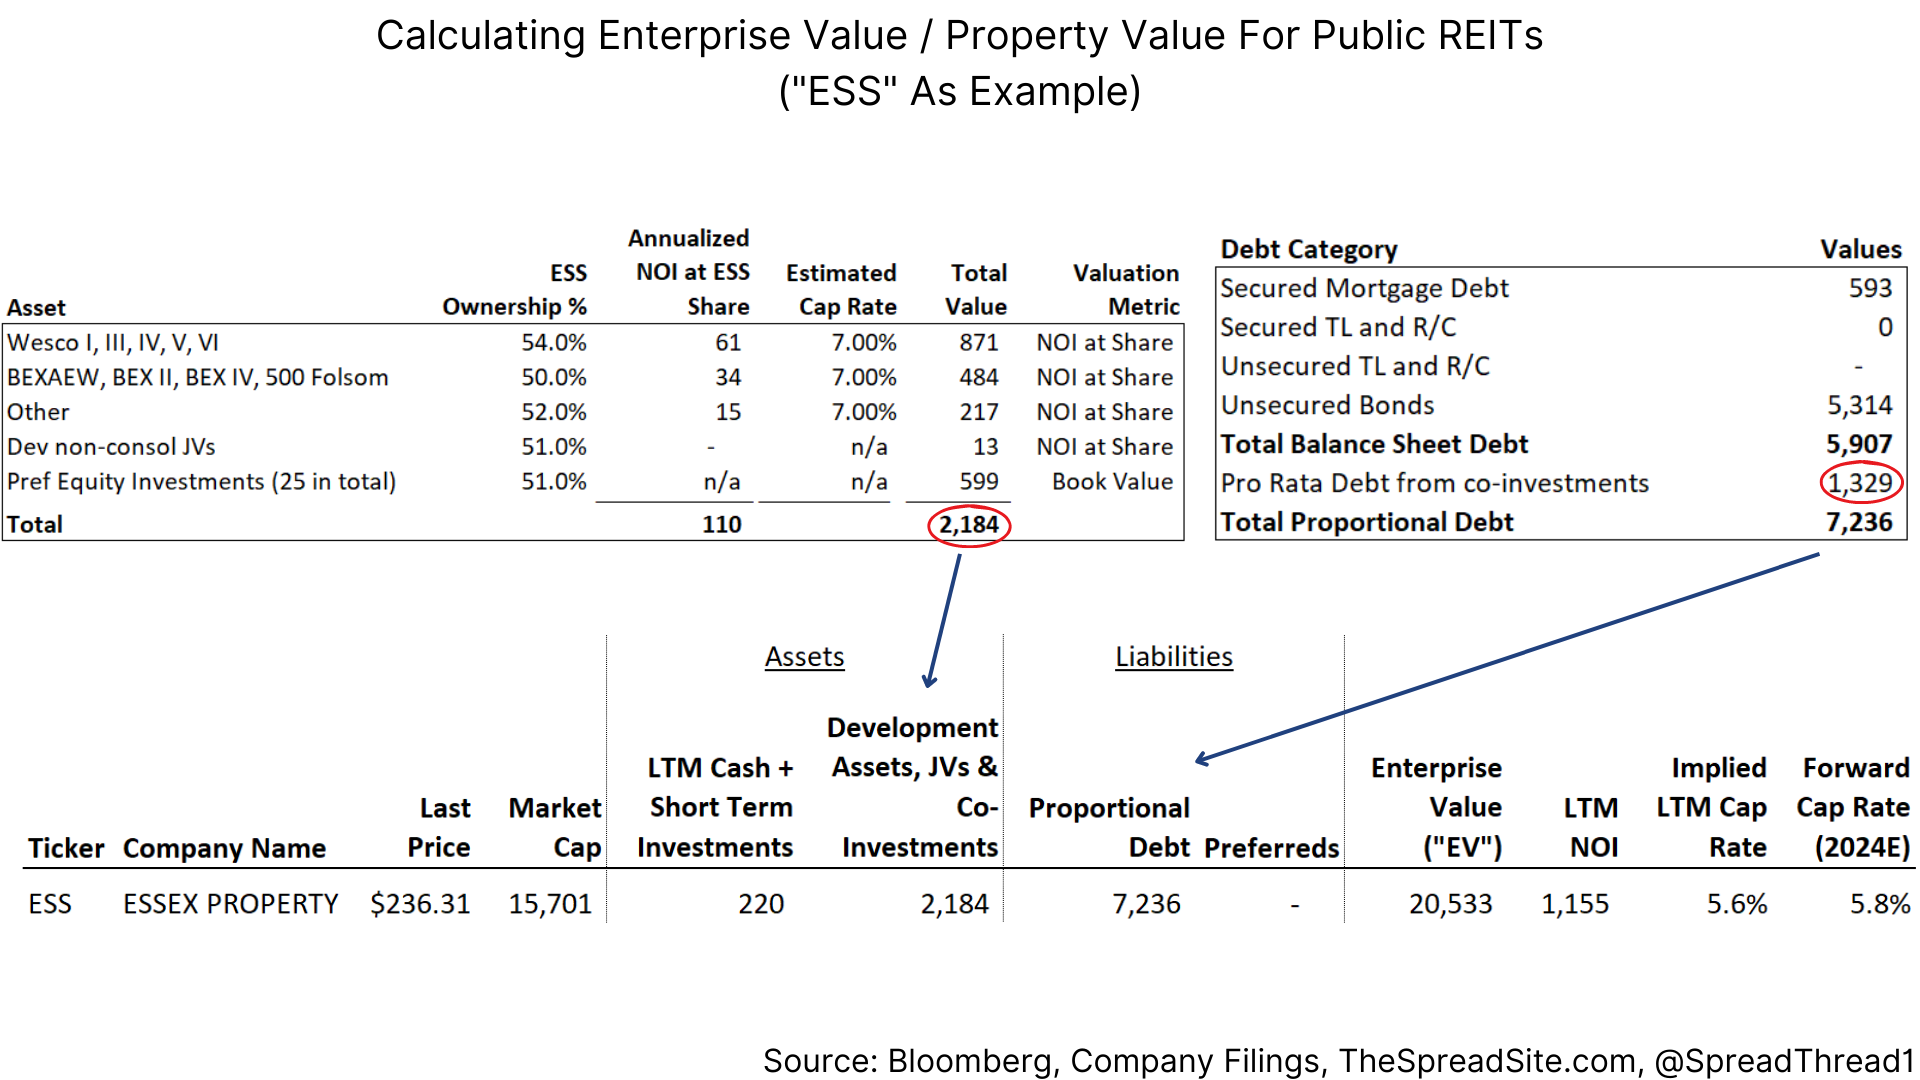
As you can see, the Cap Rate using LTM NOI is 5.8% and calculated as 1,155 / 20,533. And the 20,533 is calculated as (15,701 + 7,236 - 220 - 2,184).
Excluding the assets and liabilities that would not show up from using a straight enterprise value calculation (market cap + debt + preferreds – cash) would leave out $855mm of net value (2,184 – 1,329).
Most REITs provide excellent disclosure on these values. The data for “ESS” can be found on their website. The debt from co-investments is found in the 1Q23 investor presentation, while the asset values are found in the 1Q23 supplement.
The Spread Site Research
Receive our latest publications directly to your inbox. Its Free!.


