Classifying Closed End Funds
Introduction
Closed End Funds (“CEFs”) offer investors different ways to take advantage of the recent rise in interest rates, especially as Net Asset Value ("NAV") discounts widen. We recently published a primer on CEFs (Closed End Funds: An Overview, Risks and Opportunities) for those looking to learn more about these investment vehicles.
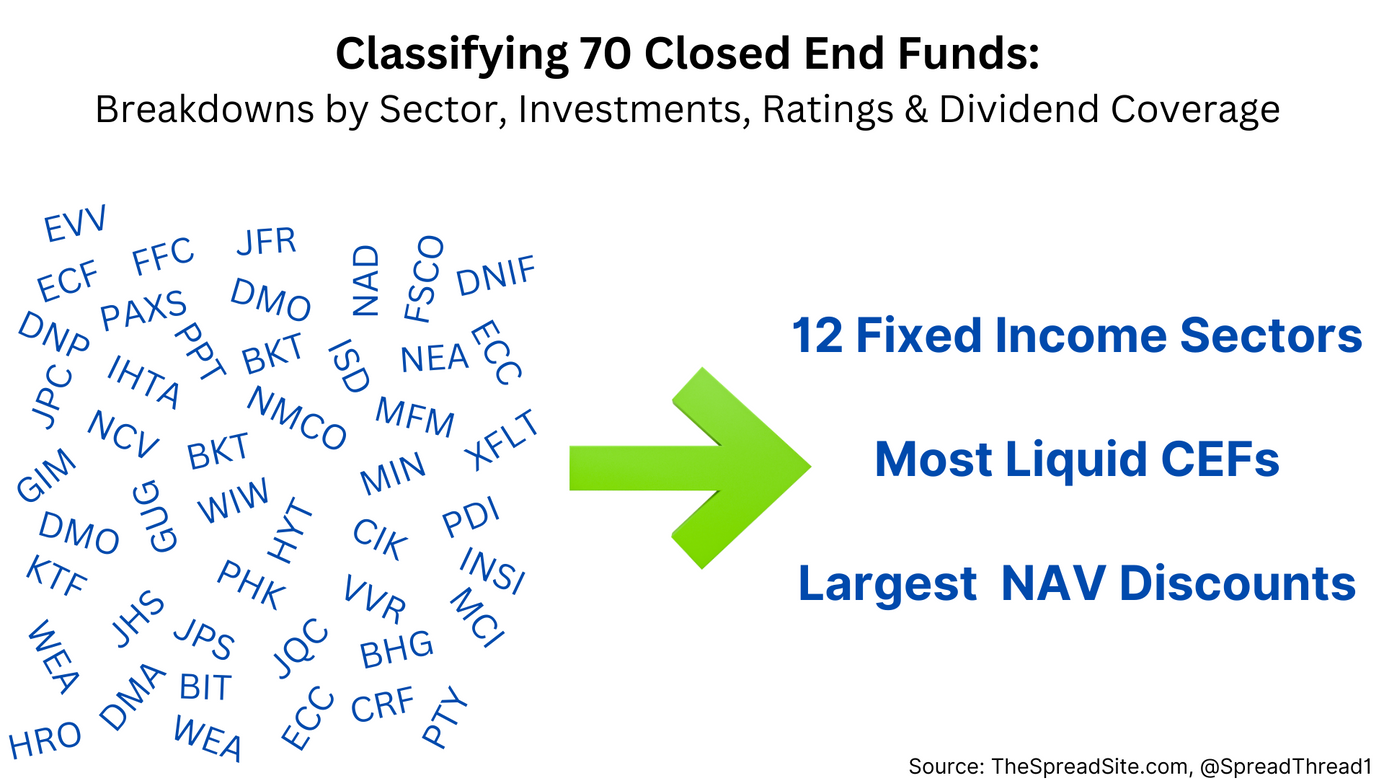
In this week’s note, we build on this analysis and show liquid and/or relatively cheap CEFs across 12 fixed income asset classes. Hopefully, these details are helpful as it is not always clear what a CEF actually owns based on its name and sector classification. Our analysis shows holdings, ratings, leverage and dividend coverage for each. As discussed in our primer, dividend coverage and cost of leverage are important variables in determining whether a CEF risks a future dividend cut.
Our focus is primarily on CEFs owning fixed income assets. However, at the end of this post we also show 5 CEFs trading at the largest PREMIUMs to NAV and 5 CEFs trading at the greatest DISCOUNTs to NAV (with some primarily invested in equities).
Methodology
We start by sorting through ~375 CEFs after filtering out those with trailing 10-day average volume of less than 15k shares and funds specifically pursuing non-US countries. We then categorize the fixed income-focused CEFs into their appropriate sector (defined below) and then sort by liquidity and NAV discounts.
Importantly, for each CEF analyzed we manually calculate leverage and dividend coverage from the most recent N-CSR filings and manually sum asset categories and ratings buckets. This is because some sources like CEFConnect and even Bloomberg can get this data wrong. And for pro forma dividend coverage, it is imperative to read the financial statement notes discussing each CEFs' form and cost of leverage.
The 12 fixed income-focused sectors chosen include:
- Convertible Bonds
- High Yield Bonds
- Leveraged Loans
- Private Loans & CLO Investments
- Investment Grade Bonds
- Short Duration Bonds
- Preferred Stocks
- Mixed Credit Allocation
- Government Bonds (USTs and Other Sovereign)
- Investment Grade Municipals
- High Hield Municipals
- Mortgage & Asset Backed
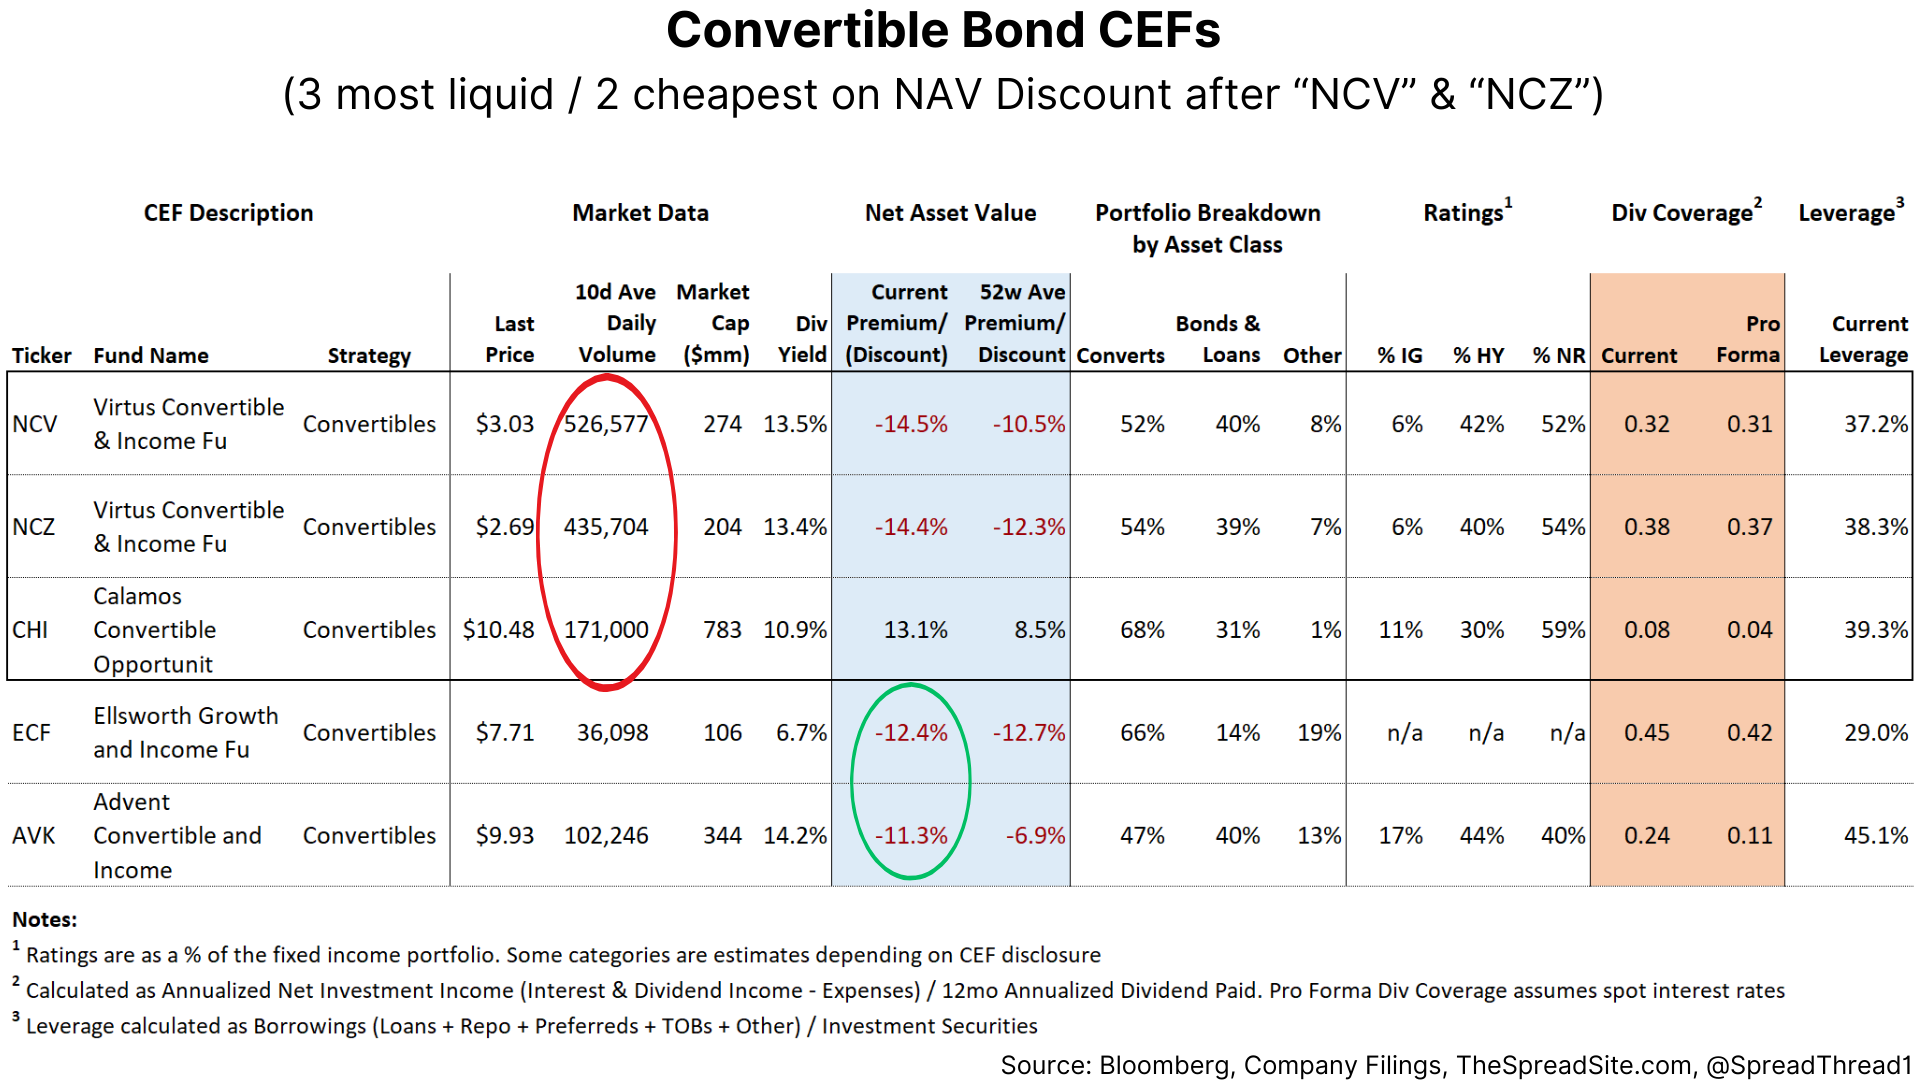
For each fixed income sector we show 5 names. The first 3 are the most liquid as measured by daily trading volume. The next 2 are the cheapest on NAV discount ignoring trading volume.
However, if the most liquid are also cheapest, we skip to the next CEF. As a result, in a few categories names in the bottom 2 will show a smaller NAV discount compared to the 3 most liquid.
As an example, we start with Convertible Bond CEFs. As you can see, the first 3 (red circle) are the most liquid. We then show the 2 cheapest (green circle) after "NCV" and "NCZ".
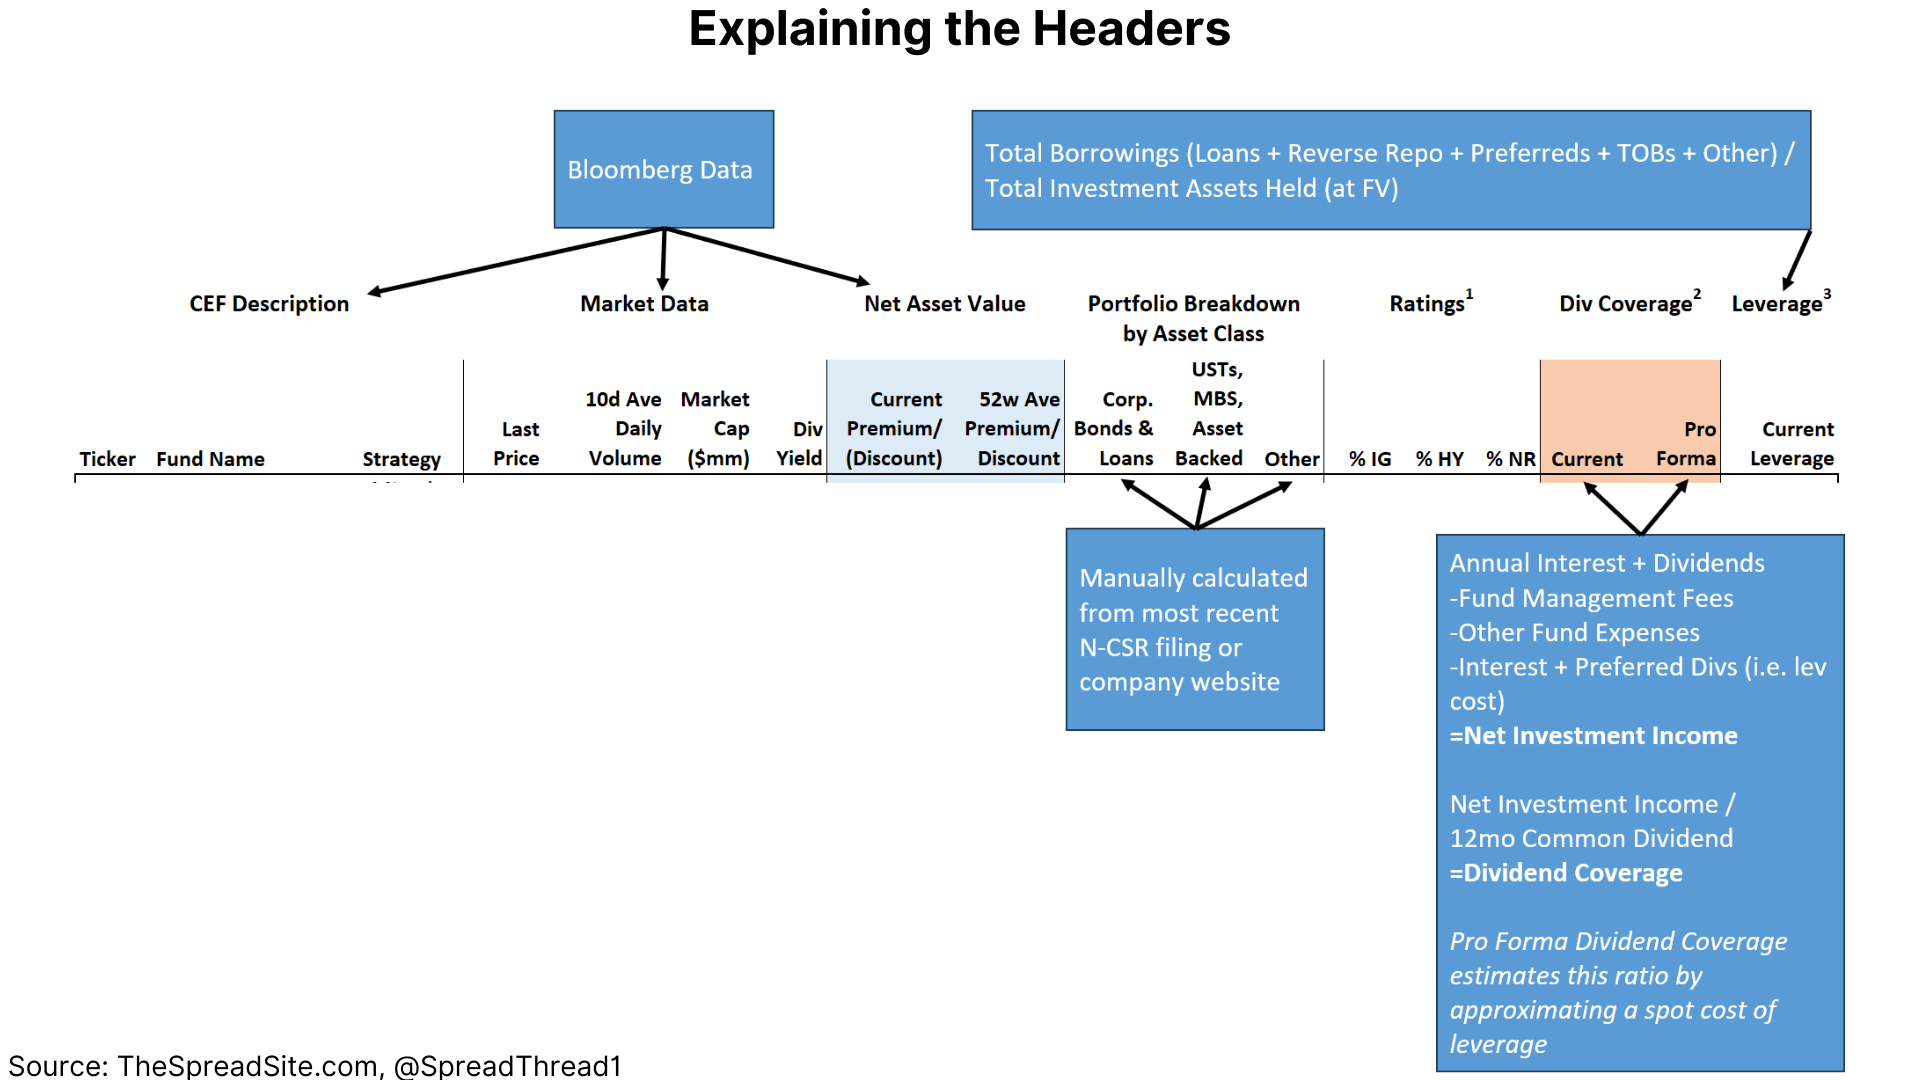
And quickly, below we provide more detail explaing each column in greater detail:
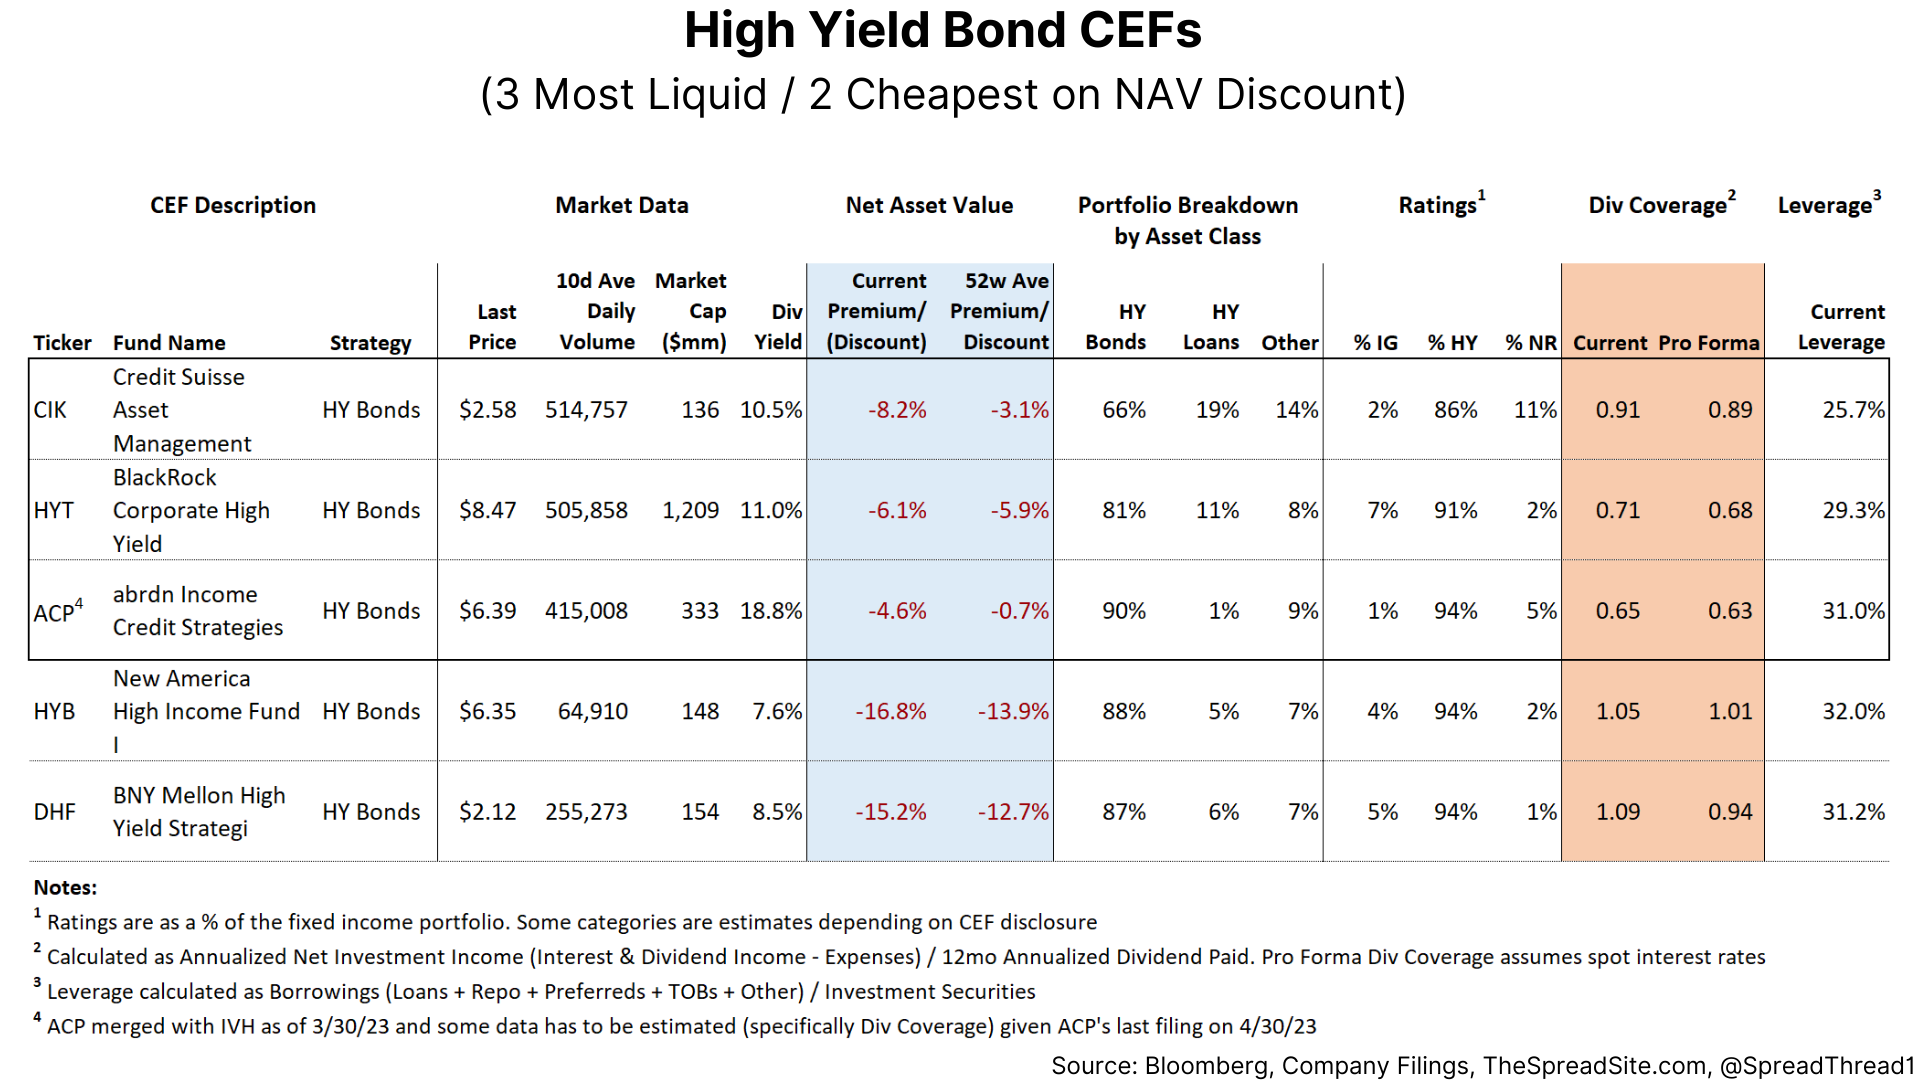
Continuing with our fixed income sectors, the next one is High Yield Bonds, as shown below:
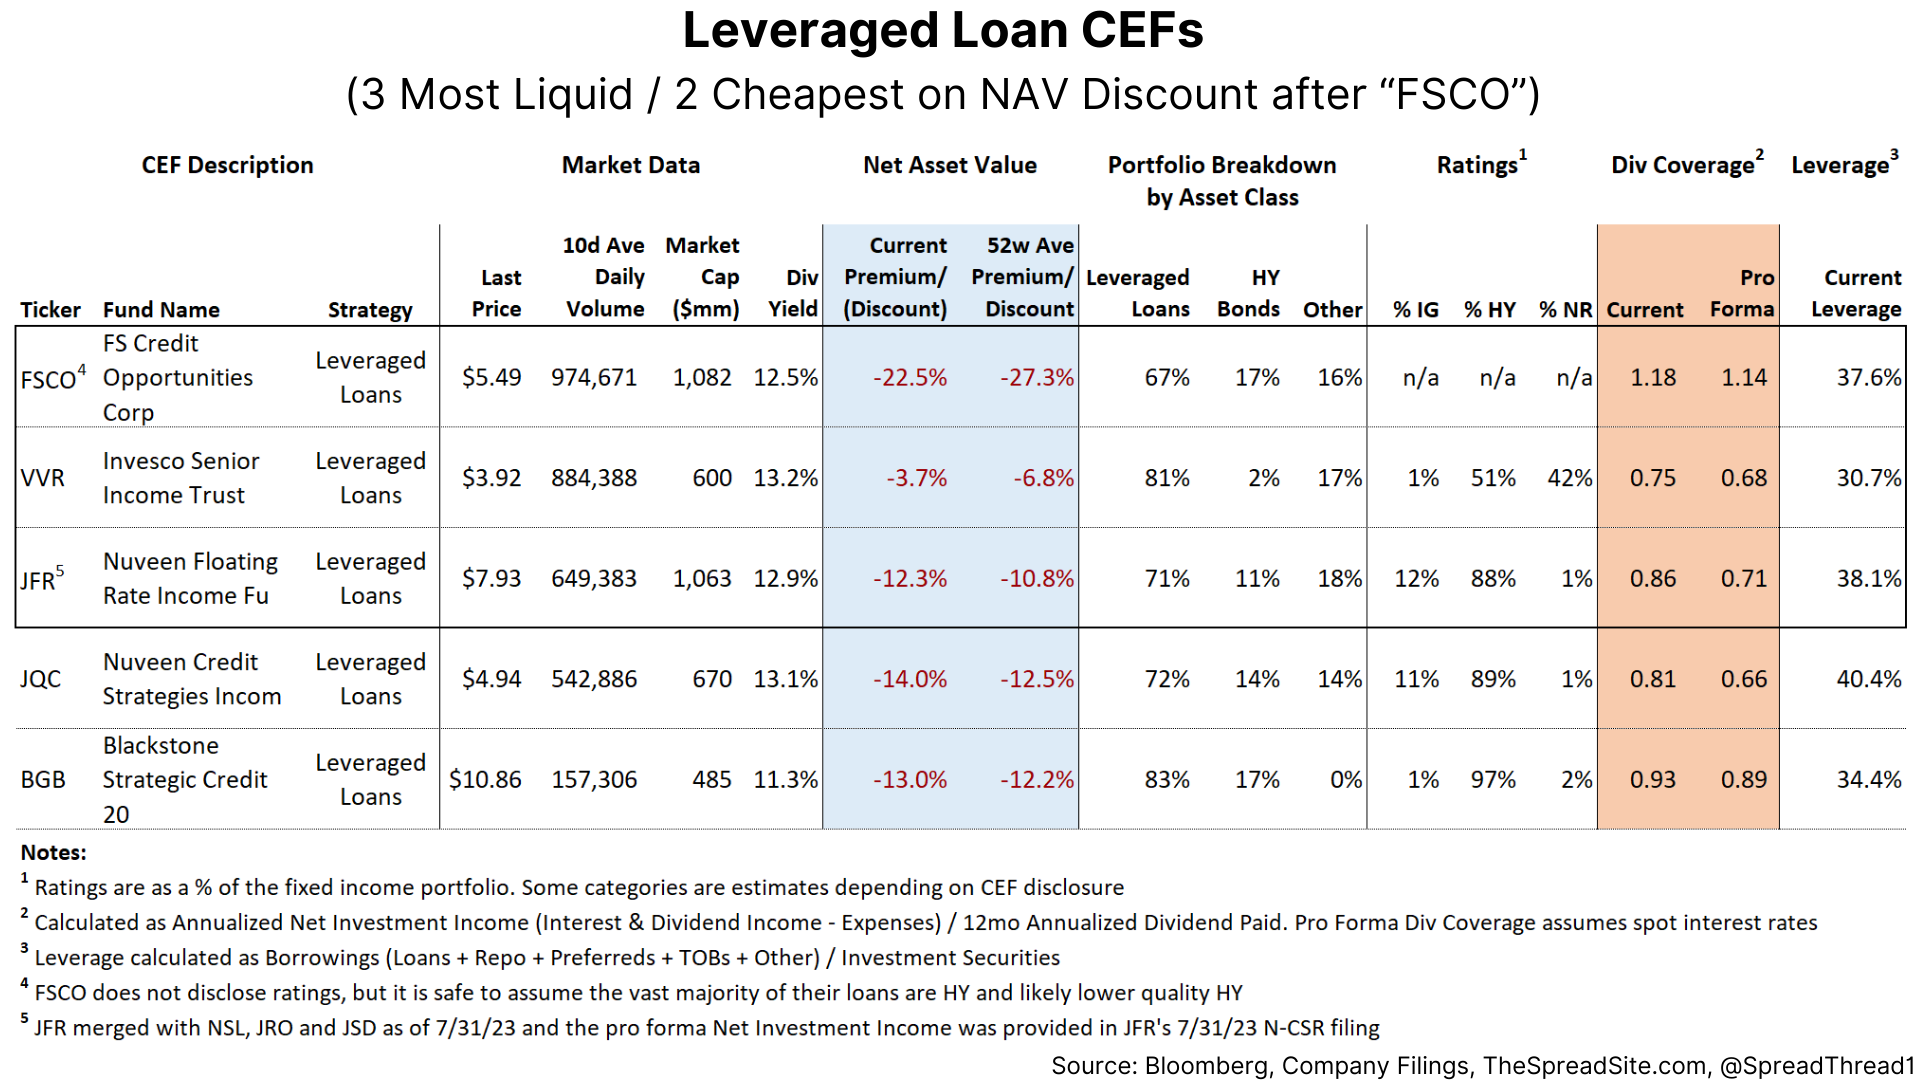
Up next, we show Leveraged Loans with one caveat. Since most of their investments float with higher rates, dividend coverage is likely understated (i.e. we did not flow through higher spot LIBOR/SOFR through each loan held).
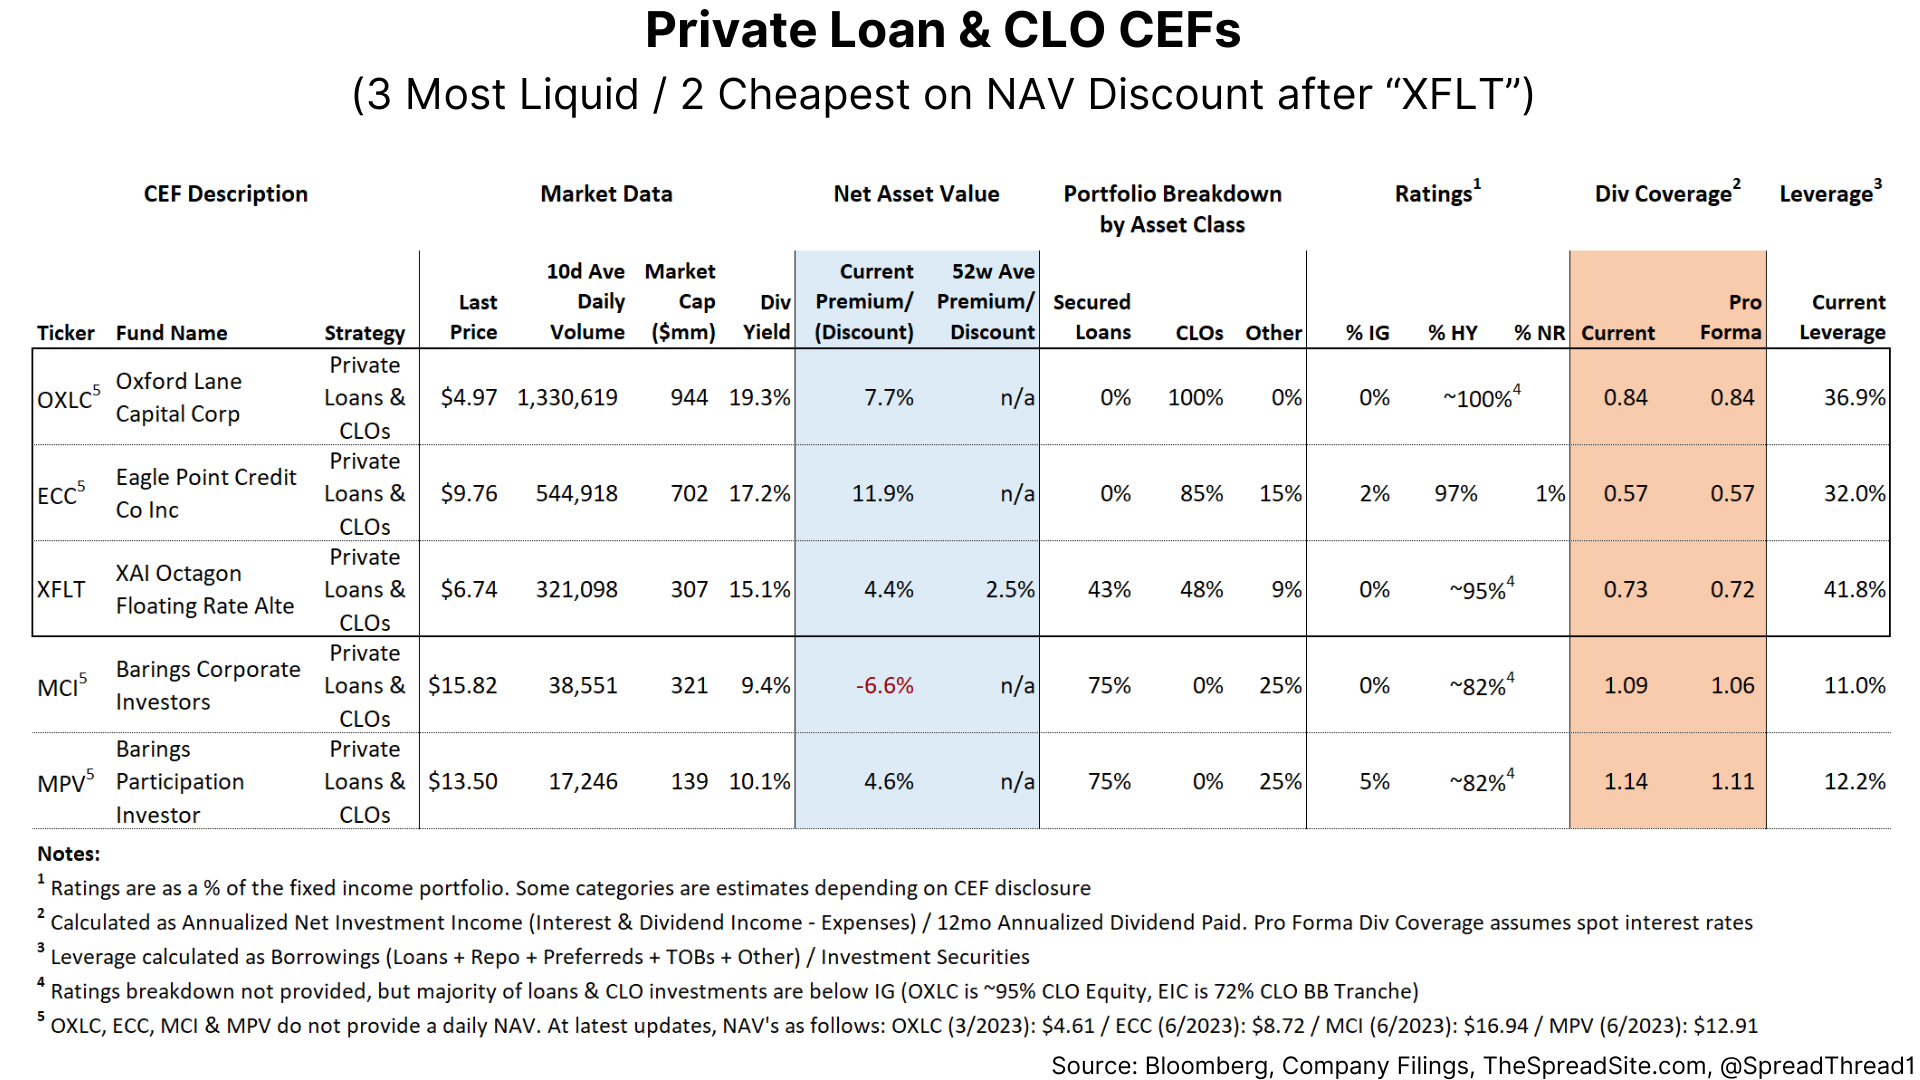
Private Loan & CLO CEFs hold loans similar to investments made by Business Development Companies ("BDCs") and CLO investments can have dramatic differences in credit quality. For example, "OXLC" is ~95% CLO equity.
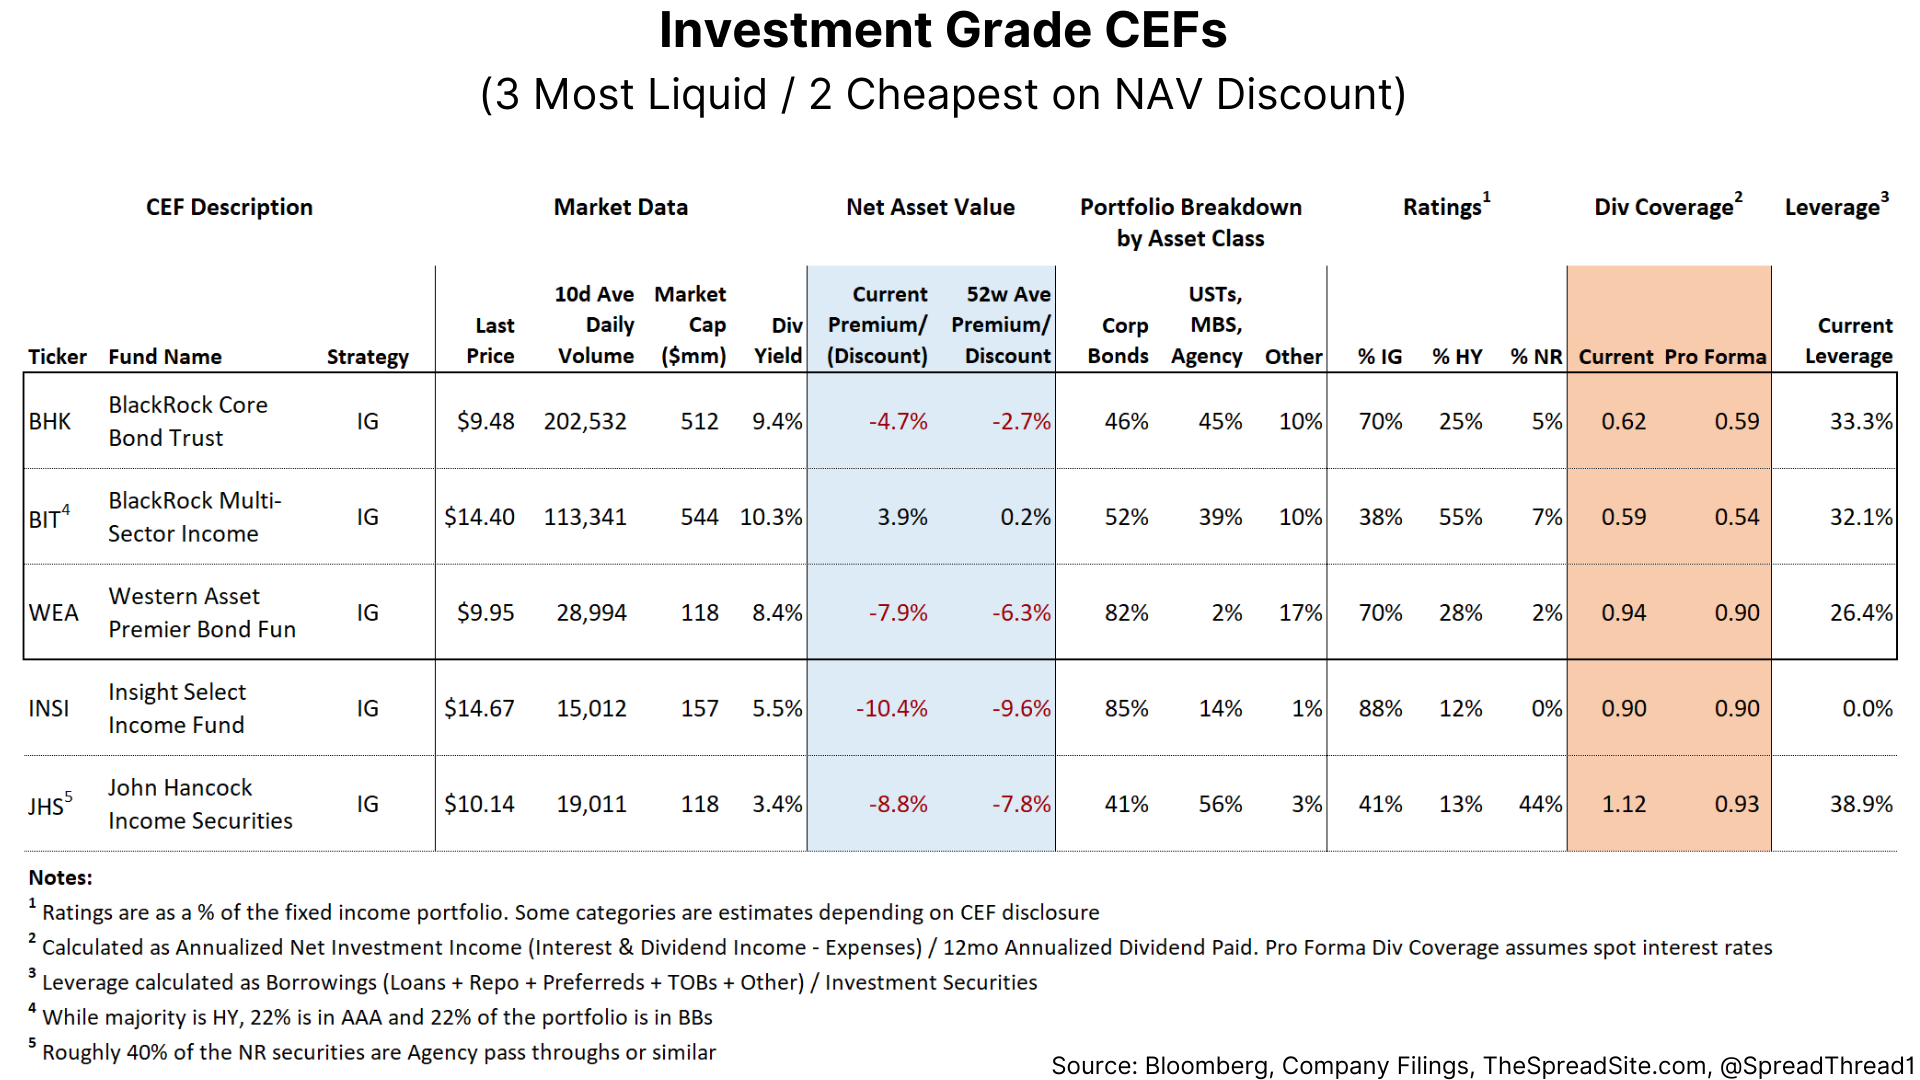
Most Investment Grade bond CEFs hold a mix of corporates, mortgages and USTs. We show this sector below:
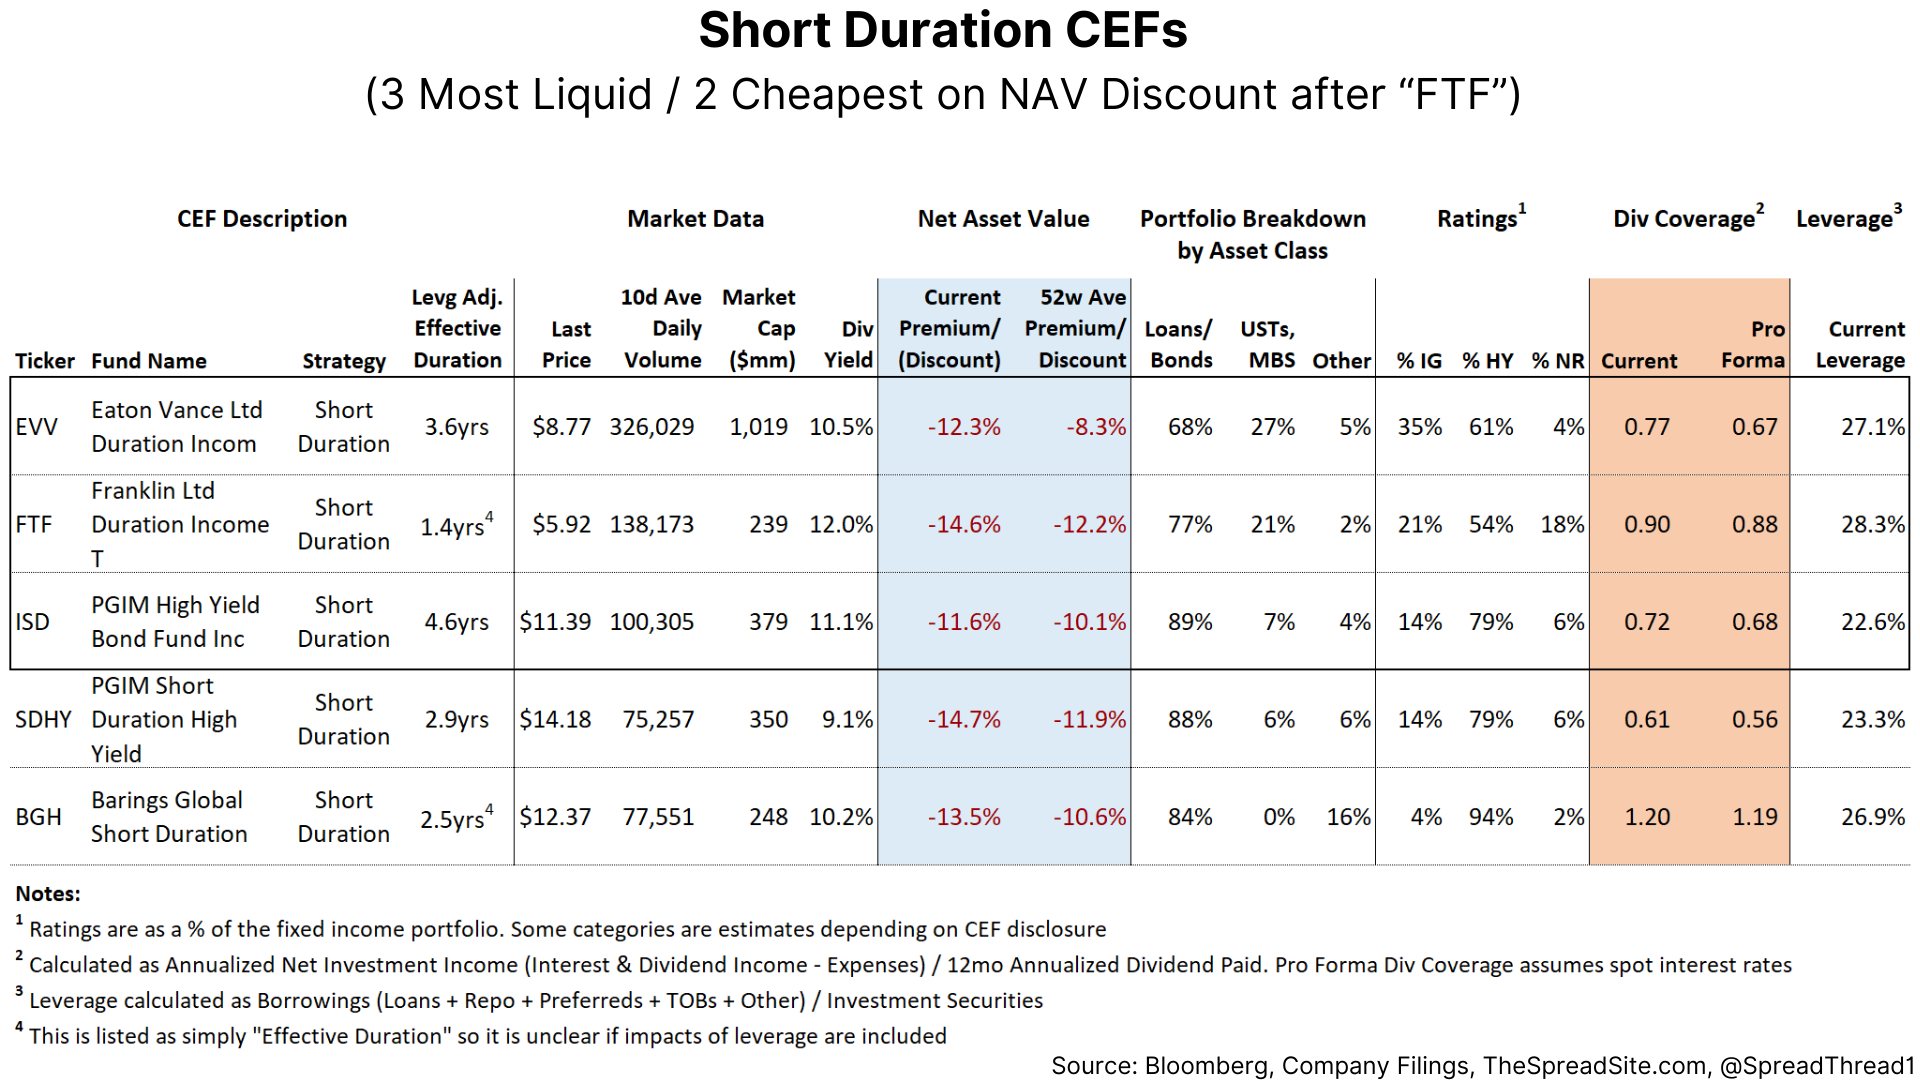
Short Duration CEFs usually hold a lot of high yield. For this sector, we also added a column showing their duration.
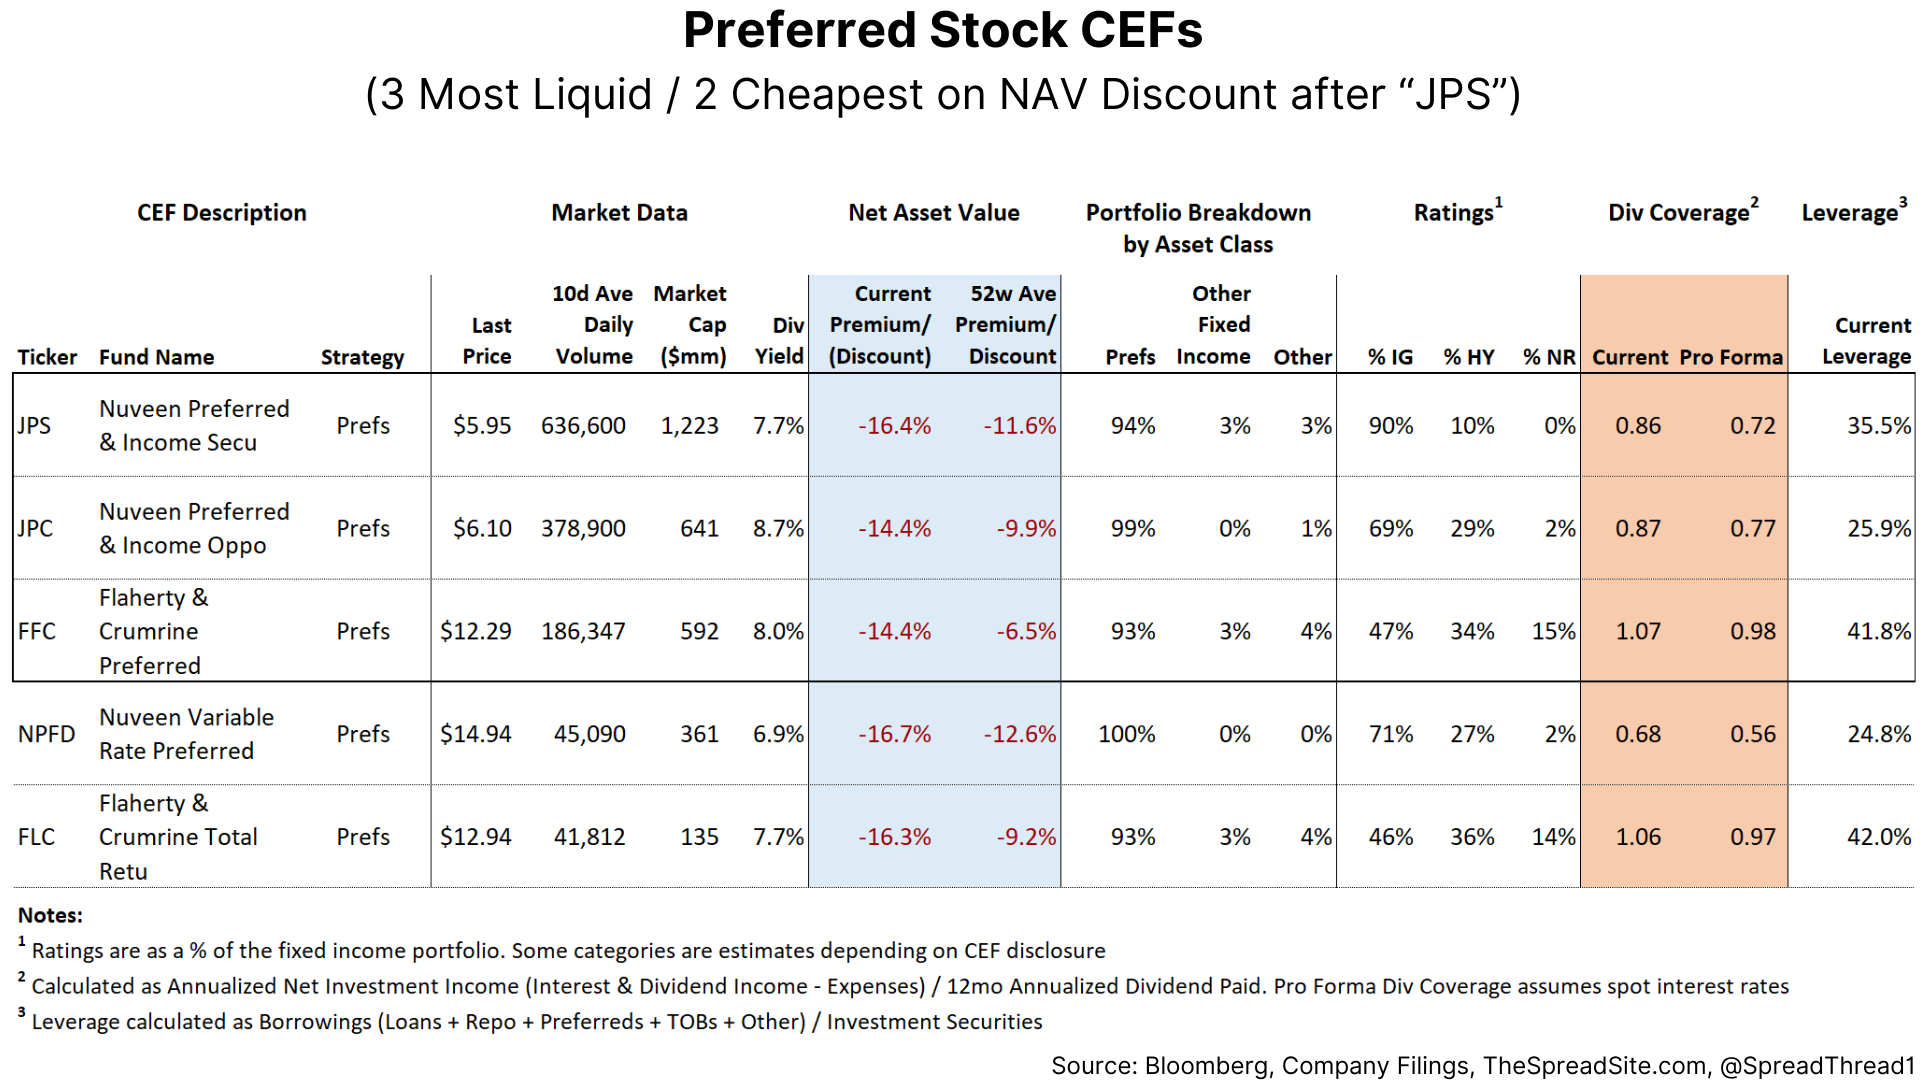
Preferreds is a sector we are watching more closely as discounts are quite wide outright and relative to 52 week averages.
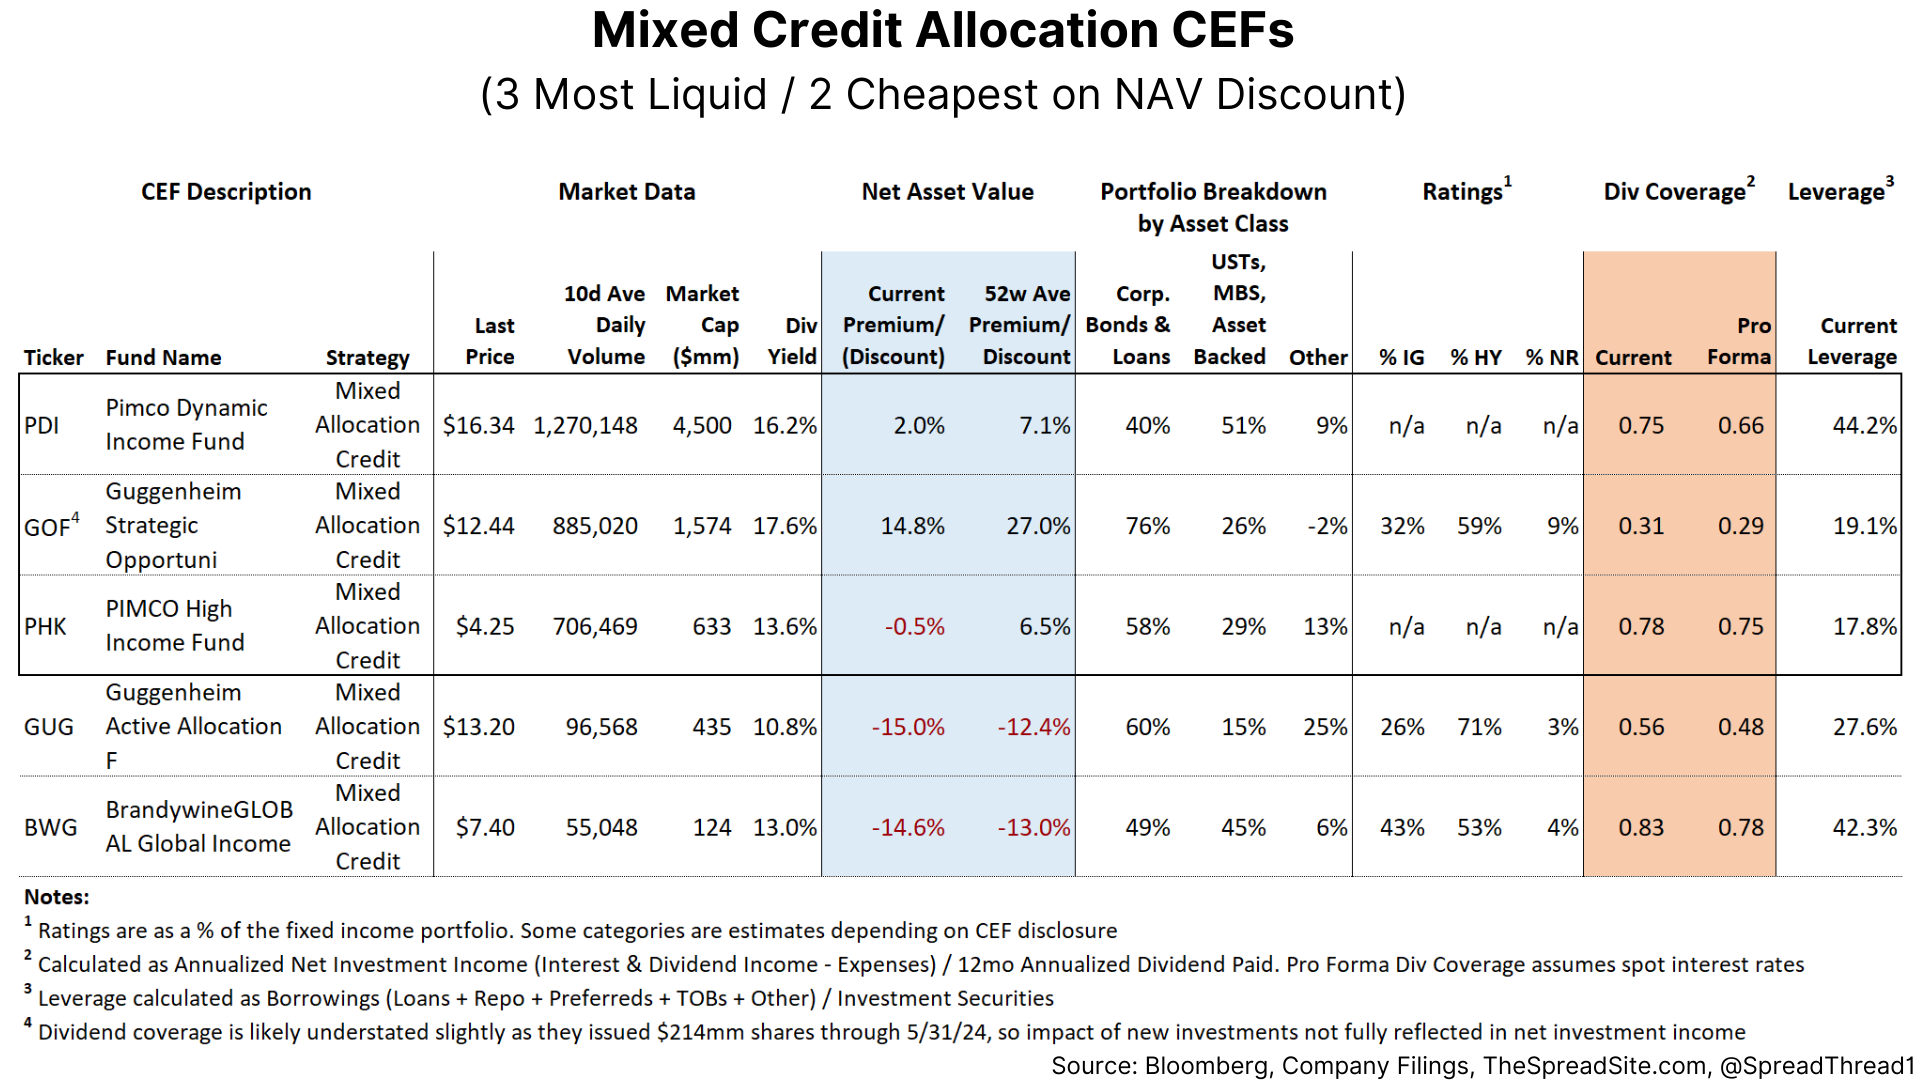
The Mixed Credit Allocation CEFs tend to have a more dynamic fixed income investment approach. Consequently, holdings can change significantly over time.
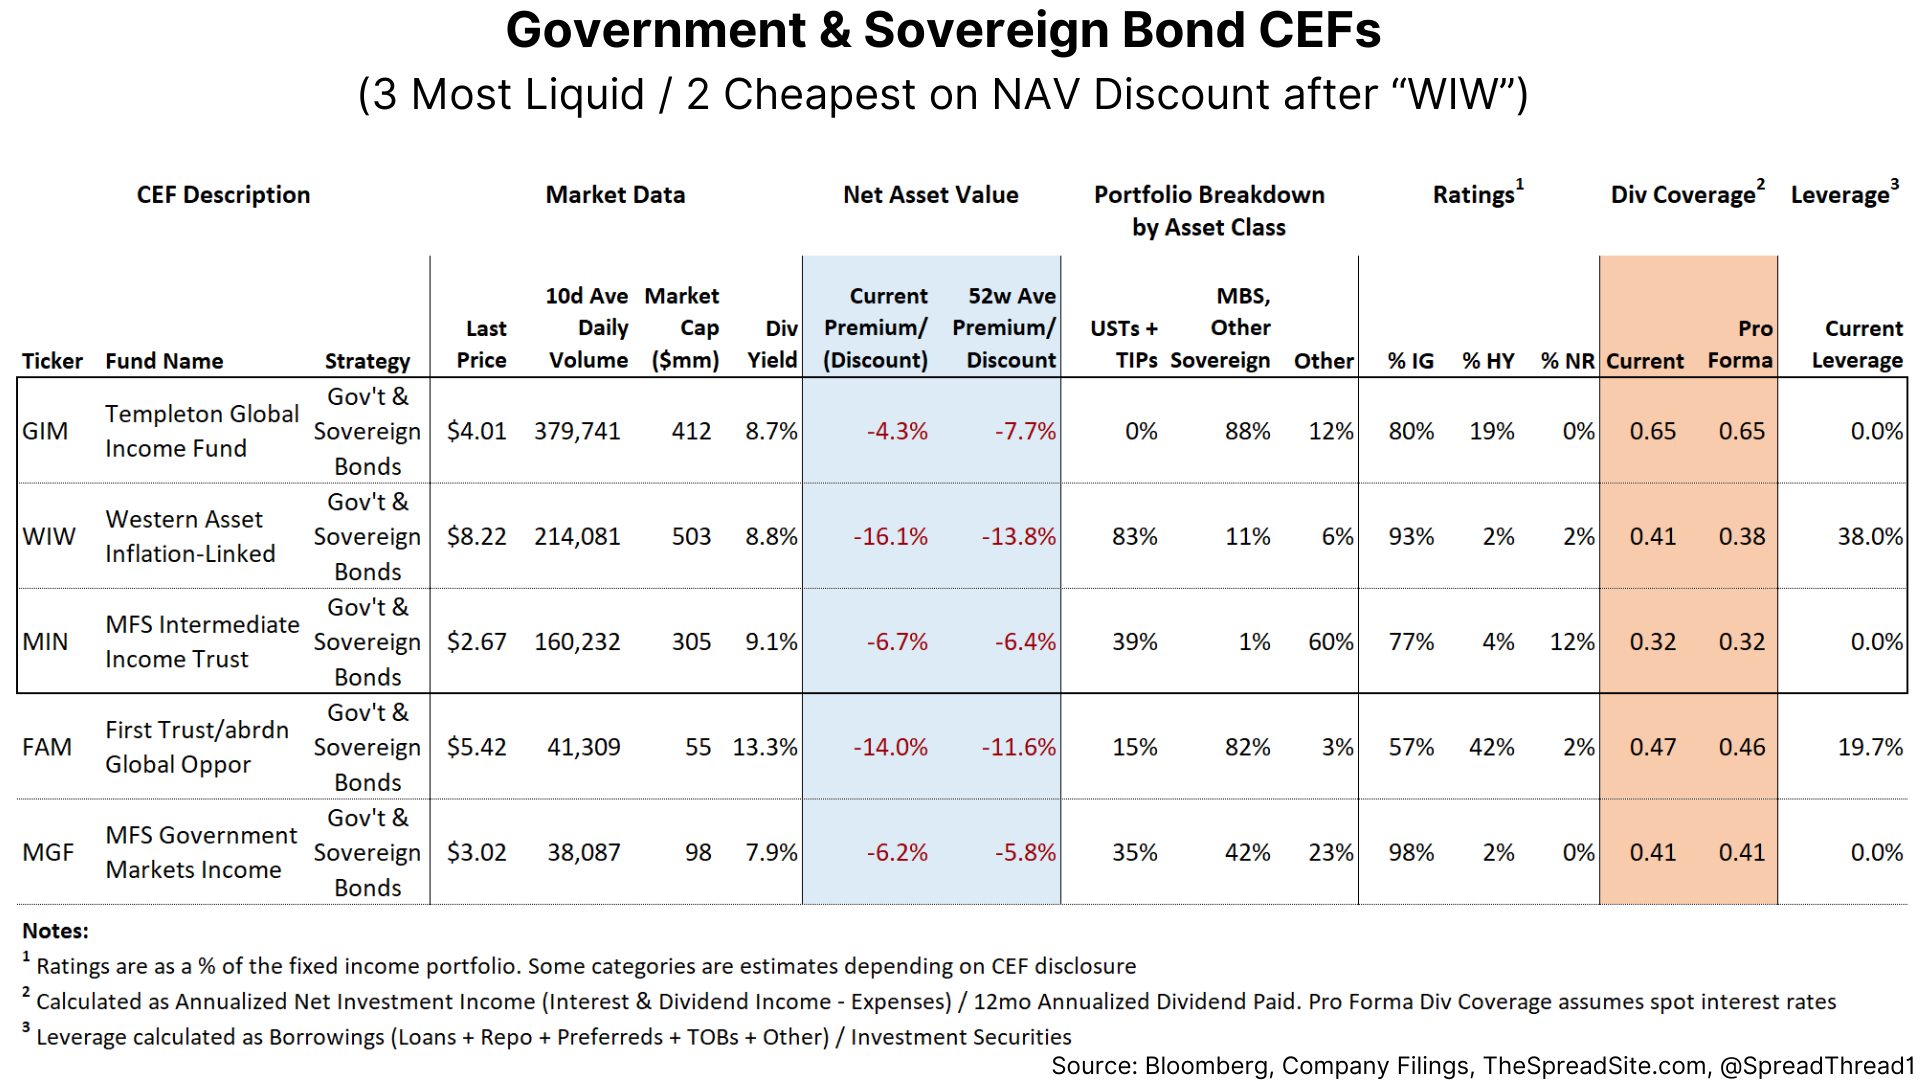
For those interested in TIPs, ("WIW") has over 80% of invested assets within this asset class. The remaining CEFs in the Government & Sovereign fixed income sector are as follows:
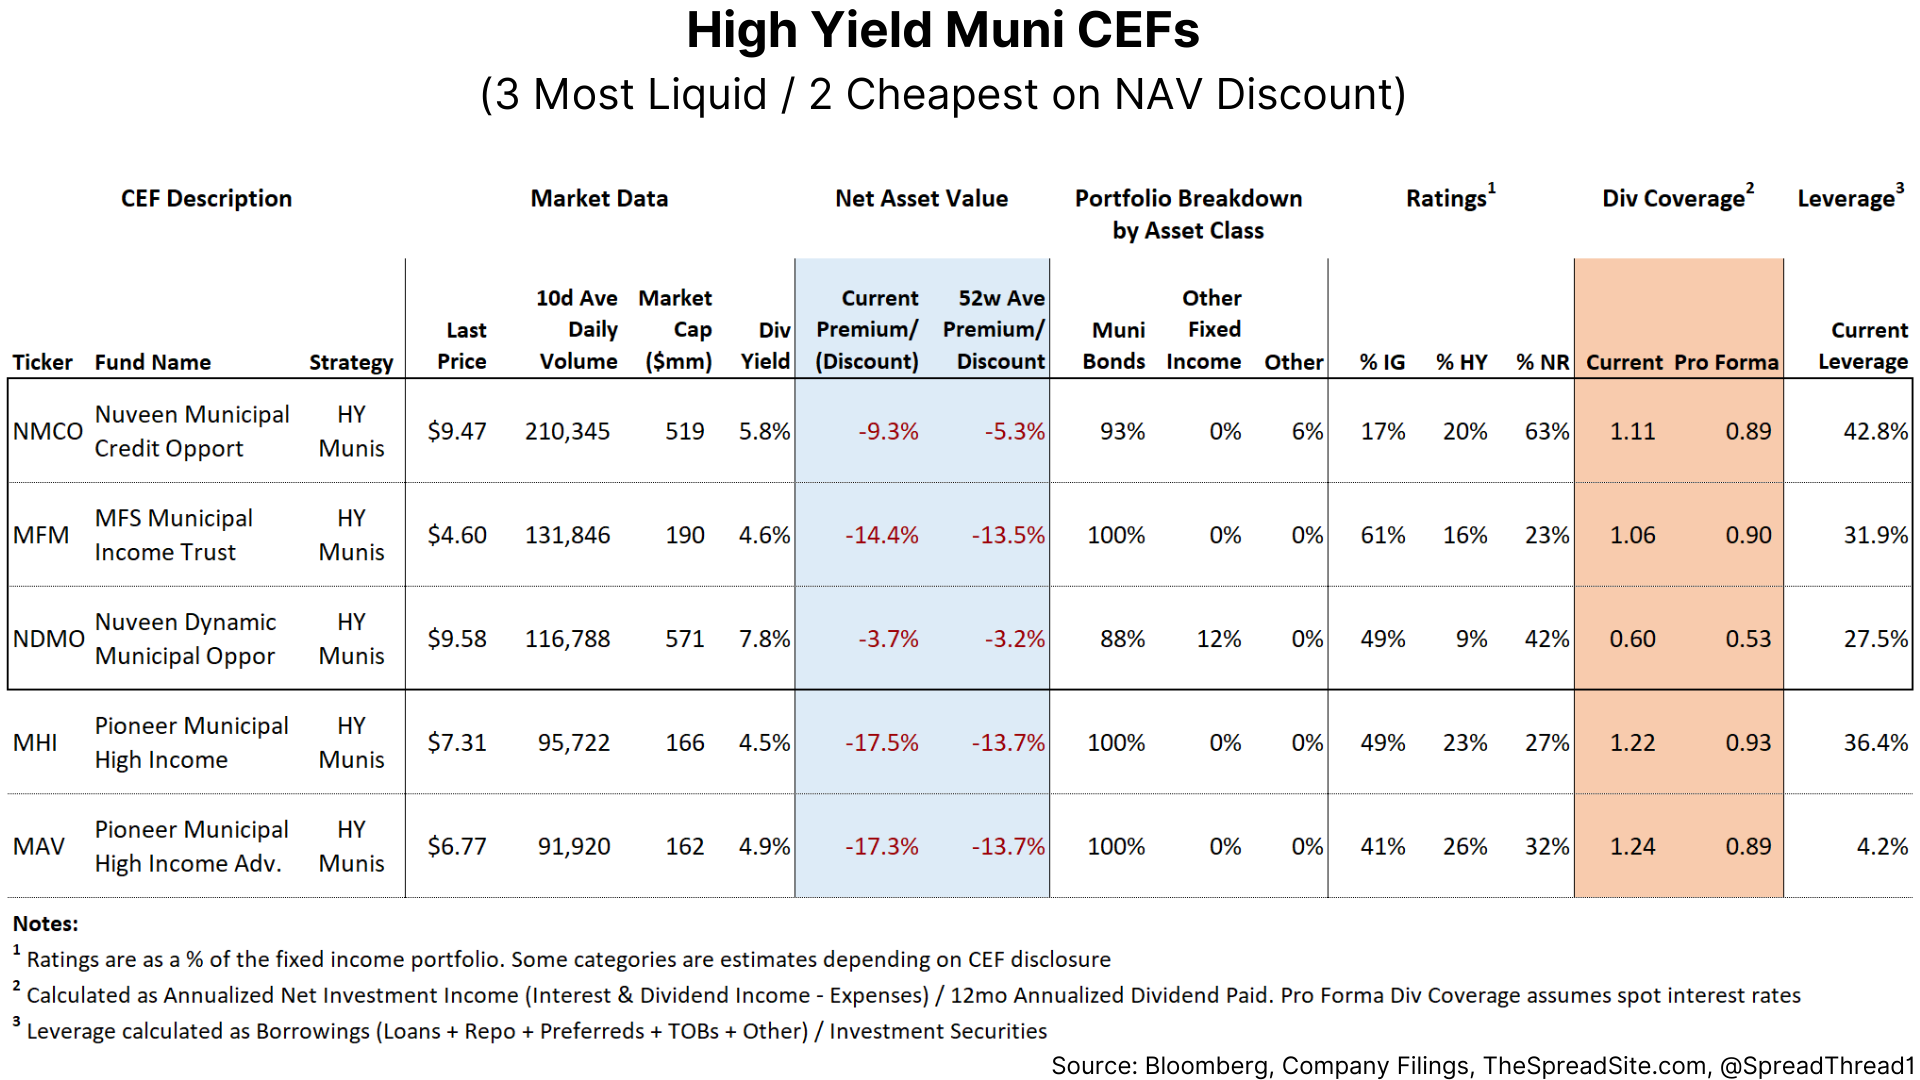
IG Municipal (as well as HY Munis) CEFs tend to use preferreds as their primary source of leverage. Consequently, it is more difficult to estimate a spot dividend rate as these are private securities with (occasional) limited disclosure and the pro forma dividend coverage here has a higher margin of error.
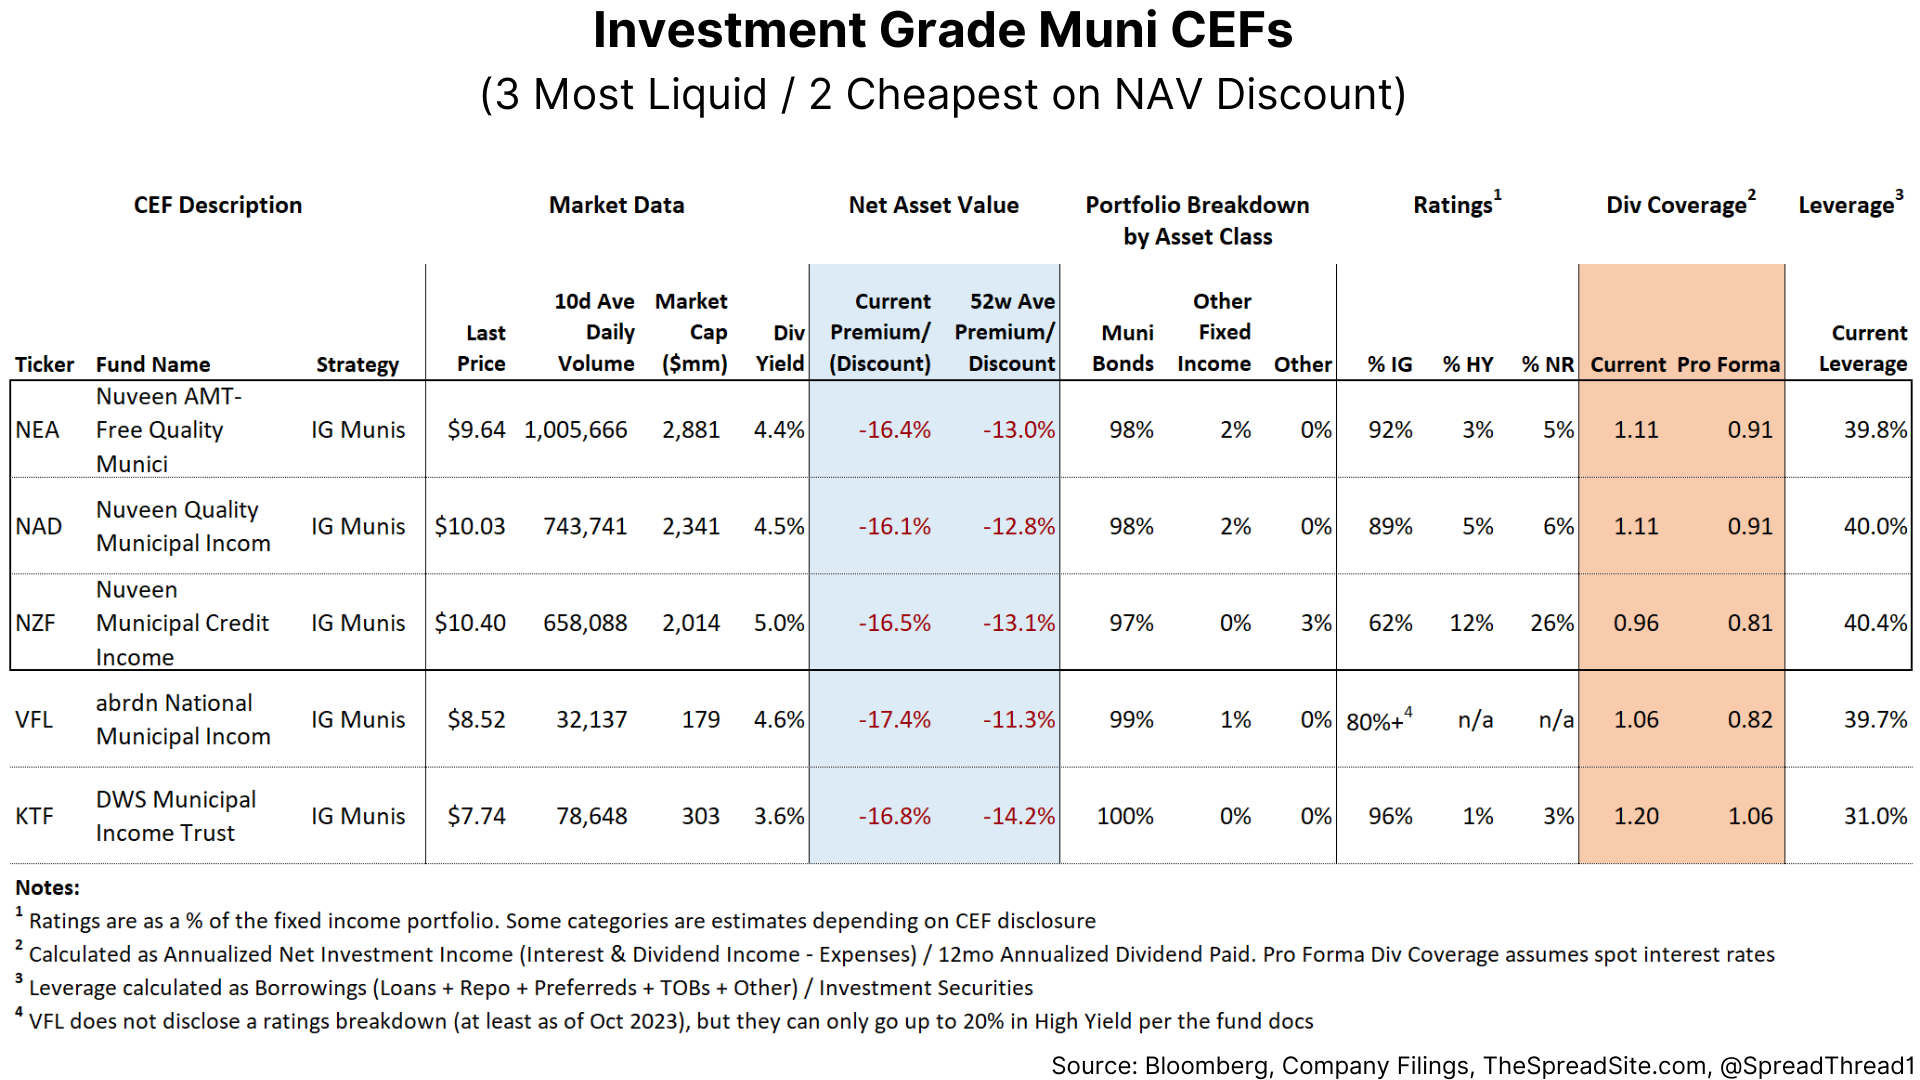
Since most municipal bonds are IG, even the HY Muni CEFs contain sizeable IG holdings.
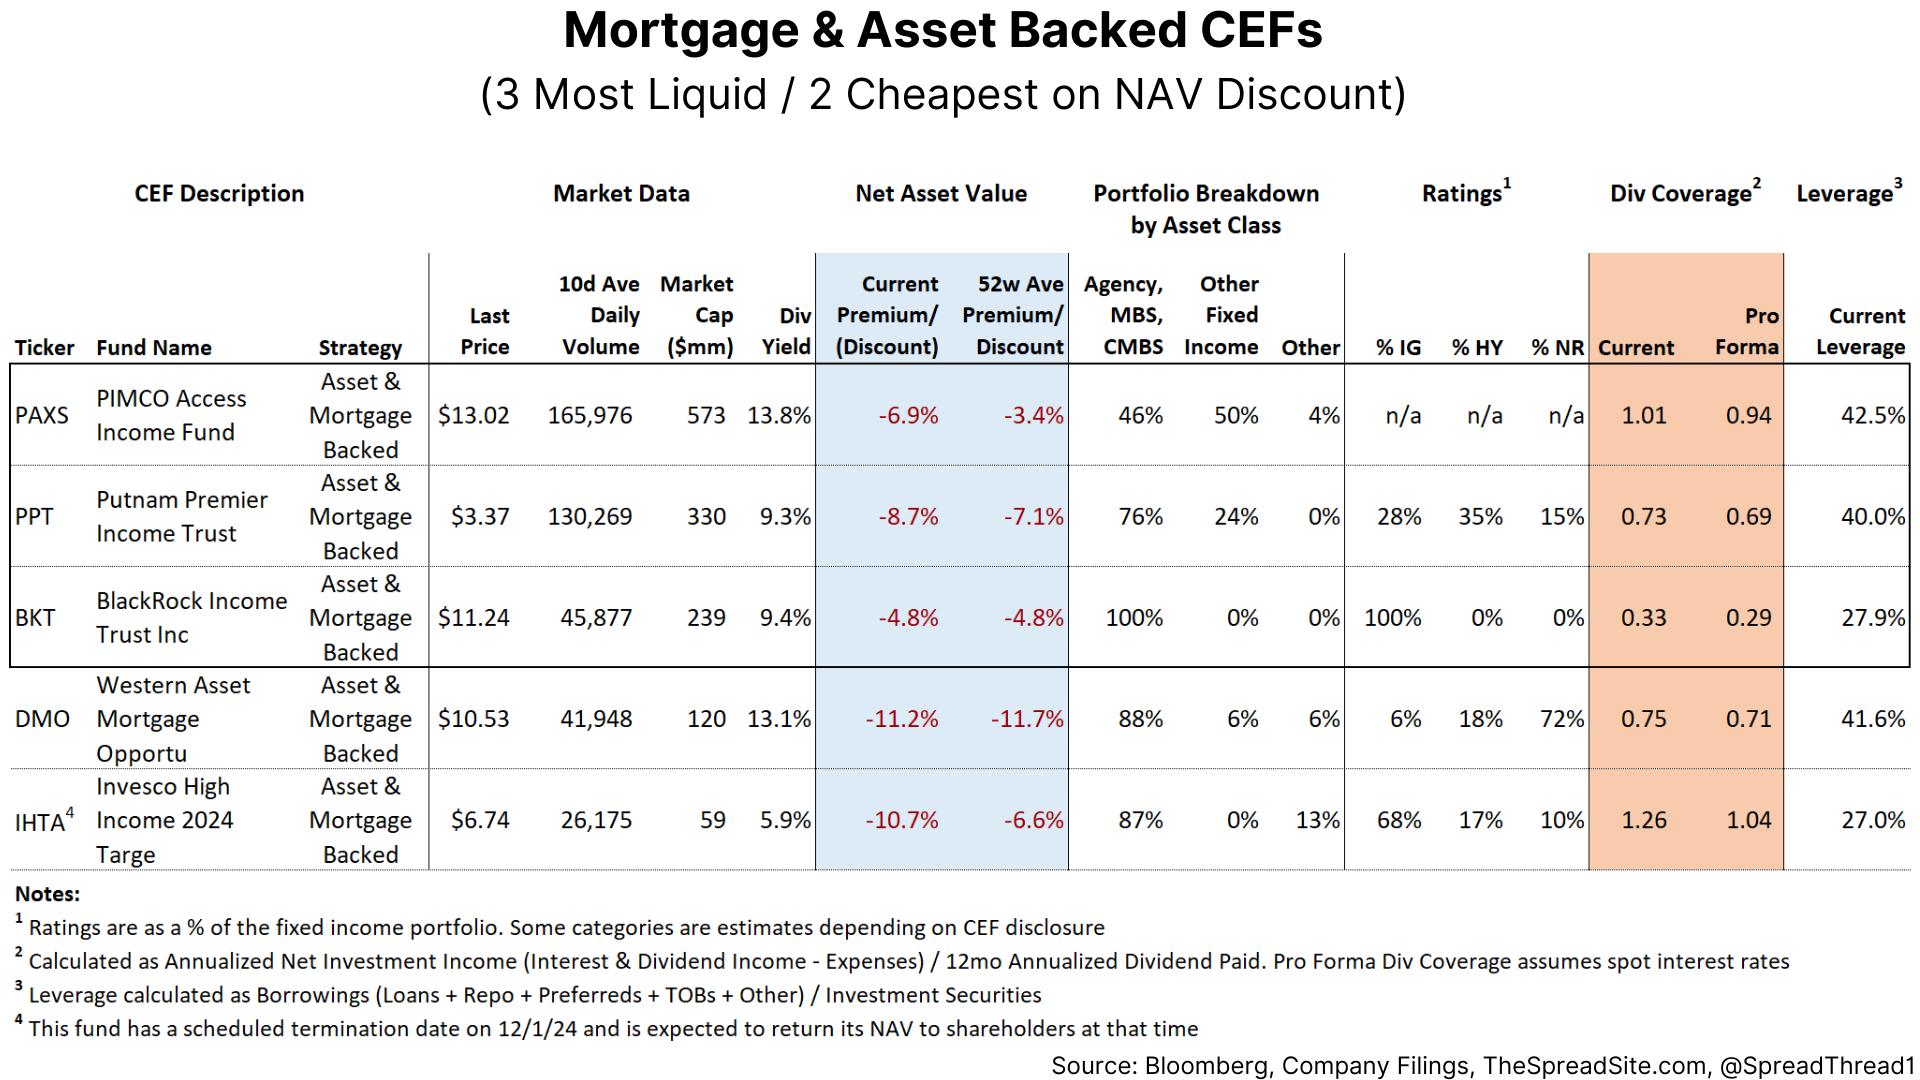
We show our last fixed income CEF table, Mortgage & Asset Backed below. We note that ("IHTA") is also a Target Date Fund, meaning it is scheduled to terminate and return net assets to shareholders in December 2024.
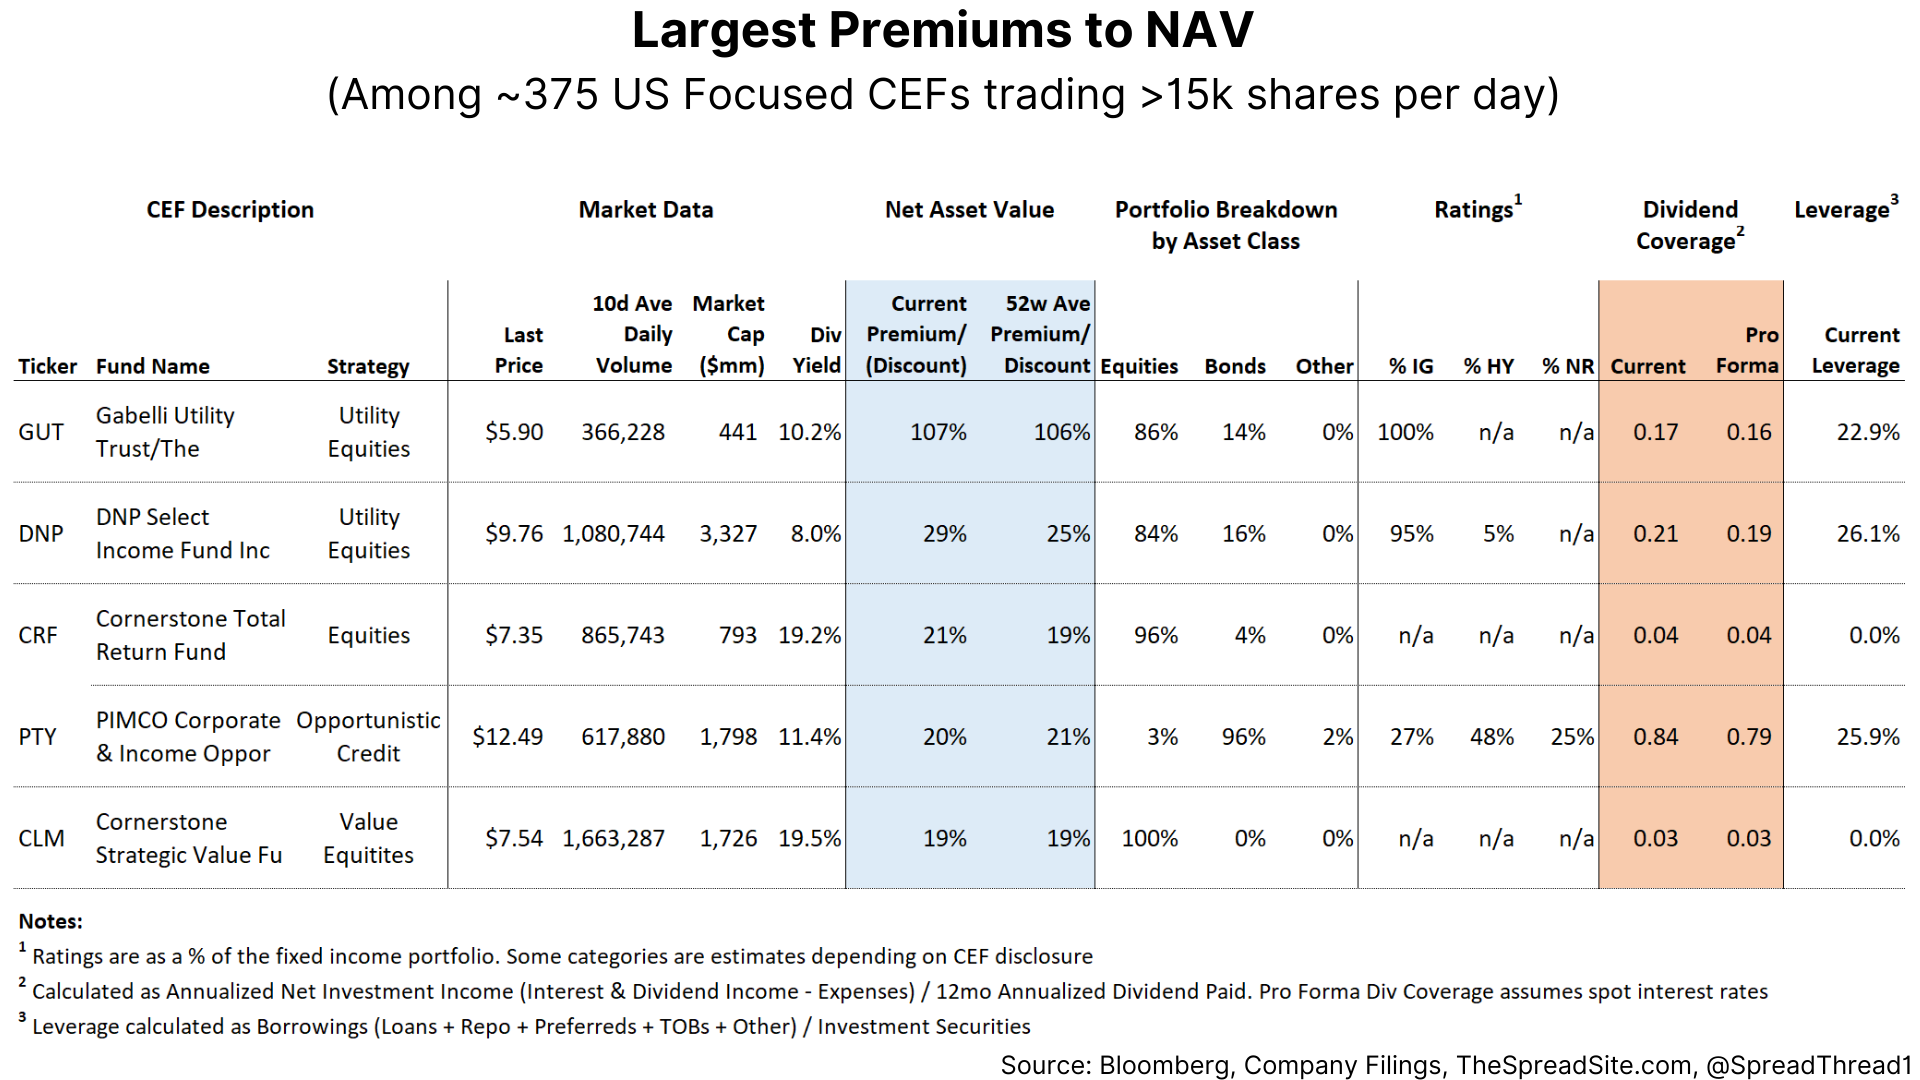
For those making it this far and still interested, we assure you the 102% premium on ("GUT") is not a clerical error, but certainly a head scratcher. The other CEFs with the Largest Premiums to NAV are below.
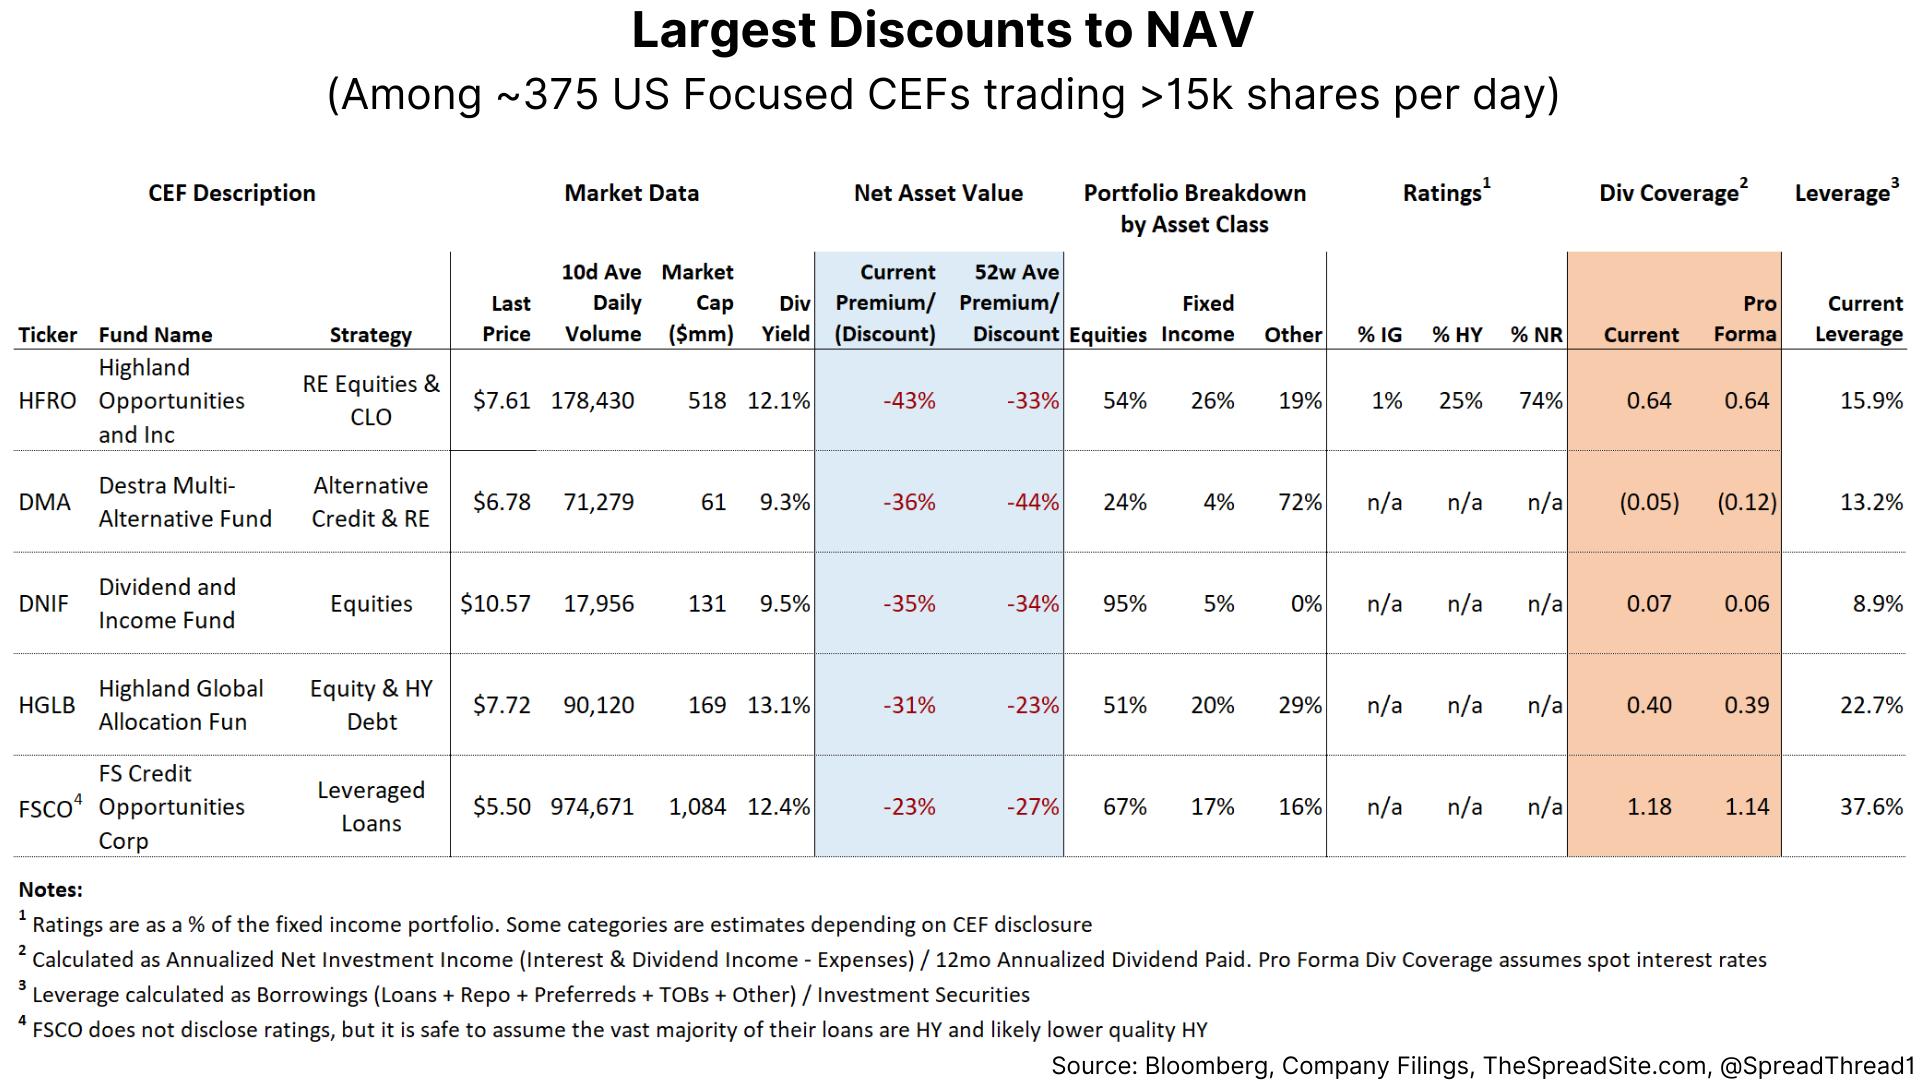
And lastly, we show the 5 CEFs with the Largest Discount to NAV. And yes, we double checked ("DMA"), they do have negative Net Investment Income, but pay out a 9%+ diviend yield.
Disclosures
Please click here to see our standard legal disclosures.
The Spread Site Research
Receive our latest publications directly to your inbox. Its Free!.
